Why you can trust Tom's Hardware
Comparison Products
We compare the HP FX900 to the aforementioned WD SN770 and its PCIe 3.0 sibling, the SN570. We’re also pitting it against the DRAM-less Samsung 980, the Phison E16-driven MSI Spatium M470, the very popular SK hynix Gold P31, and some high-end PCIe 4.0 drives in the Crucial P5 Plus and Kingston Fury Renegade. We compare all of these drives at the 1TB capacity.
Trace Testing - 3DMark Storage Benchmark
Built for gamers, 3DMark’s Storage Benchmark focuses on real-world gaming performance. Each round in this benchmark stresses storage based on gaming activities including loading games, saving progress, installing game files, and recording gameplay video streams.
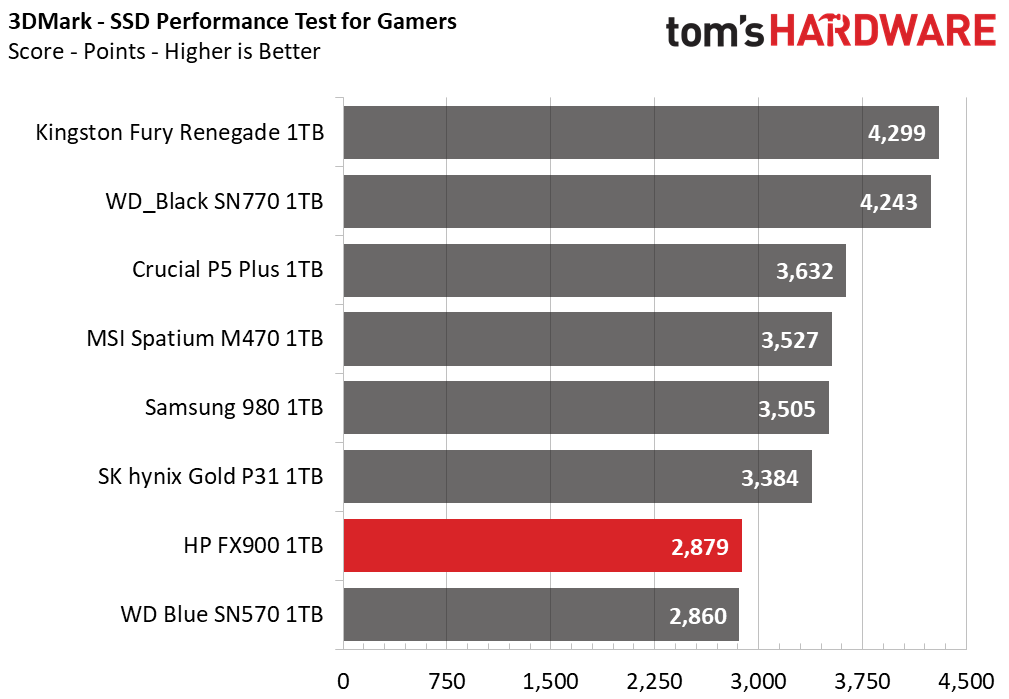
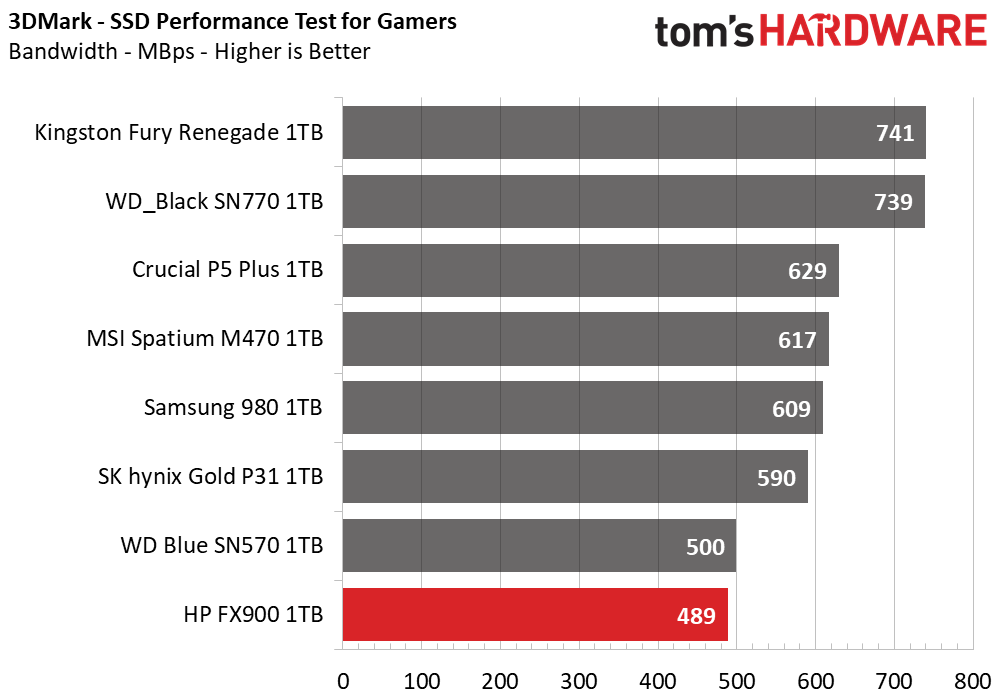
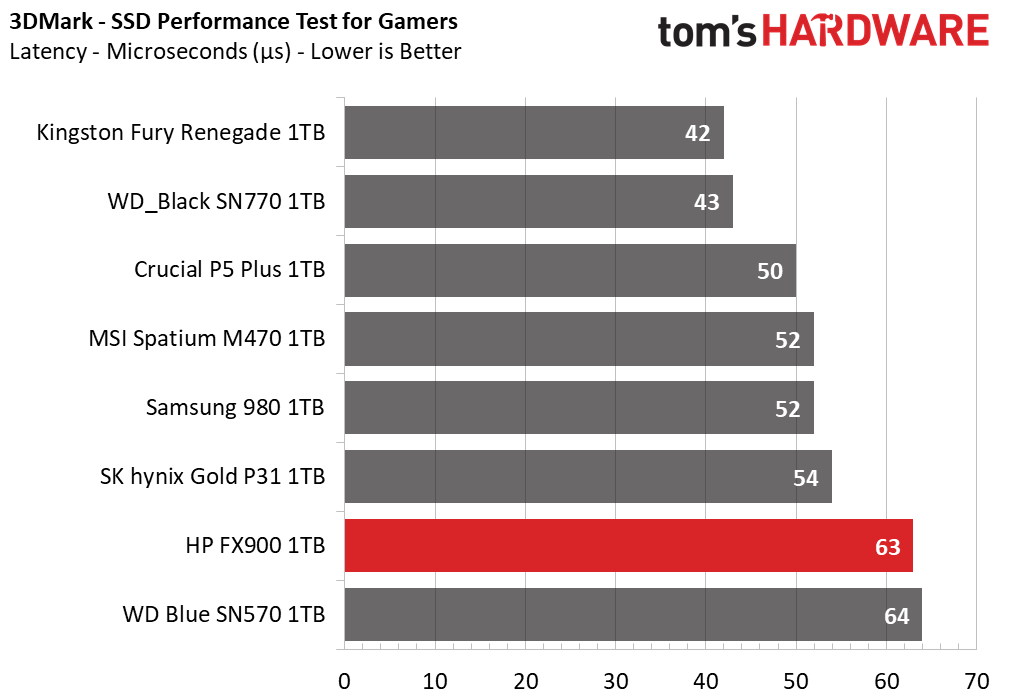
The HP FX900 does rather poorly here, ending up at the bottom with the SN570. This perhaps speaks to a limitation of InnoGrit’s SSD controller firmware optimization. Even though the company was founded by industry veterans, InnoGrit is still a new manufacturer. The company proved itself with the IG5236, plus we also often see firmware pains with early Phison products. WD, for their part, have shown an incredible capacity for getting the most out of their hardware with optimization, as with the SN850 and SN770.
Trace Testing – PCMark 10 Storage Benchmark
PCMark 10 is a trace-based benchmark that uses a wide-ranging set of real-world traces from popular applications and everyday tasks to measure the performance of storage devices.
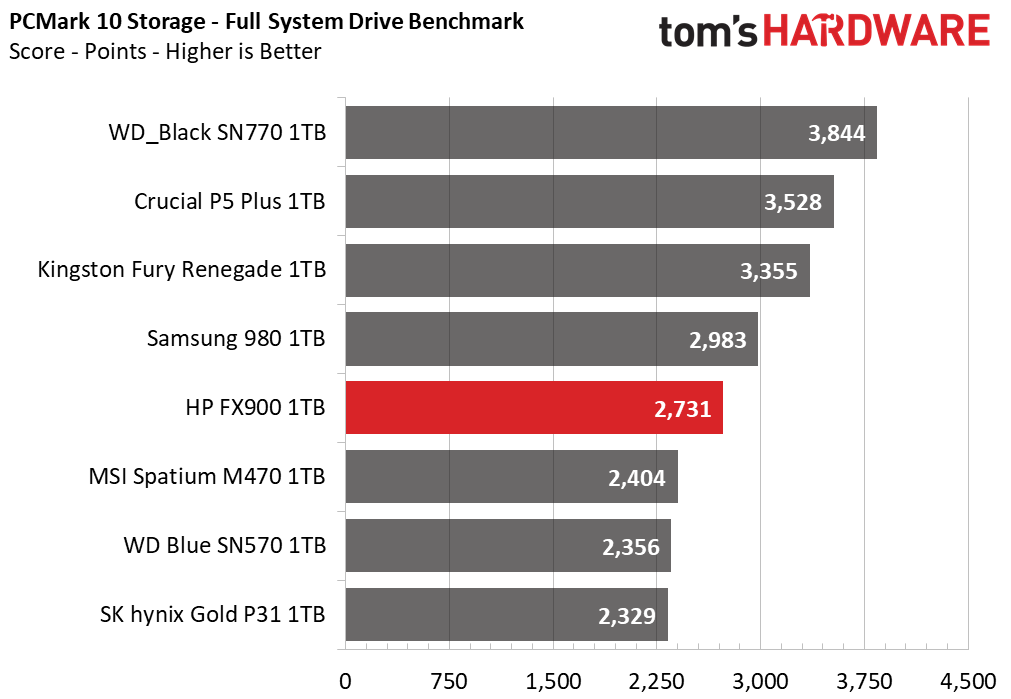
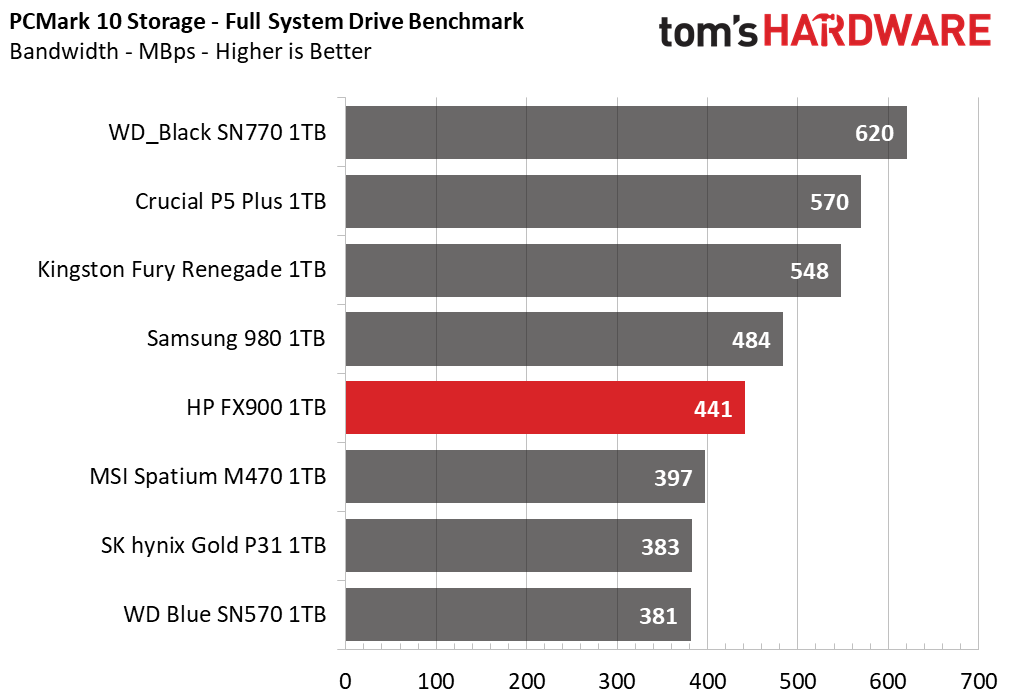
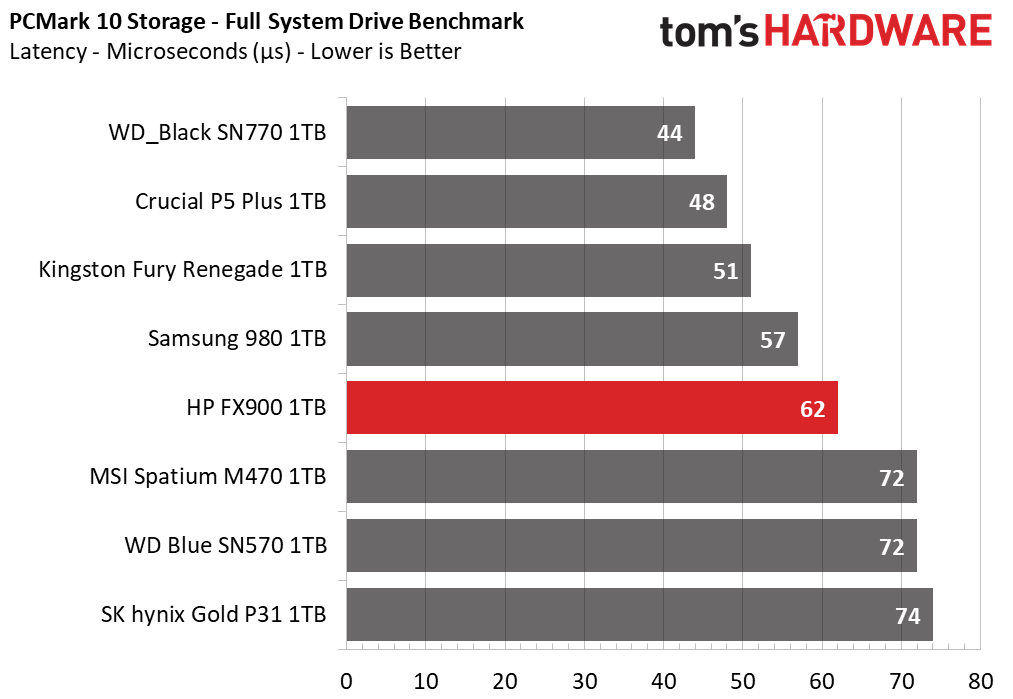
The FX900 does better here, ending up in the middle of the pack alongside Samsung’s 980. It’s not surprising that the drive struggles both with this test and 3DMark as there are some similarities in the testing mechanics.
Transfer Rates – DiskBench
We use the DiskBench storage benchmarking tool to test file transfer performance with a custom, 50GB dataset. We copy 31,227 files of various types, such as pictures, PDFs, and videos to a new folder and then follow-up with a reading test of a newly-written 6.5GB zip file.
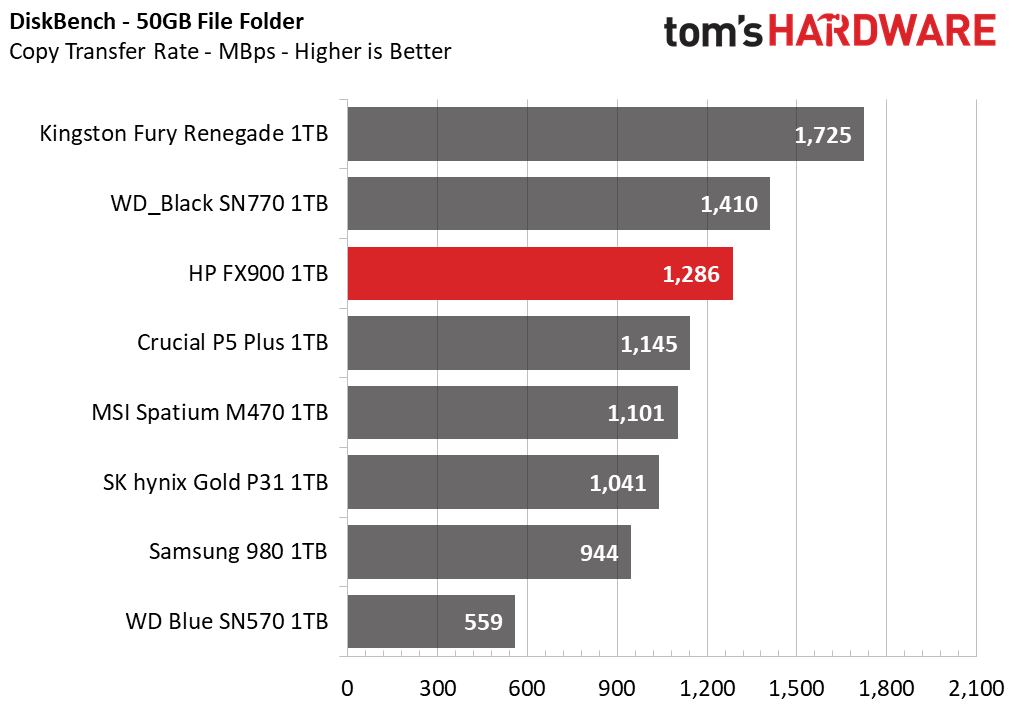
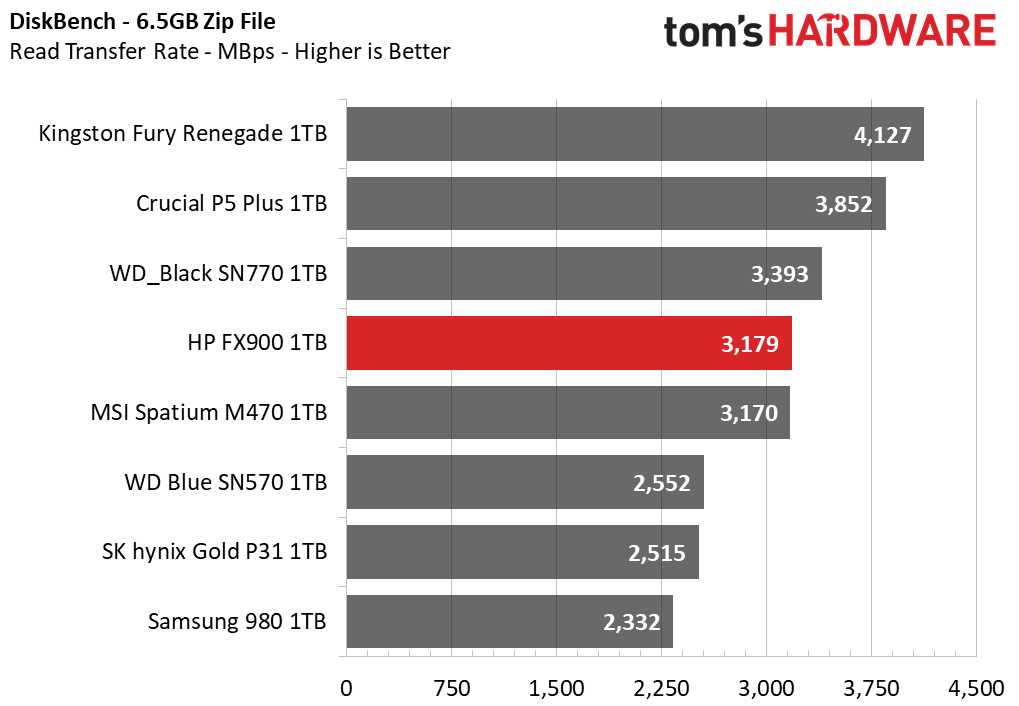
DiskBench is a bandwidth-constrained test, and as such, it likes sequential performance. This explains why the FX900 scores close to the E16-driven M470 and the SN770. It’s certainly more of a “real” PCIe 4.0 drive than something like the S50 Lite, but neither is it pushing the limits of the interface. Quad-channel controllers, in this case, are effectively limited by their bus speeds.
Get Tom's Hardware's best news and in-depth reviews, straight to your inbox.
Synthetic Testing - ATTO / CrystalDiskMark
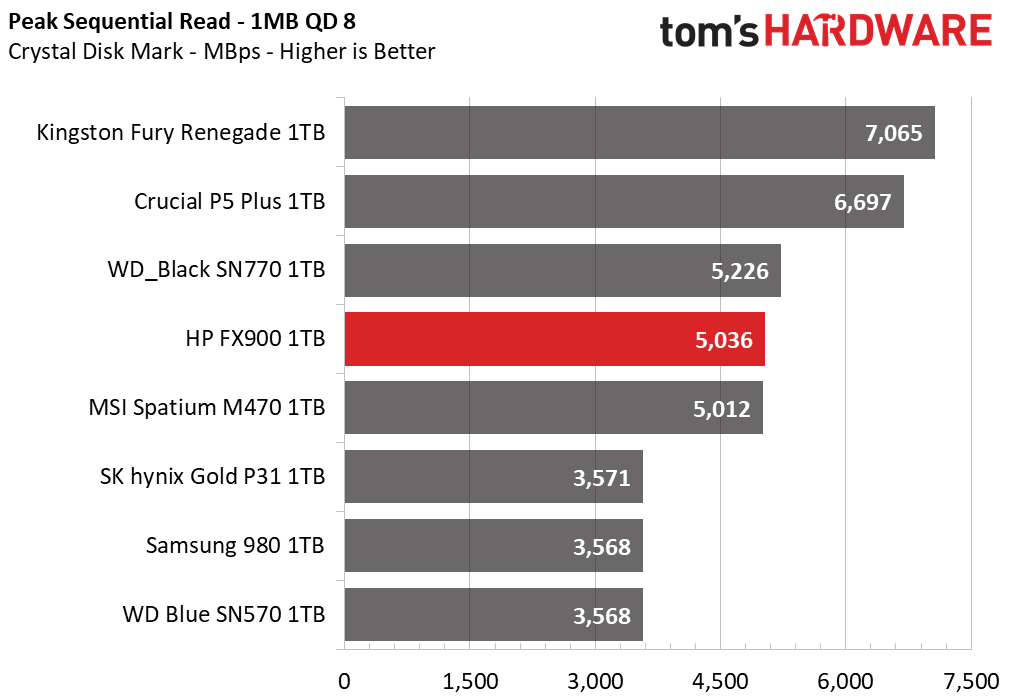
ATTO and CrystalDiskMark (CDM) are free and easy-to-use storage benchmarking tools that SSD vendors commonly use to assign performance specifications to their products. Both of these tools give us insight into how each device handles different file sizes.
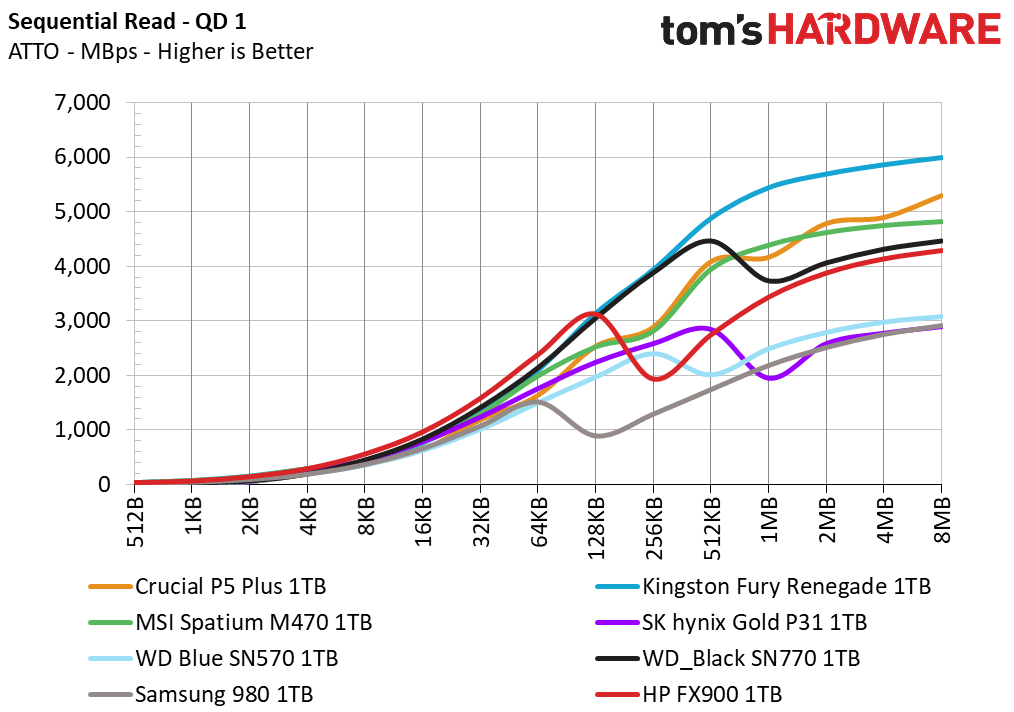
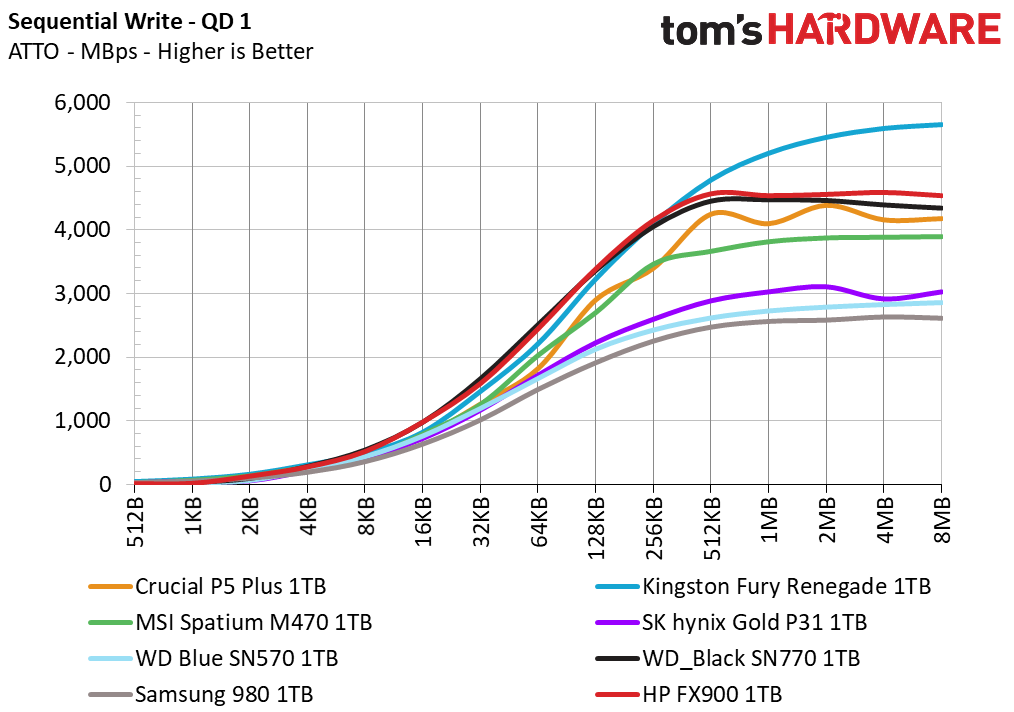
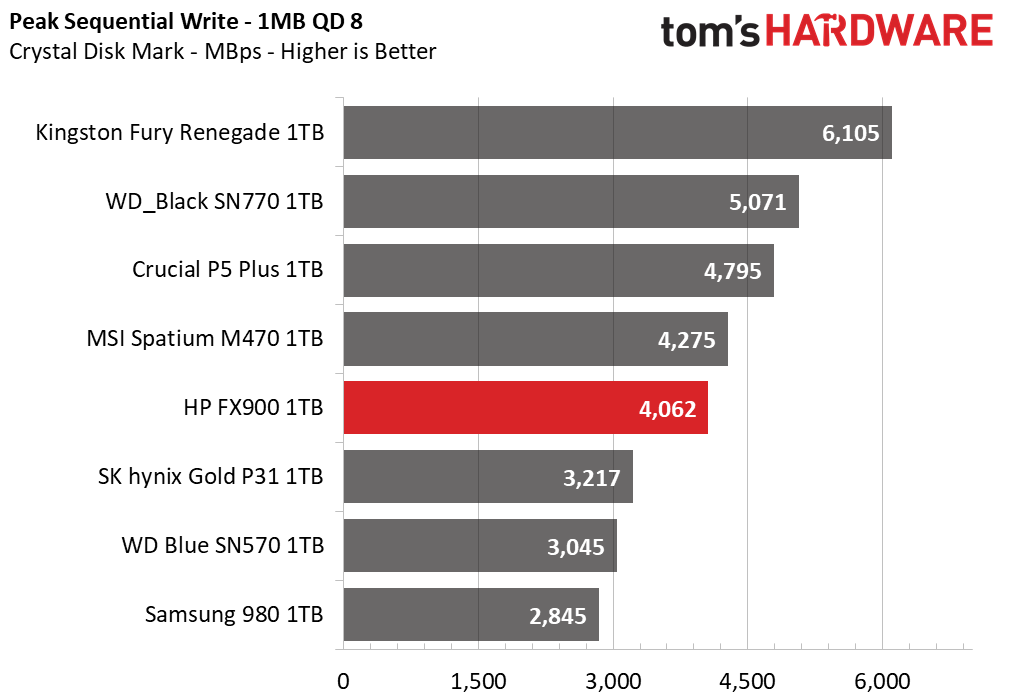
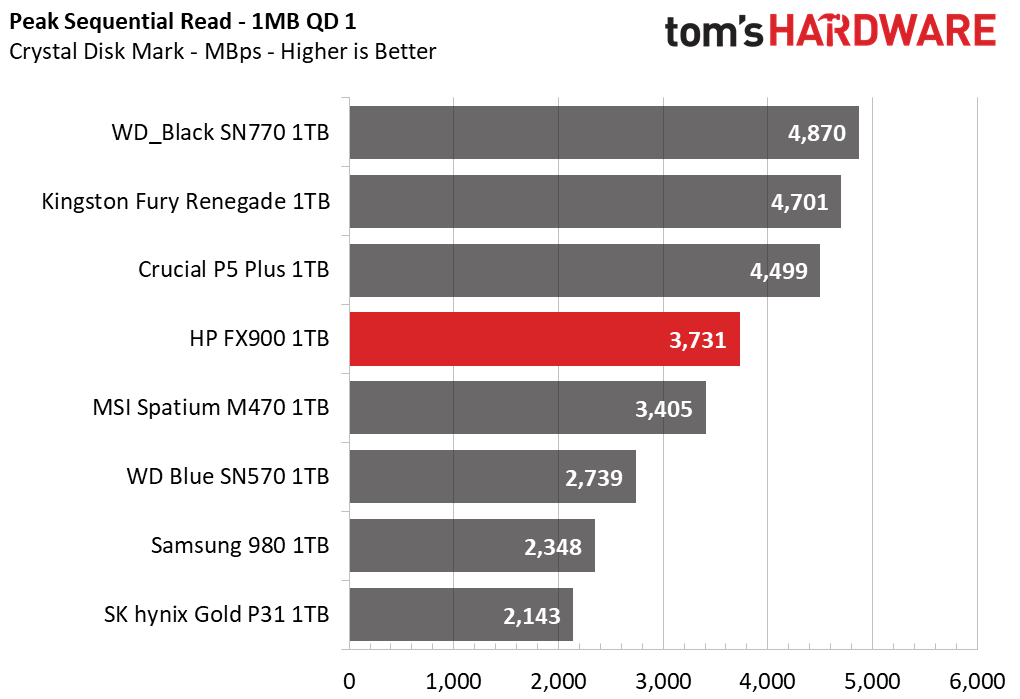
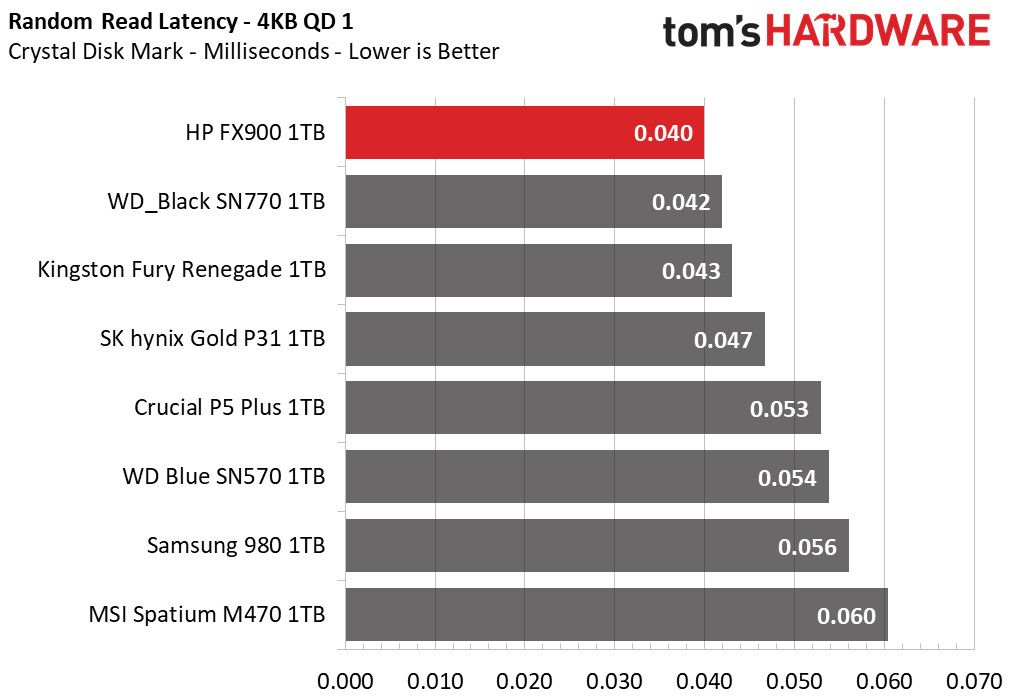
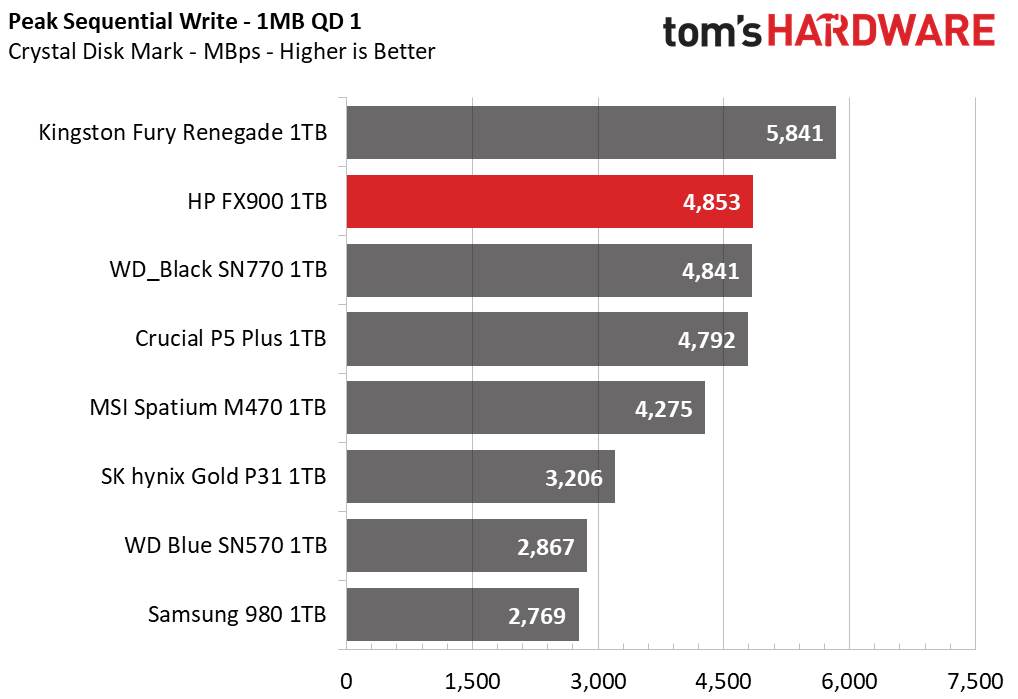
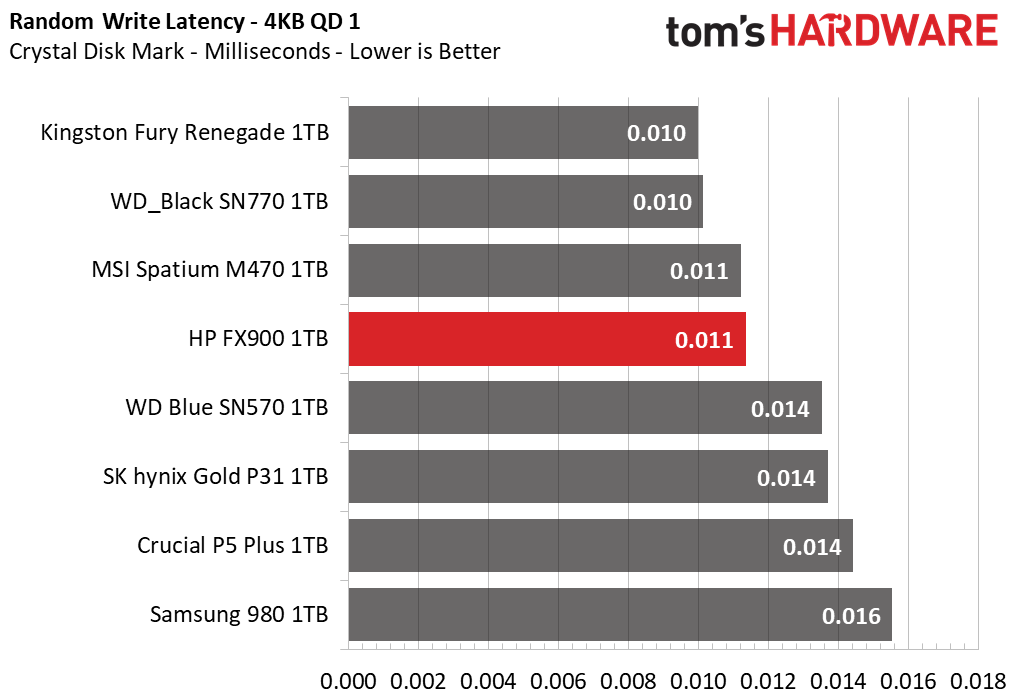
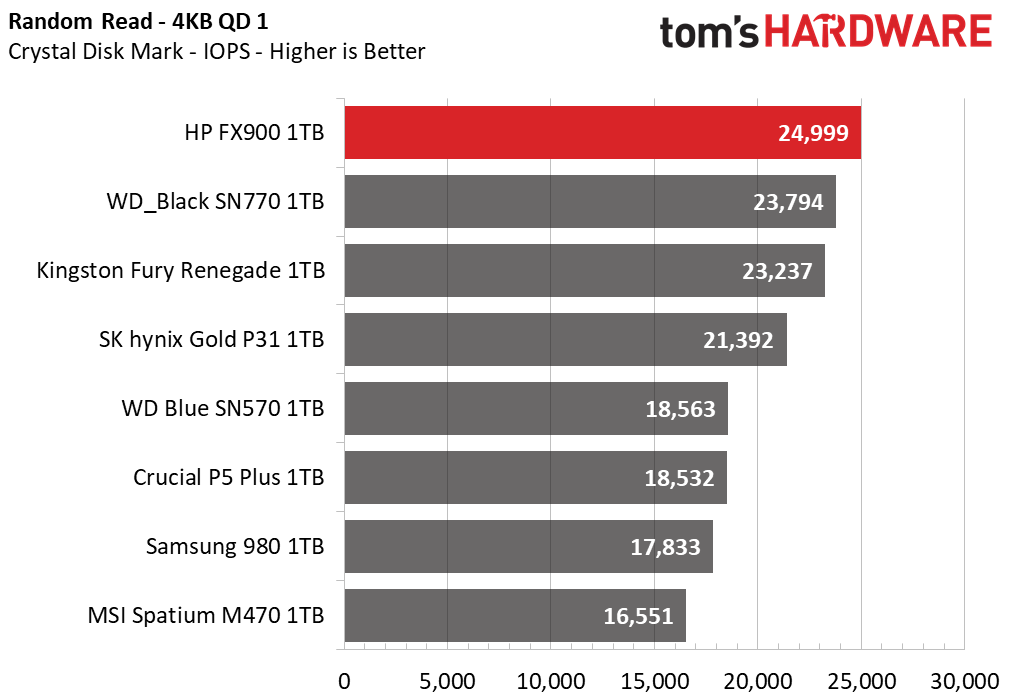
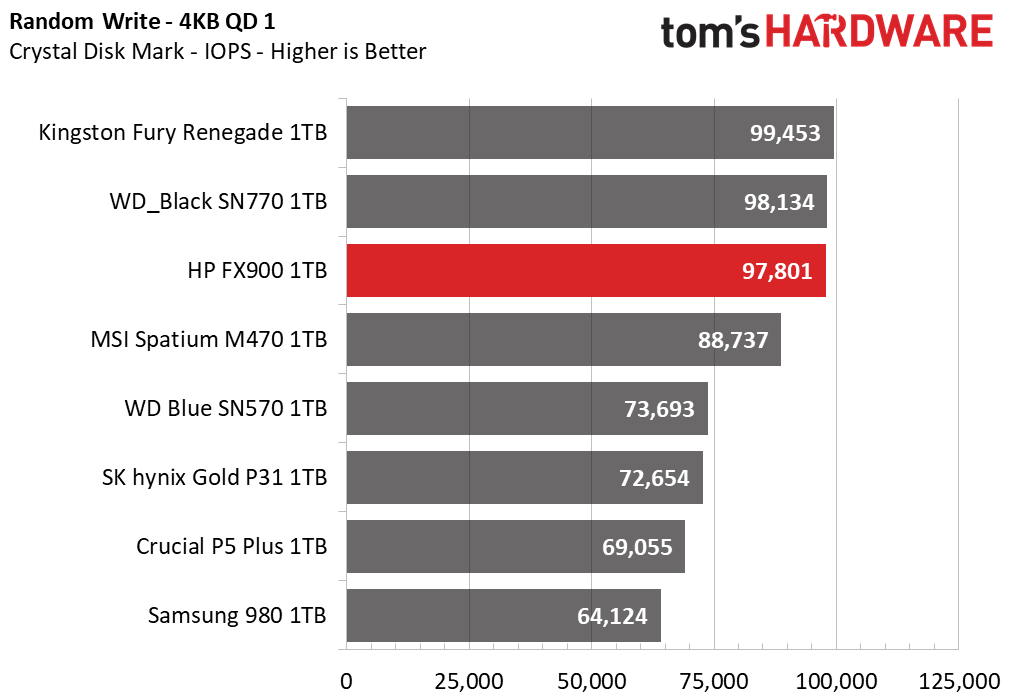
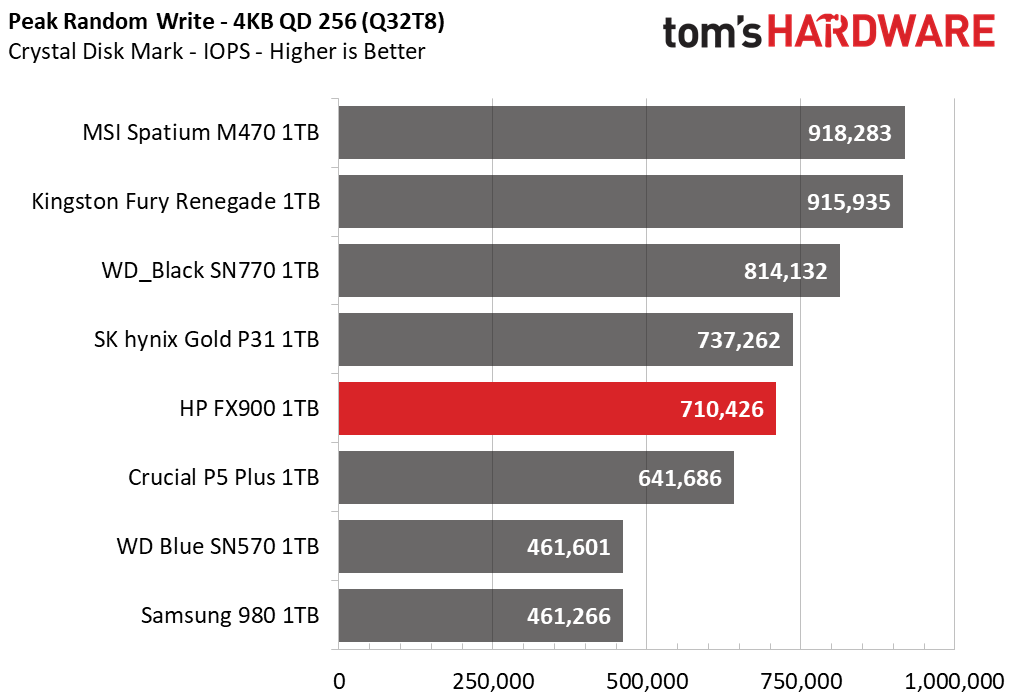
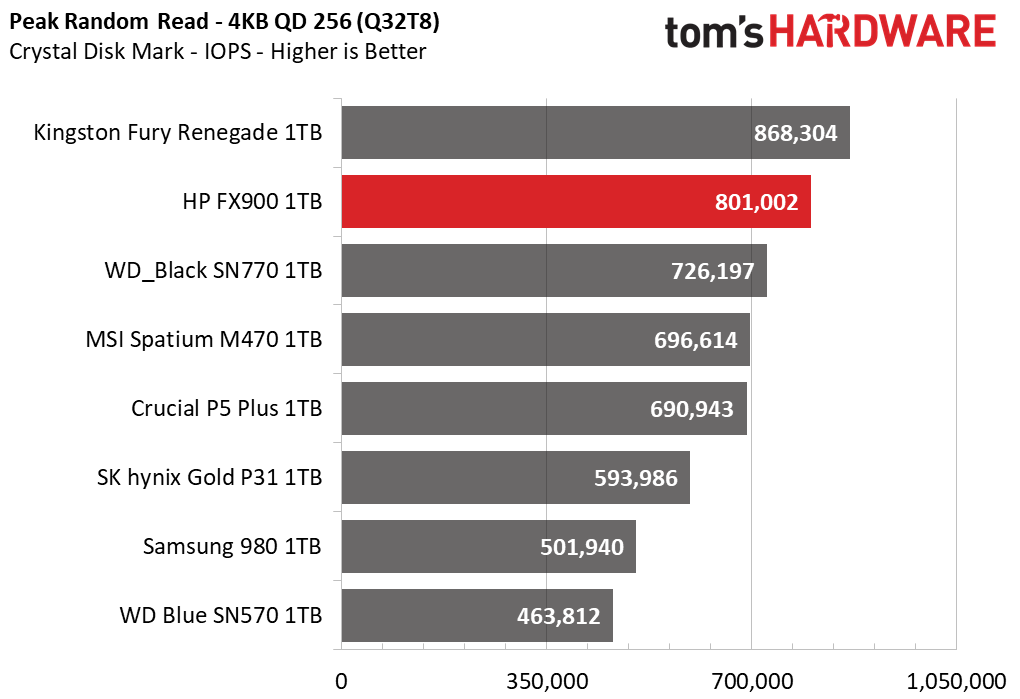
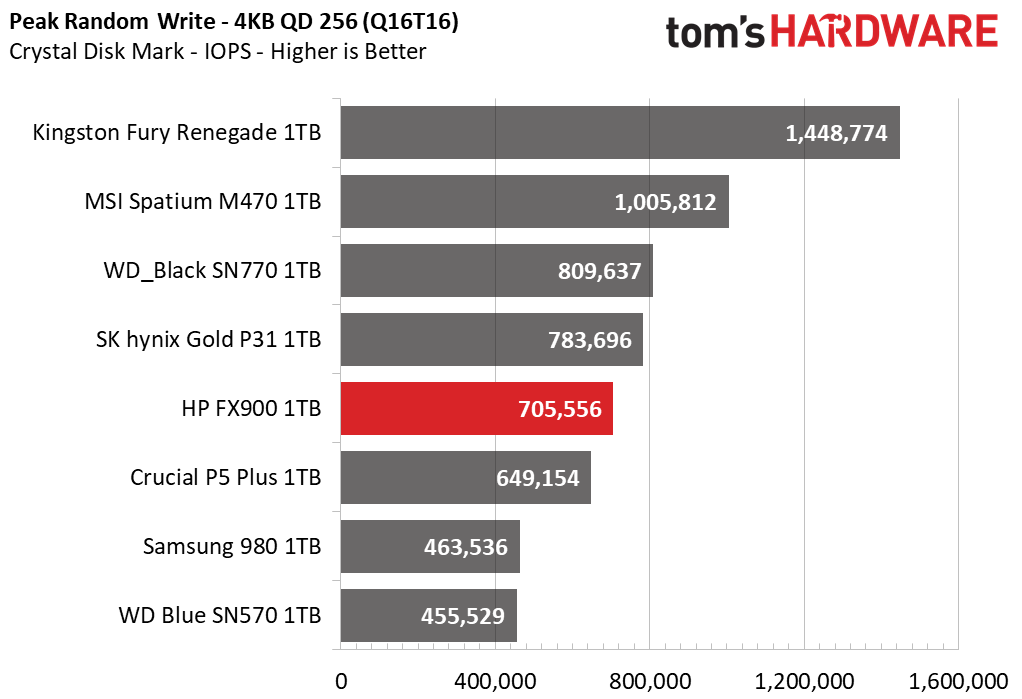
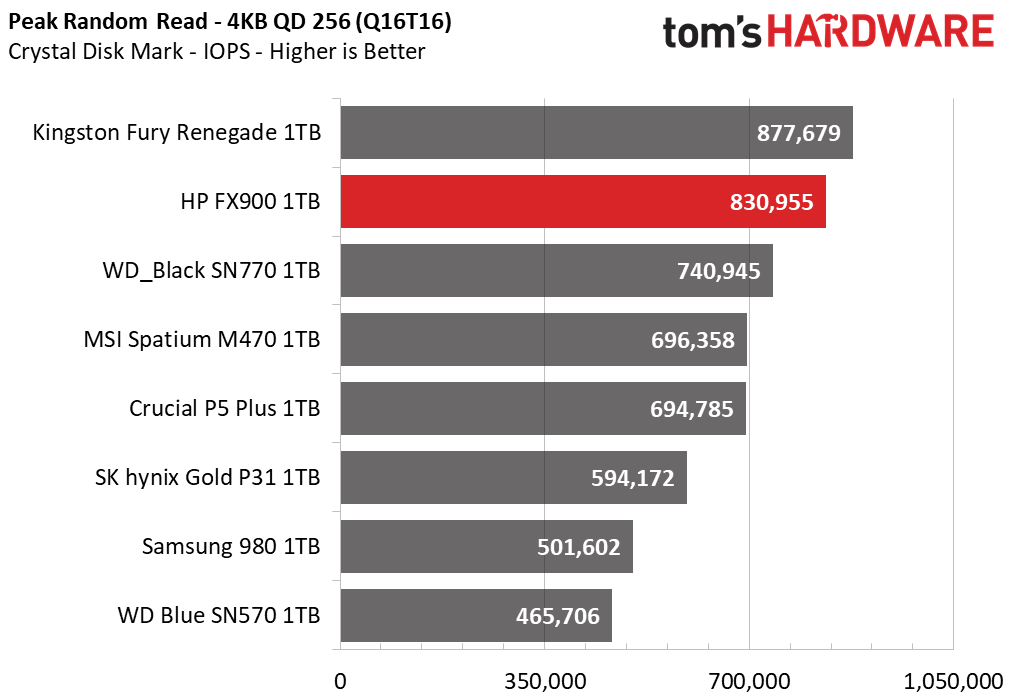
We expect the queue depth 1 (QD1) sequential results in ATTO to be similar to DiskBench, and that is the case. It’s useful to look at these results to see how different designs are optimized. For example, the FX900 falls behind in reads at bigger block sizes, but dominates with writes. The Phison E18 controller, as always and especially with 176-layer TLC in the Fury Renegade, continues to show superiority at peak performance. What we really see is that the E16 is showing its age in the M470, particularly as it is using an older flash.
CDM’s sequential QD1 tests demonstrate nothing new, although it is again surprising how well the SN770 performs. However, the FX900 finally shines in the random QD1 tests, effectively topping the charts alongside the SN770 and Fury Renegade. For the SN770, this is due to optimization; with the Fury Renegade, it’s the powerful controller and especially the 176-layer flash. The FX900 also uses this flash, as does the P5 Plus, but we can tell Crucial’s optimization is different.
For everyday users, it’s clear the FX900 and SN770 will both offer an optimal experience despite being “budget” alternatives.
Sustained Write Performance and Cache Recovery
Official write specifications are only part of the performance picture. Most SSDs implement a write cache, which is a fast area of (usually) pseudo-SLC programmed flash that absorbs incoming data. Sustained write speeds can suffer tremendously once the workload spills outside of the cache and into the "native" TLC or QLC flash. We use Iometer to hammer the SSD with sequential writes for 15 minutes to measure both the size of the write cache and performance after the cache is saturated. We also monitor cache recovery via multiple idle rounds.
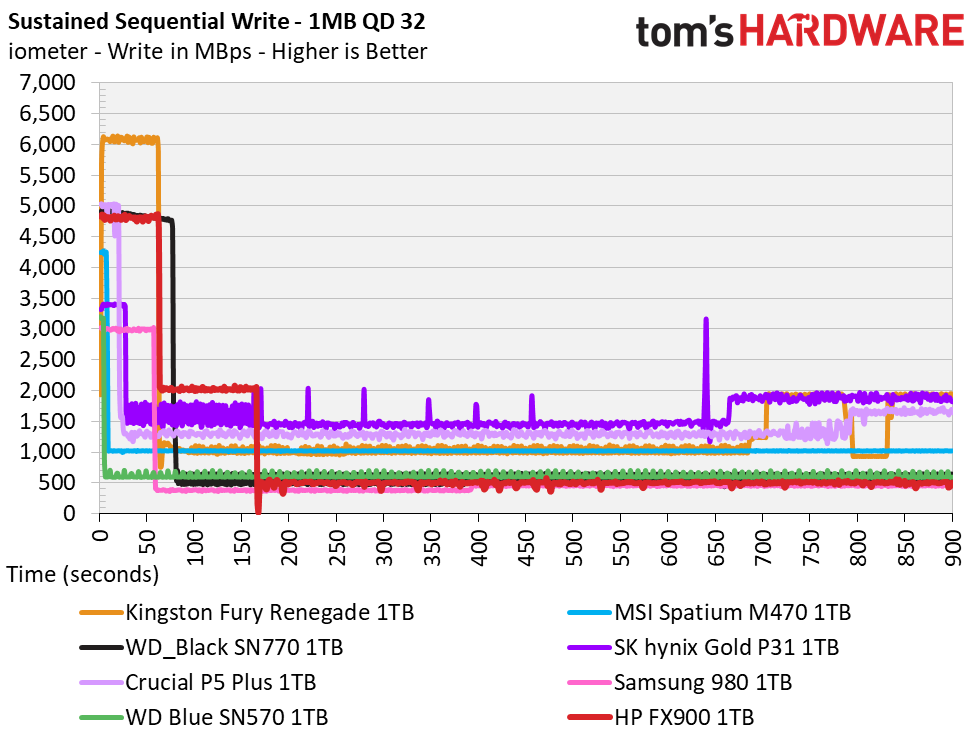
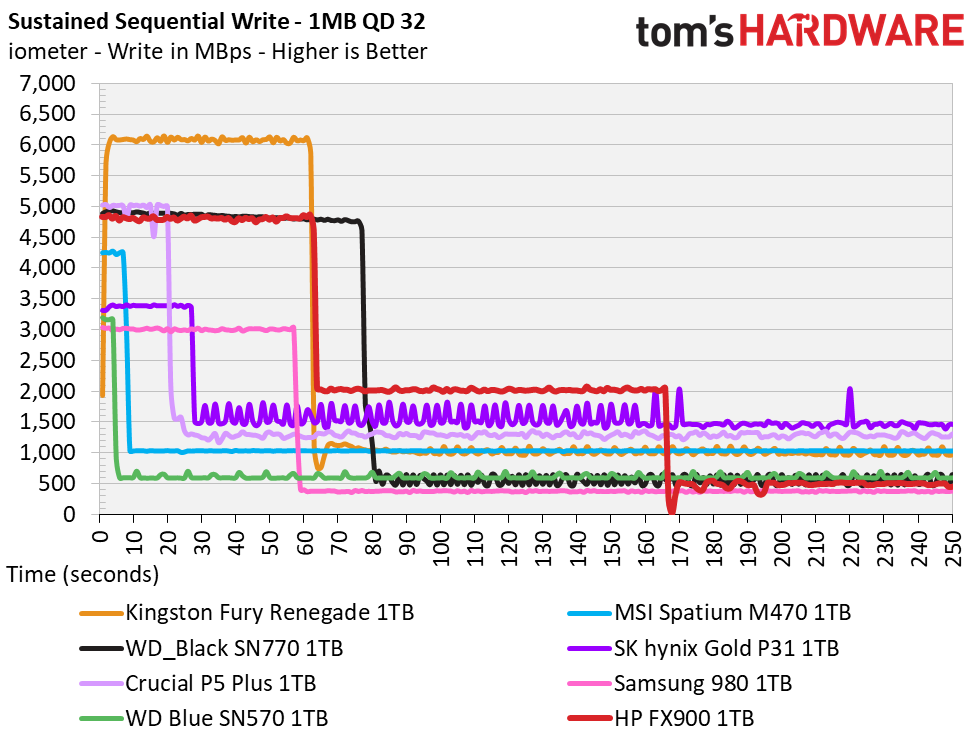
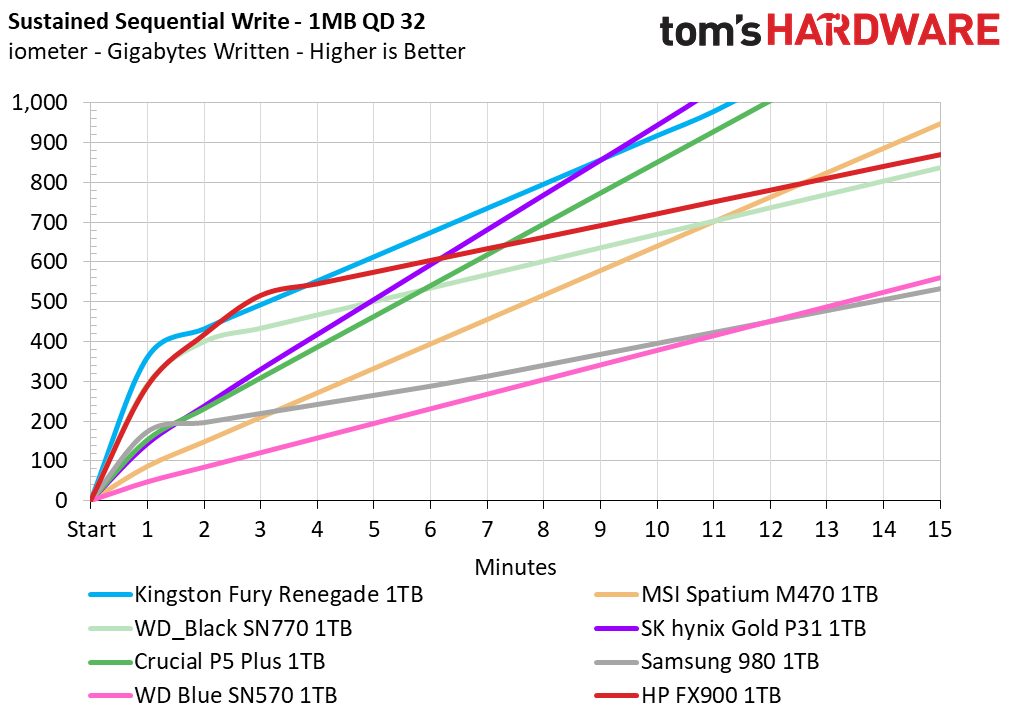
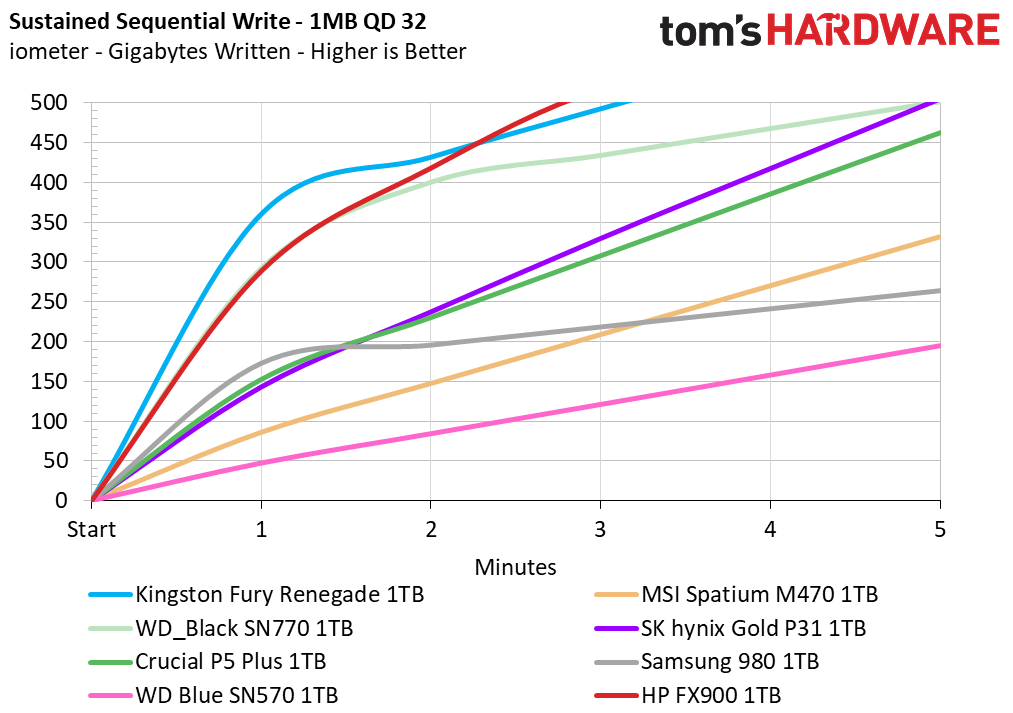
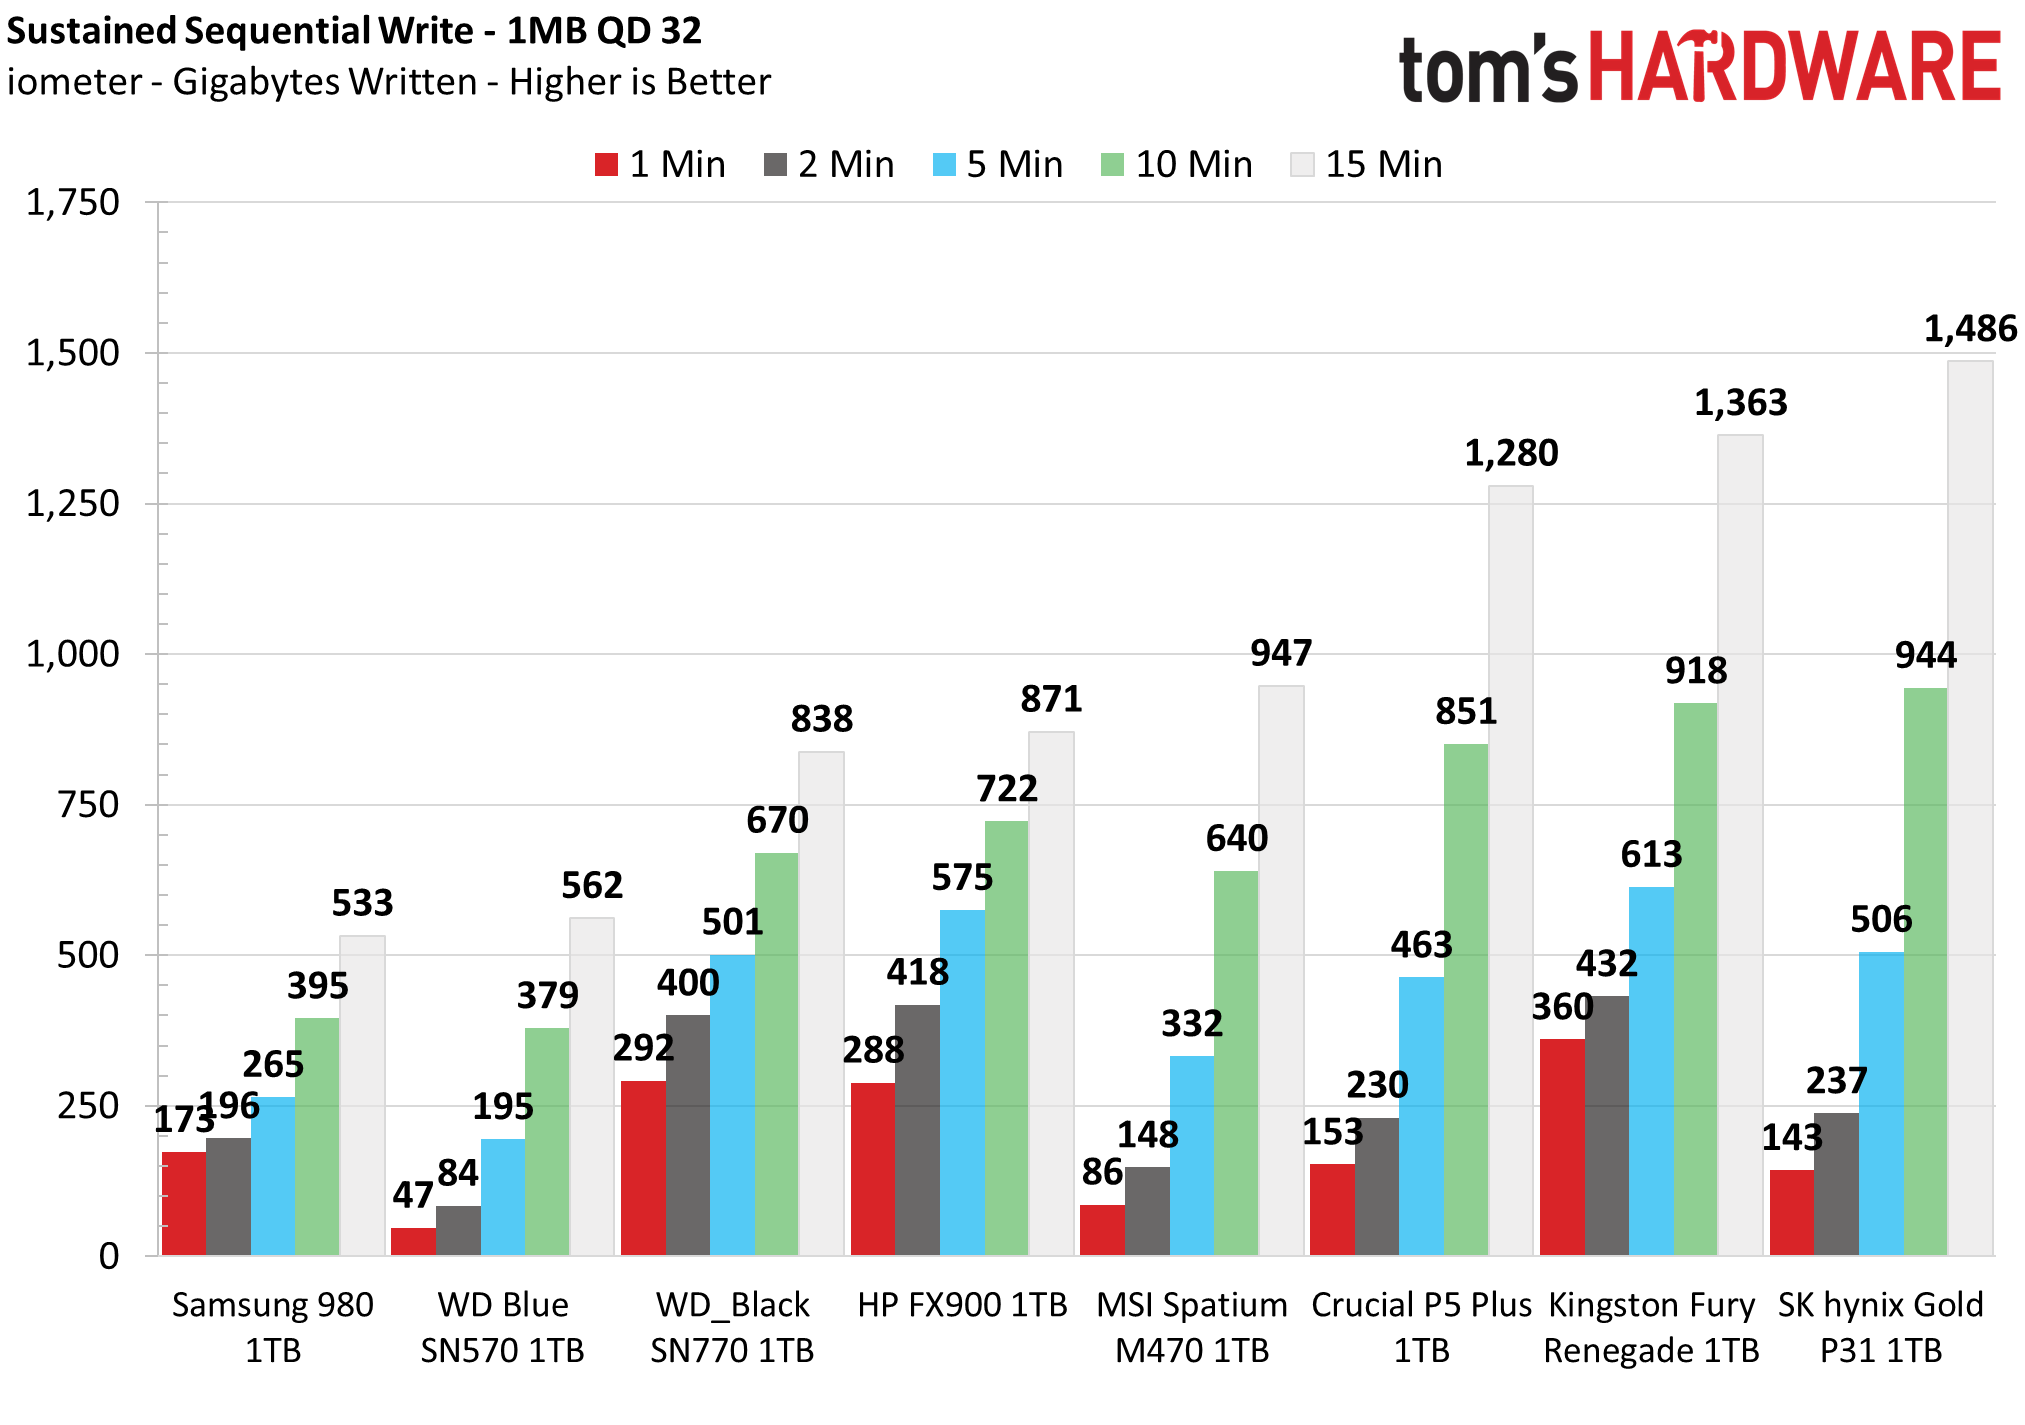
The FX900 writes at around 4.8 GBps for approximately 63 seconds, suggesting a cache size of around 300GB. This isn’t all of the flash in pSLC mode, and the drive then falls to a direct-to-TLC mode at around 2 GBps. It can sustain this for quite some time before hitting a folding state at around 500 MBps.
This excellent result pushes the limits of what you could expect from a 4-channel, DRAM-less drive with flash of this quality. The SN770 sustains its SLC cache for longer but then falls to its bottom state. The Gold P31, with its hybrid cache, can maintain its middle performance state for as long as it needs. The FX900 is between these two, proving it is flexible but also demonstrating that Micron’s 176-layer flash is faster than SK hynix’s 128-layer TLC.
We feel it’s safe to say that this drive offers a good middle-ground approach to sustained writes, which may be a factor when the drive is fuller - a state that tends to be dangerous for older DRAM-less drives. However, for most users, the SN770 is effectively equivalent as you usually go for bursty writes that stay within SLC.
The big-picture view is that proper DRAM-less drives can offer a really good experience even in steady state.
Power Consumption and Temperature
We use the Quarch HD Programmable Power Module to gain a deeper understanding of power characteristics. Idle power consumption is important, especially if you're looking for a laptop upgrade, as even the best ultrabooks can have mediocre storage.
Some SSDs can consume watts of power at idle while better-suited ones sip just milliwatts. Average workload power consumption and max consumption are two other aspects of power consumption, but performance-per-watt is more important.
We also monitor the drive's temperature via the S.M.A.R.T. data and an I.R. thermometer to see when (or if) thermal throttling kicks in and how it impacts performance. Again, remember that results will vary based on the workload and ambient air temperature.
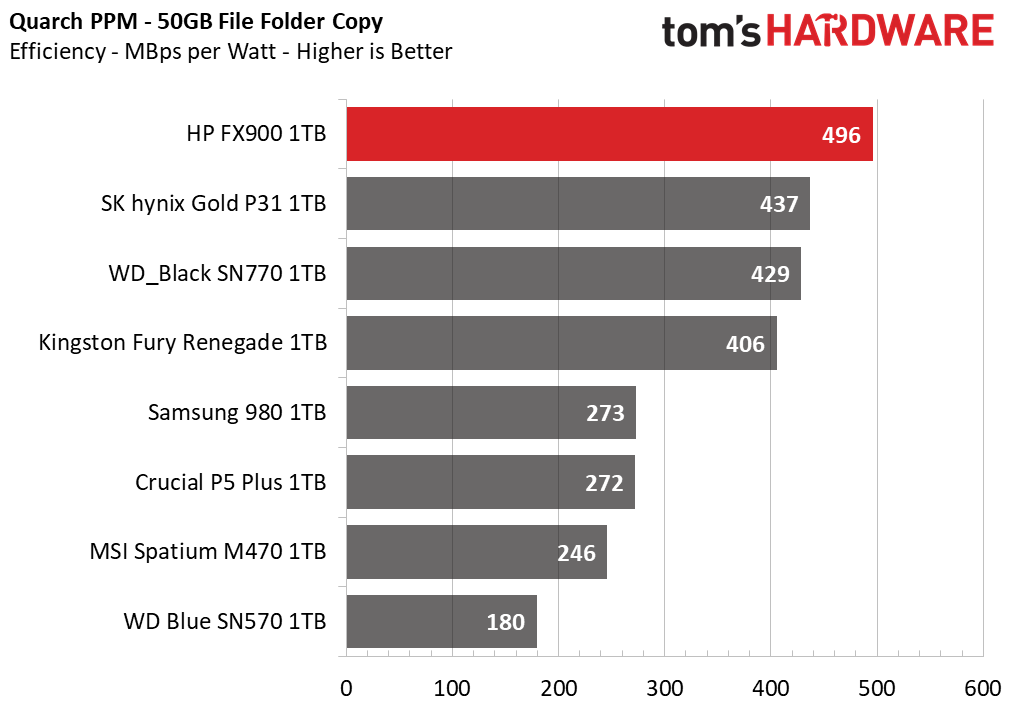
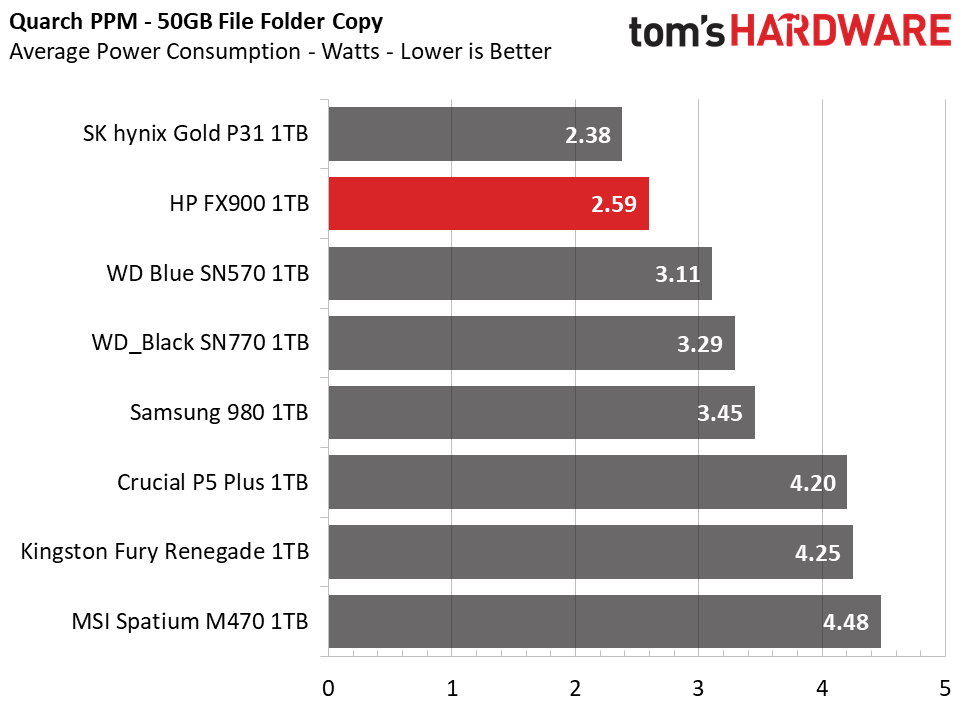
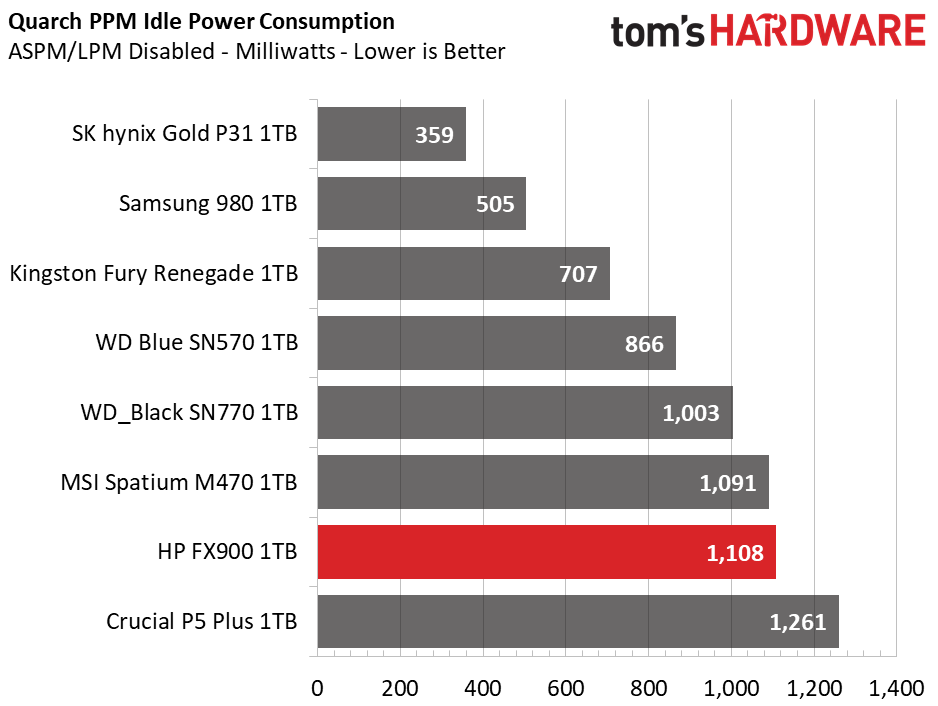
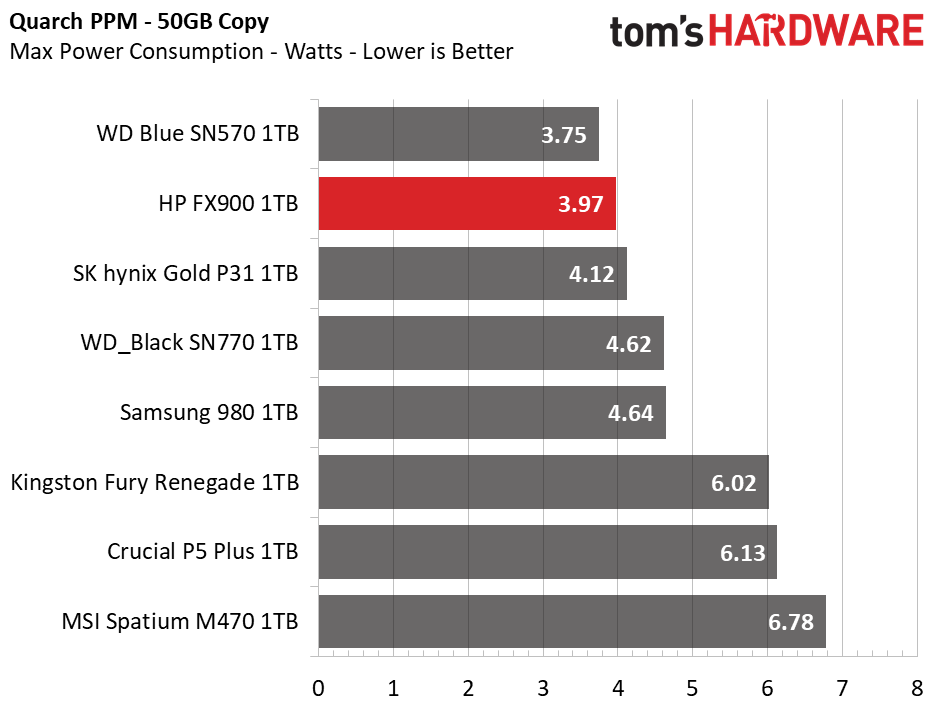
The FX900 is extremely efficient, which isn't surprising — a DRAM-less 4-channel design with this 176-layer flash will be efficient. Idle power draw is perhaps not as good as we'd like - the Gold P31 remains the go-to laptop drive - but overall efficiency is impressive.
The FX900 idled in the mid-40s and peaked in the mid-60s (Celsius). These measured ranges were both by SMART and an IR gun. No throttling was apparent in the test system during sustained write workloads.
Test Bench and Testing Notes
| CPU | Intel Core i9-11900K |
| Motherboard | ASRock Z590 Taichi |
| Memory | 2x8GB Kingston HyperX Predator DDR4 5333 |
| Graphics | Intel UHD Graphics 750 |
| CPU Cooling | Alphacool Eissturm Hurricane Copper 45 3x140mm |
| Case | Streacom BC1 Open Benchtable |
| Power Supply | Corsair SF750 Platinum |
| OS Storage | WD Black SN850 2TB |
| Operating System | Windows 10 Pro 64-bit 20H2 |
We use a Rocket Lake platform with most background applications such as indexing, windows updates, and anti-virus disabled in the OS to reduce run-to-run variability. Each SSD is prefilled to 50% capacity and tested as a secondary device. Unless noted, we use active cooling for all SSDs.
Conclusion
HP has offered some good SSDs over the years in the EX920 and EX950, and it’s nice to see the company isn’t afraid to stay in the game because, frankly, the FX900 is good for the industry. It shows that pairing a good controller and good flash can offer excellent everyday performance. In addition, the 4-channel, DRAM-less design is not a limiting factor as it was in the past, and we’re excited to see what the company can do with the FX900 Pro, too.
SSD controller maker InnoGrit entered a competitive market, facing the established Silicon Motion and Phison SSD controller juggernauts. However, we should consider that SMI’s SM2260 isn't too old and needed refinement in the SM2262 and SM2262EN. Furthermore, some of Phison’s earlier controllers, including the DRAM-less E8T, were disappointing compared to Samsung’s and WD’s proprietary solutions. This is all to say that the IG5220 and IG5236 have been welcome additions, and we hope to see even better things in the future with further optimization.
Micron’s 176-layer flash has proven to be capable outside of the Phison E18 controller, but there is competition in the works. SK hynix’s Platinum P41 uses the company's own 176-layer TLC, and Samsung is ramping up 176-layer production with its next-generation flash. Meanwhile, Kioxia promises record-setting speeds from its BiCS6 and BiCS7. Everybody is also bringing out new 176-layer QLC.
To put it succinctly: the FX900 demonstrates what good flash and controller design can do, offering improvements that are often dismissed due to too much focus on NAND’s inherent shortcomings. That’s without discussing DirectStorage — a proper storage API will enable Windows to better take advantage of SSDs.
For everyday use, this drive is not earth-shatteringly faster than your four-year-old EX920, but it enables someone with the appropriate platform to slot in an affordable, super-fast drive without studying fifty reviews. The human element is that this drive feels good to use, especially because it’s so efficient.
The FX900 will not change the world, and WD’s SN770 already surprised us in this segment. But maybe that’s the point: having more viable options is a good thing. You will be well-served by either the SN770 or the FX900. PCIe 5.0 drives are coming quickly, and DirectStorage may finally help harness insanely-fast SSDs, but the FX900 lets you enjoy everything today without challenging your wallet. It’s not the fastest drive out there, but it’s fast enough.
MORE: Best SSDs
MORE: How We Test HDDs And SSDs
MORE: All SSD Content

Shane Downing is a Freelance Reviewer for Tom’s Hardware US, covering consumer storage hardware.
-
helper800 Reply
I got a 2tb one in my current PC and it only cost me 170 USD. It is, and was a great drive.tennis2 said:Ah the good ol' days of the HP EX950. -
deesider Slight differences in performance just don't matter any more - they all basically work the same. It's just a matter of availability and priceReply
