Kingston HyperX Fury RGB SSD Review: RGB Comes To Entry-Level SSDs
Why you can trust Tom's Hardware
Performance Results
Comparison Products
We put the HyperX Fury RGB head to head against a few popular options. The WD Blue also comes with BiCS3 flash and a Marvell 88SS1074 controller, so it's the Fury RGB's closest competitor. We included the Crucial MX500 and Intel 545s, which are two mainstream SSDs featuring Silicon Motion controllers and the latest 64-layer 3D TLC flash from IMFT. We chose two final competitors to better gauge the Fury RGB’s performance value: the Samsung 860 EVO, one of the best SSDs we have tested, and the Gigabyte UD Pro, which is one of the least impressive.
Trace Testing – PCMark 8 Storage Test 2.0
PCMark 8 is a trace-based benchmark that uses Microsoft Office, Adobe Creative Suite, World of Warcraft, and Battlefield 3 to measure the performance of storage devices in real-world scenarios.
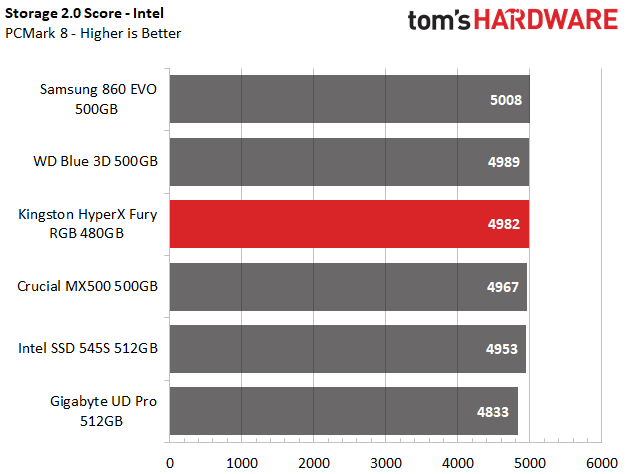
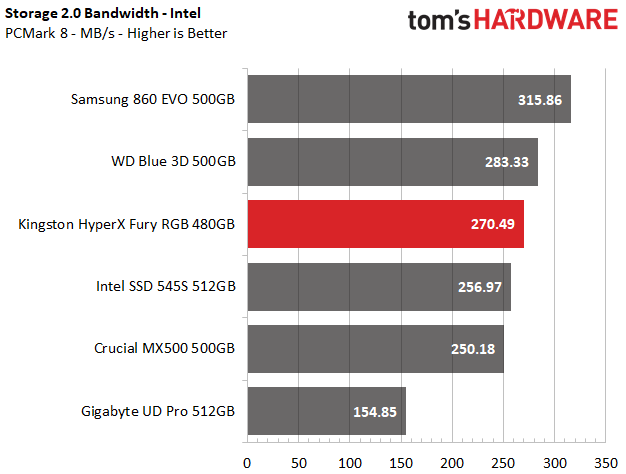
HyperX’s Fury RGB scored a total of 4982 points in PCMark 8’s storage benchmark, ranking third overall. It averaged 270 MB/s of bandwidth during the test, which is very close to the WD Blue 3D SSD and ahead of the Intel, Crucial, and Gigabyte SSDs. The Marvell SATA controller was a bit more agile in this test than the SMI and Phison-powered competitors.
Game Scene Loading - Final Fantasy XIV
The Final Fantasy XIV StormBlood benchmark is a free real-world game benchmark that easily and accurately compares game load times without the inaccuracy of using a stopwatch.
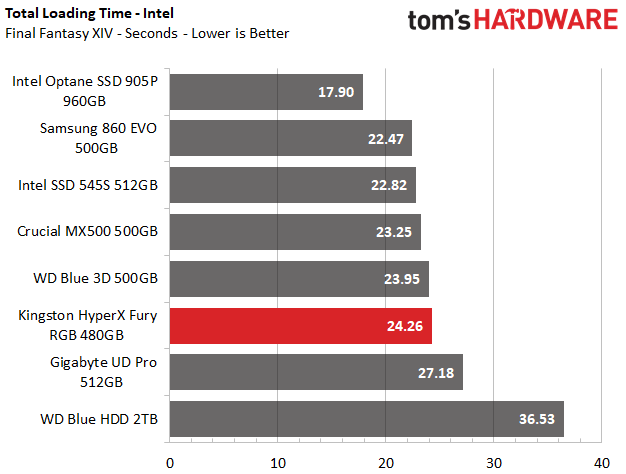
Unlike the PCMark 8 results, the Fury's game loading scores lagged the competition. The HyperX Fury RGB loaded the game scenes in a total of 24.26 seconds, but the other SSDs were faster. The Fury did, however, load up the game scenes much faster than the Gigabyte UD Pro and WD Blue HDD.
Transfer Rates – DiskBench
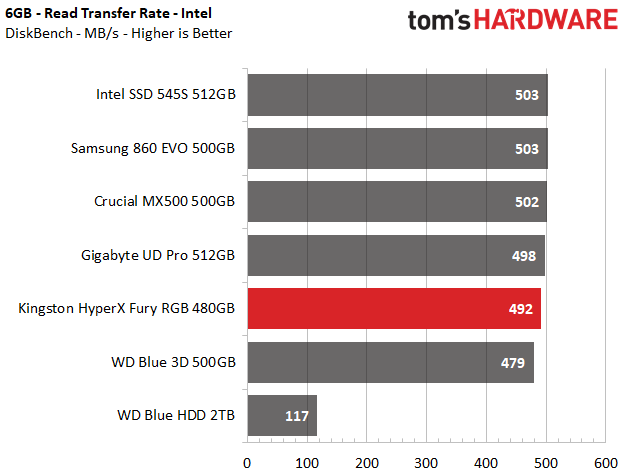
We use the DiskBench storage benchmarking tool to test file transfer performance with our own custom 50GB block of data. Our data set includes 31,227 files of various types, like pictures, PDFs, and videos. We copy the files to a new folder and then follow up with a read test of a newly-written 6 GB file.
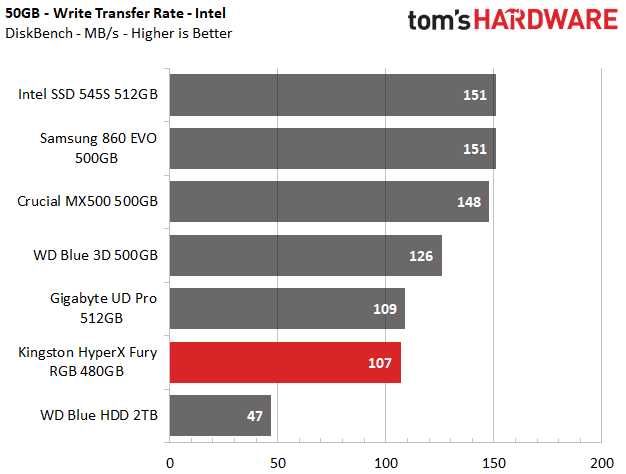
Things went downhill little by little as we tested the HyperX Fury RGB further. During our 50GB file copy test, the Fury RGB lagged all other SSDs with an average bandwidth of 107 MB/s. Even the UD Pro, the slowest SSD we've tested yet, performed better. The Fury was lackluster compared to other SSDs, but it still managed to copy the folder more than twice as fast as the WD Blue HDD.
Get Tom's Hardware's best news and in-depth reviews, straight to your inbox.
The HyperX Fury finally outperformed the WD Blue 3D SSD during the read test. The Fury's average read speed of 492 MB/s was more than four times faster than the WD HDD.
SYSmark 2014 SE
Like PCMark, SYSmark uses real applications to measure system performance. SYSmark takes things much further, however. It utilizes fourteen different applications to run real workloads with real data sets to measure how overall system performance impacts the user experience. BAPCo's SYSmark 2014 SE installs a full suite of applications for its tests, which includes Microsoft Office, Google Chrome, Corel WinZip, several Adobe software applications, and GIMP. That also makes it a great test to measure the amount of time it takes to install widely-used programs after you install a fresh operating system.
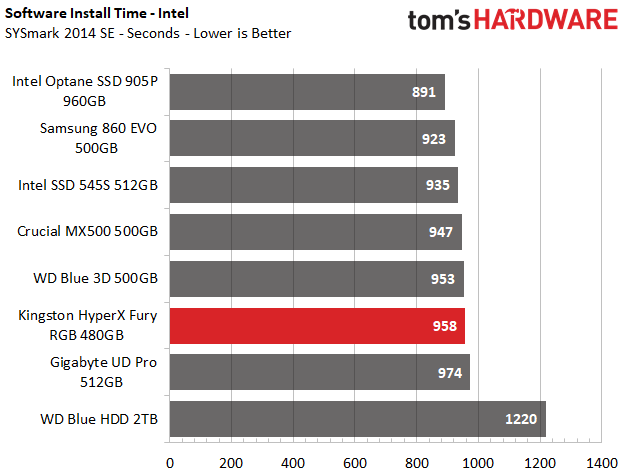
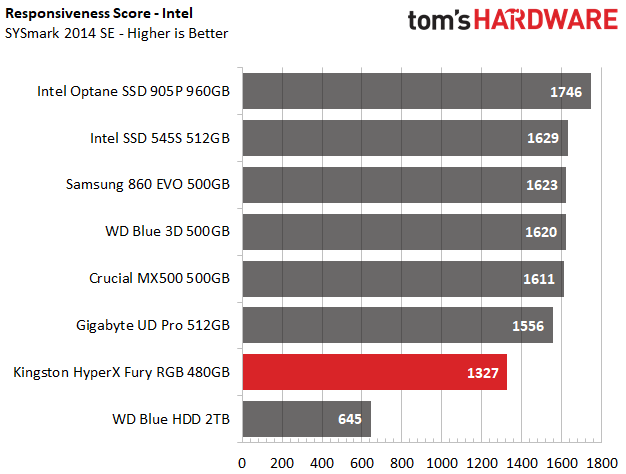
We installed SYSmark 2014 SE to the HyperX Fury RGB in just under 16 minutes. Again, this was faster than the Gigabyte UD Pro but trailed the WD Blue 3D SSD. To our surprise, the Fury RGB scored only 1327 points during the responsiveness test, ranking last among the SSDs by over 200 points. That's a surprising result considering the drive did so well in the PCMark 8 storage test.
ATTO
ATTO is a simple and free application that SSD vendors commonly use to assign sequential performance specifications to their products. It also gives us insight into how the device handles different file sizes.
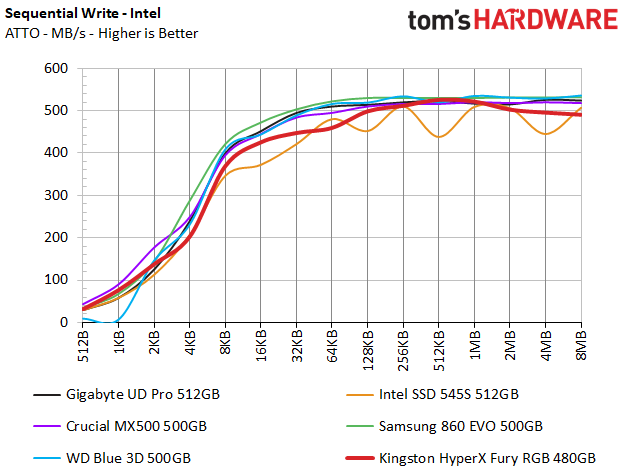
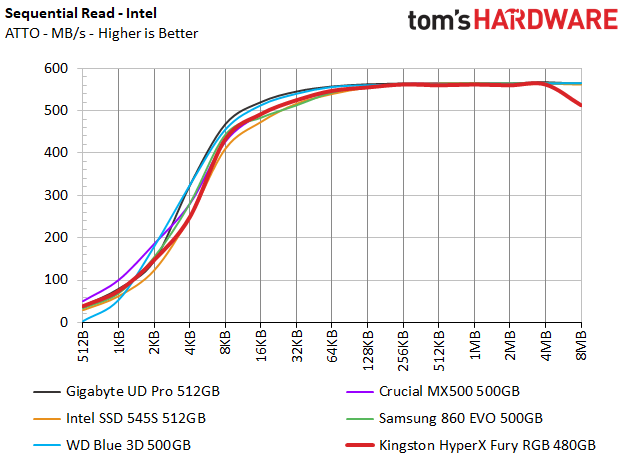
The HyperX Fury RGB showed strong performance as the file size scaled up from 512b to 2KB, but it fell behind most of the other SSDs at 4KB and beyond.
The HyperX Fury RGB surpassed its rated specifications with 561/525 MB/s of sequential read/write throughput, but it ranked near the bottom of the pool with only a slight lead over the last-place Intel SSD 545s.
Anvil's Storage Utilities
Anvil's Storage Utility is a commonly-referenced benchmark that simplifies the complex IOMETER benchmark and its underlying Dynamo engine with a one-click software wrapper.
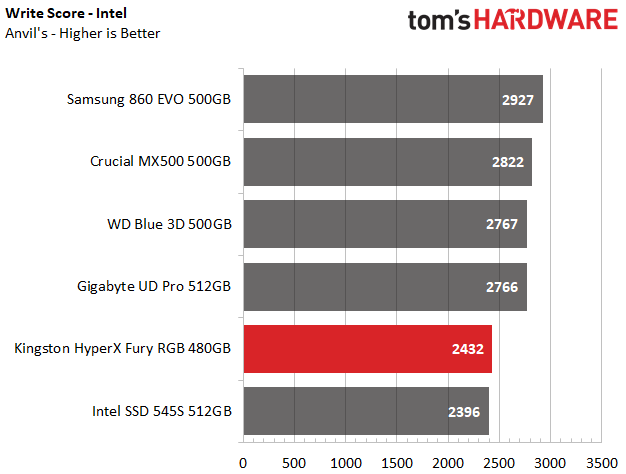
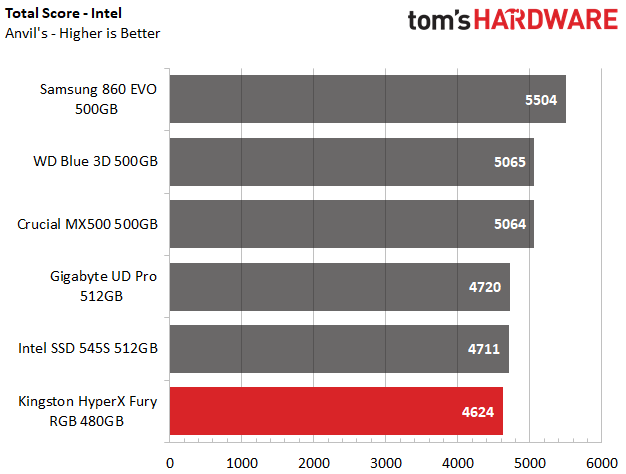
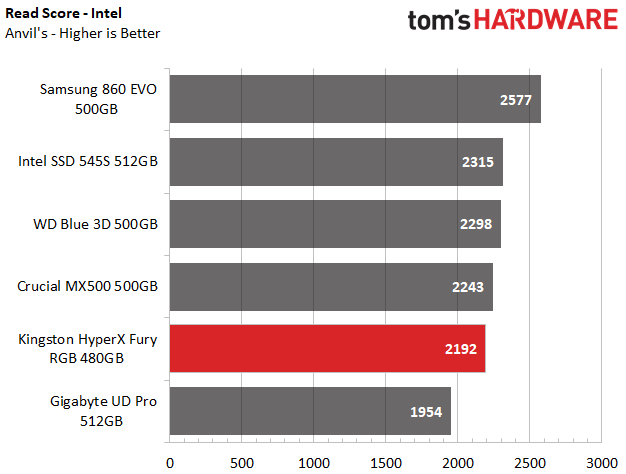
The HyperX Fury RGB delivered competitive read performance compared to the Crucial MX500 and WD Blue 3D. It also outperformed the Gigabyte UD Pro. However, its write performance wasn't inspiring. The Fury didn't land in last place in either of the read or write tests, but it ranked last in the total score.
CrystalDiskMark
CrystalDiskMark (CDM) is a simple and easy to use file size benchmarking tool.
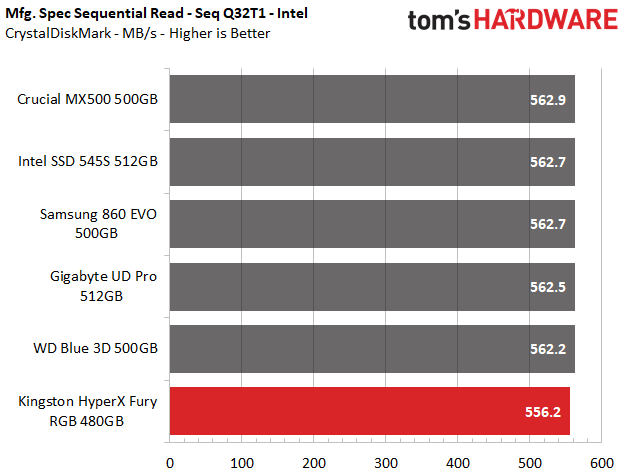
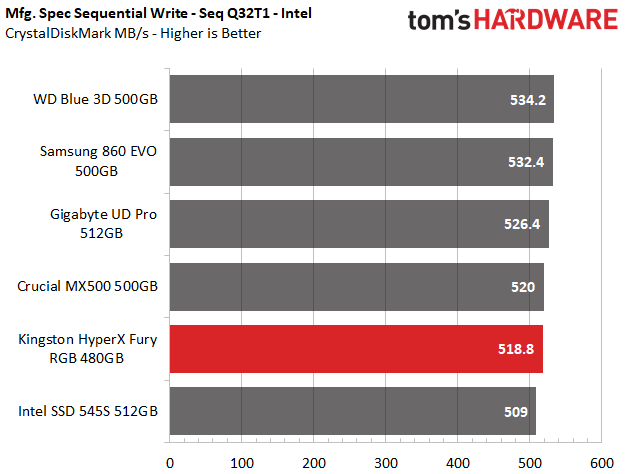
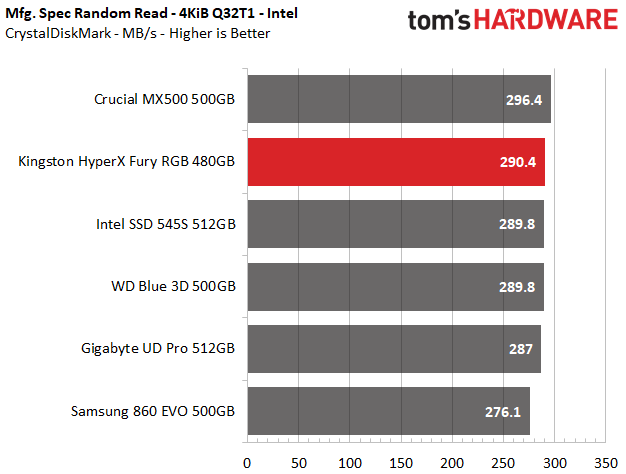
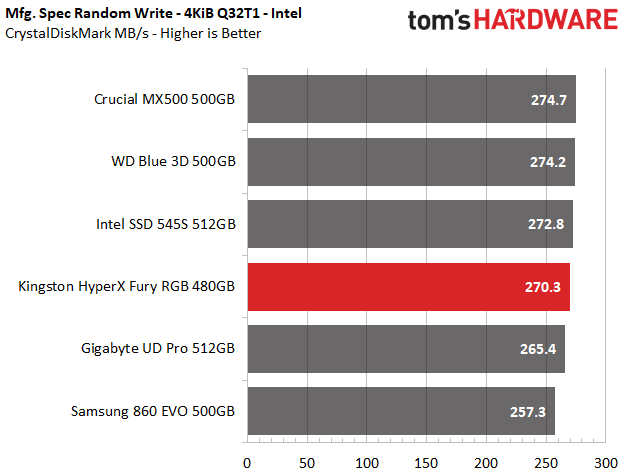
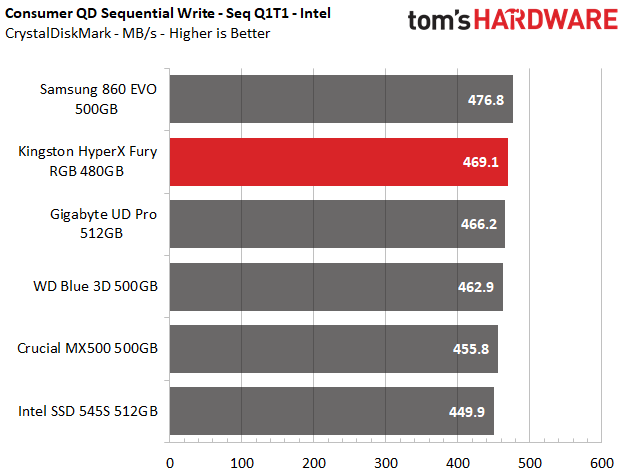
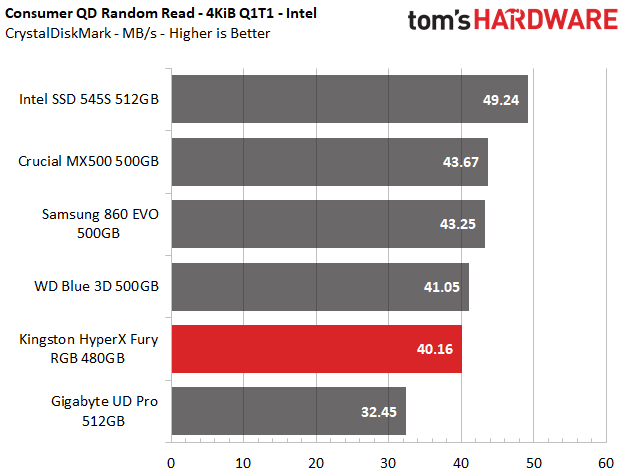
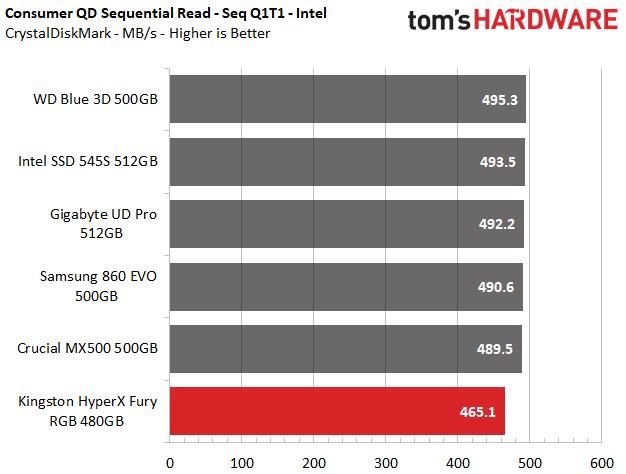
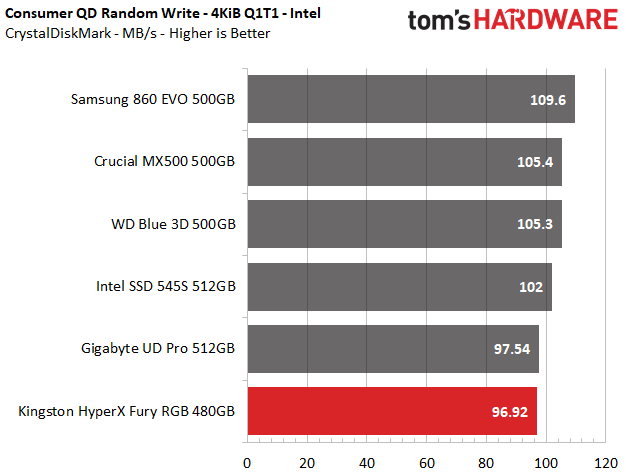
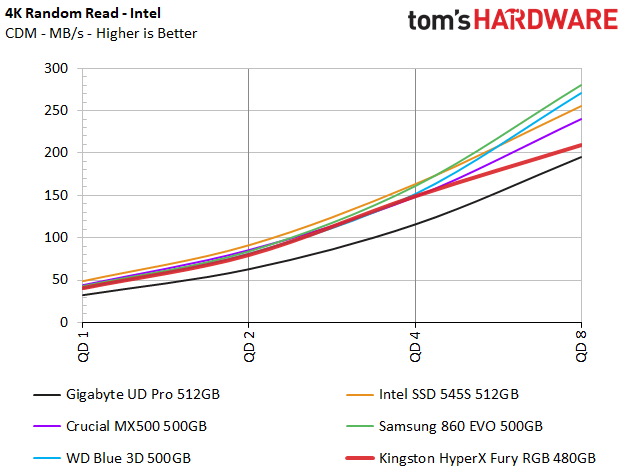
The HyperX Fury RGB attained 556/518 MB/s of read/write throughput at QD (Queue Depth) 32. The write performance wasn't very impressive, but the SSD nearly saturated the maximum real-world speed of the SATA interface during the read workload.
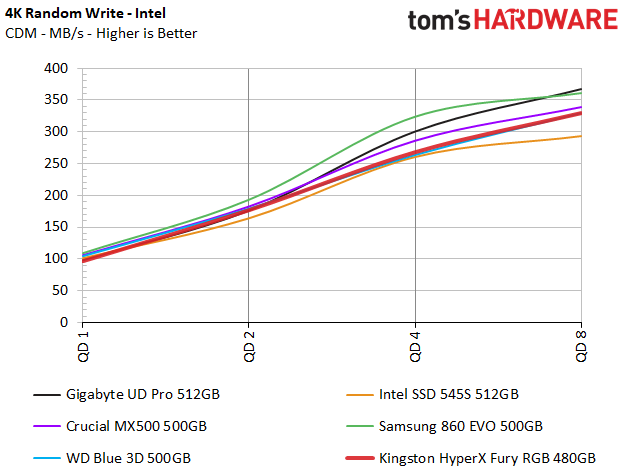
The Fury RGB landed either near or at the bottom of the chart during our random 4K performance tests at QD1. Both the Intel 545s and the Samsung 860 EVO SSDs performed a bit better at the lower QD 1-8 ranges, which is what we look for to weed out which of these SSDs performs the best in real-world use.
Sustained Sequential Write Performance
Official write specifications are only part of the performance picture. Most SSD makers implement an SLC cache buffer, which is a fast area of SLC-programmed flash that absorbs incoming data. Sustained write speeds can suffer tremendously once the workload spills outside of the SLC cache and into the "native" TLC or QLC flash. We hammer the SSDs with sequential writes for 15 minutes to measure both the size of the SLC buffer and performance after the buffer is saturated.
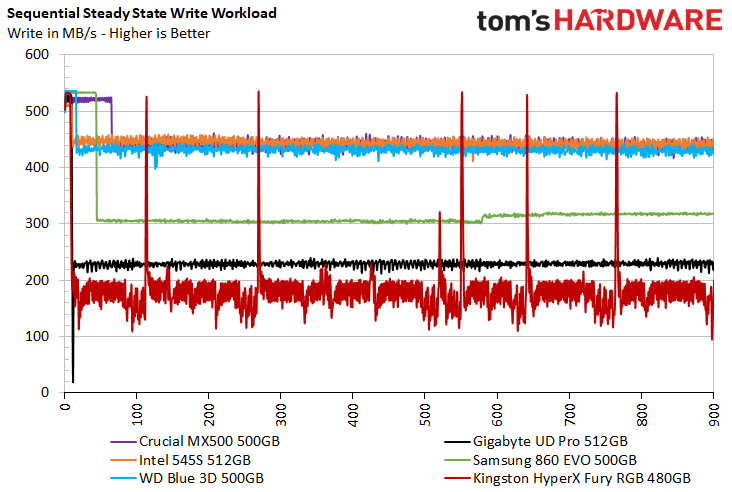
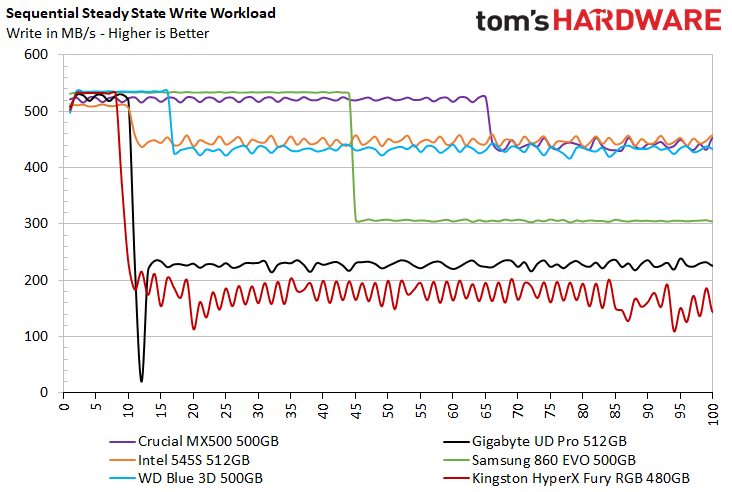
HyperX’s Fury RGB features an SLC write cache that is smaller than 10GB, just like the Intel 545s and the Gigabyte UD Pro. After we filled the buffer the Fury's performance tanked to an average of 175 MB/s, which was lower than the Gigabyte UD Pro. The Fury provided a few sporadic bursts of high performance during the test, but they provided very little benefit. The Fury's performance consistency was also sub-par.
Power Consumption
We use the Quarch XLC Programmable Power Module to gain a deeper understanding of power characteristics. Idle power consumption is a very important aspect to consider, especially if you're looking for a new drive for your laptop. Some SSDs can consume watts of power at idle while better-suited ones sip just milliwatts. Average workload power consumption and max consumption are two other aspects of power consumption, but performance-per-watt is more important. A drive might consume more power during any given workload, but accomplishing a task faster allows the drive to drop into an idle state faster, which ultimately saves power.
HyperX rates the Fury RGB's power consumption at 0.2W at idle, 1.2W (max) under read workloads, and 2.5W (max) during write workloads.
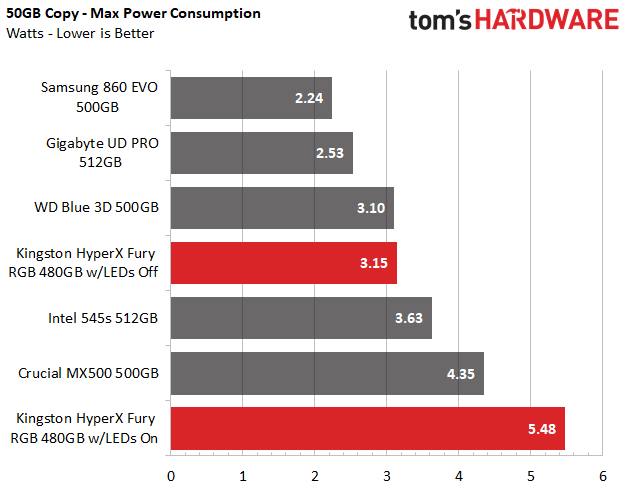
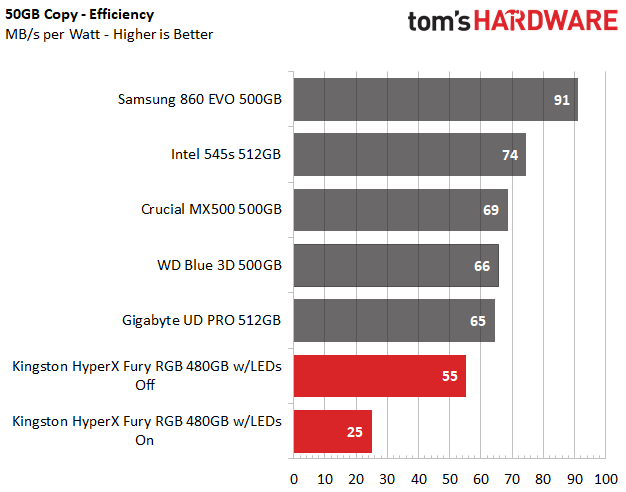
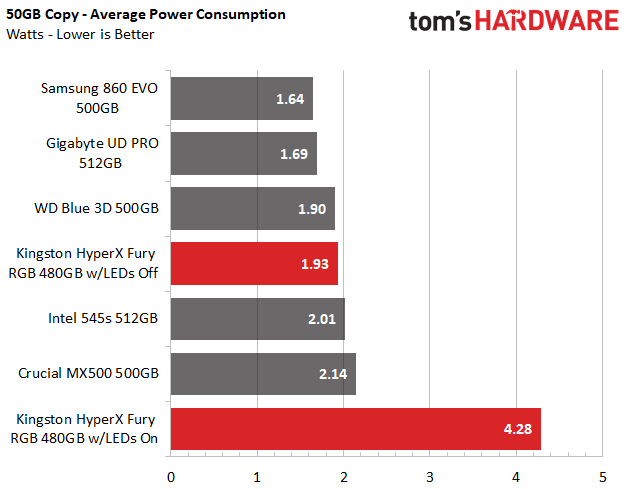
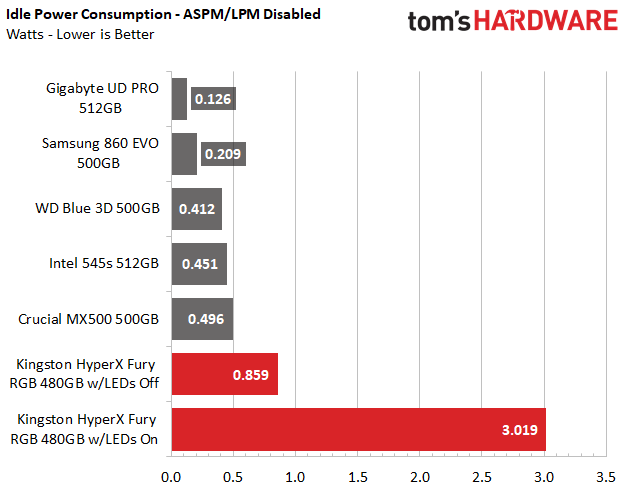
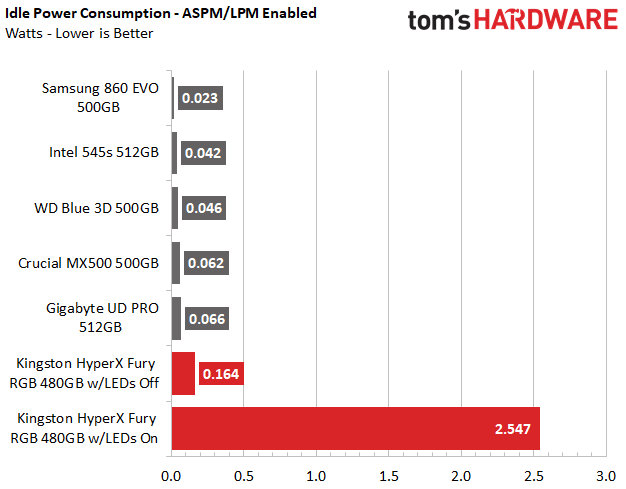
The Fury RGB averaged 4.28W during the 50GB file copy test with the LEDs on. That's more than double the MX500 but comes as a byproduct of the LED lighting implementation. With the LED power factored out, the Fury RGB consumed an average of 1.93W during the 50GB copy. The Fury continued its power-guzzling trend during the maximum power consumption tests. We also factored in performance to generate an efficiency metric. The Fury RGB's 25 MB/s-per-watt with the LEDs on, and 55 MB/s-per-watt with them off, proved to be the least-efficient results we've measured thus far.
| Power Consumption | Idle - LPM Off | Idle - LPM On |
| RGB On | 3W | 2.55W |
| RGB Off | 860mW | 164mW |
With the LEDs on, idle power consumption (listed above) was far higher than the 200mW rating. We removed LED power consumption from our calculations and idle power with LPM enabled was actually better than the 200mW rating, but there is still room for improvement with LPM disabled.
MORE: Best SSDs
MORE: How We Test HDDs And SSDs
MORE: All SSD Content
Current page: Performance Results
Prev Page A Colorful Fury, Or Just a Small Flurry? Next Page Conclusion
Sean is a Contributing Editor at Tom’s Hardware US, covering storage hardware.
-
antonysg77 This RGB bling is just going overboard. I would rather buy a more power-efficient drive or one with a few more additional Gb instead of this fancy drive.Reply -
xxxlun4icexxx While it's interesting. Are people ever going to even see the RGB? Drives are usually on a tray hidden away.Reply -
ATI9800Pro ARE GEE BEEEE ! : https://youtu.be/dnxfOnAU0EY?t=180Reply
Obviously, an all-RGB Kingston/HyperX PC trumps everything ! -
johnrob 'RGB is so dumb, I just HATE options and I think computers should all be beige and have crayon box interior wiring straight from the PSU.Reply
Bring me back blue or green PCBS damnit I miss floppy drives Wahhhhhhhhh.'
Kudos to hyper x, this looks sharp, and every new RGB product helps drive the cost down.
