Plextor S3C SSD Review
Why you can trust Tom's Hardware
256GB Class SSD Performance
Comparison Products
We grabbed a group of similar 256GB-class drives to compare to the new Plextor S3C. We went through a dry spell in this capacity but received a few new products over the last couple of months. The 3D revolution brings larger die sizes in tow, so this capacity is the new entry-level for many product families. By 2018, we will rarely receive 256GB drives for testing as the industry moves to 512GB models for the mainstream.
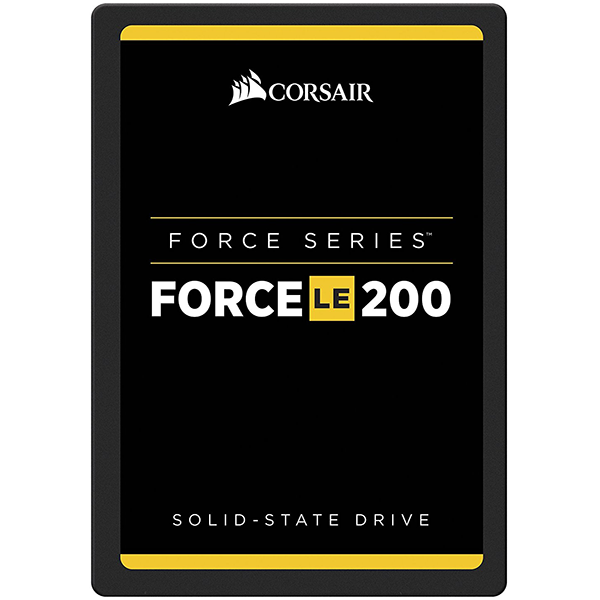
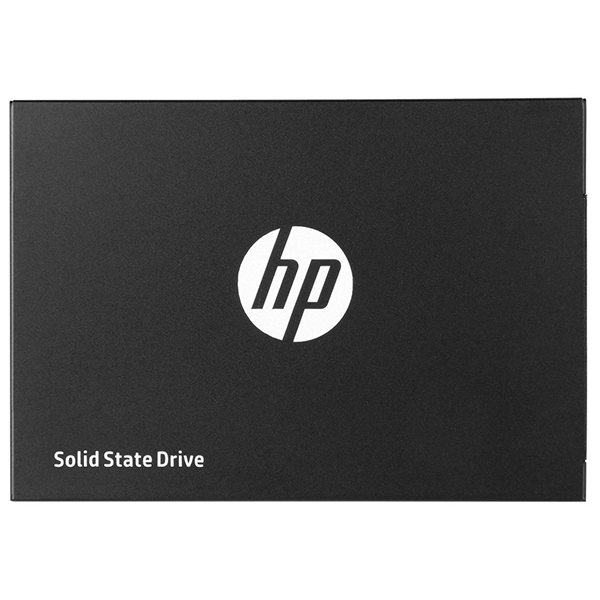
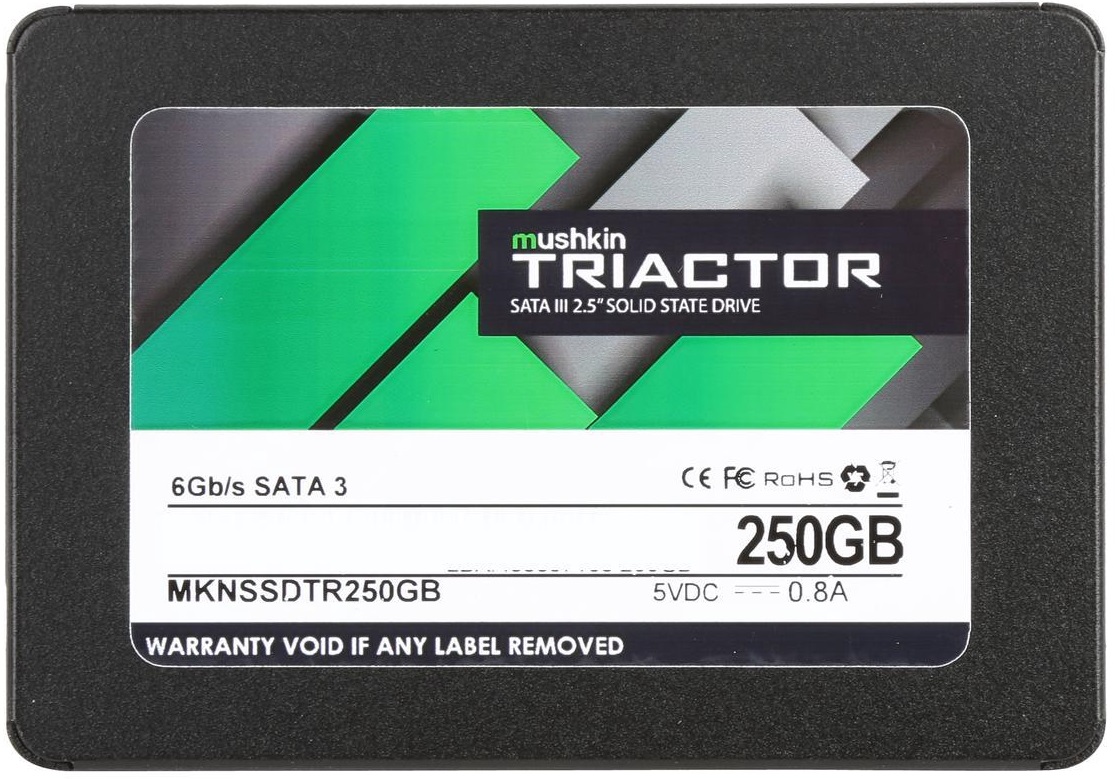
The Corsair Force LE 200 240GB and HP S700 250GB are both DRAMless models. The Force LE 200 uses a Phison S11 controller, and the S700 uses the SMI SM2258XT. The Mushkin Triactor 240GB, Samsung 850 EVO 250GB, and SanDisk Ultra II 240GB use a DRAM buffer. These are established products that have shipped for several months to several years.
Sequential Read Performance
To read about our storage tests in-depth, please check out How We Test HDDs And SSDs. We cover four-corner testing on page six of our How We Test guide.
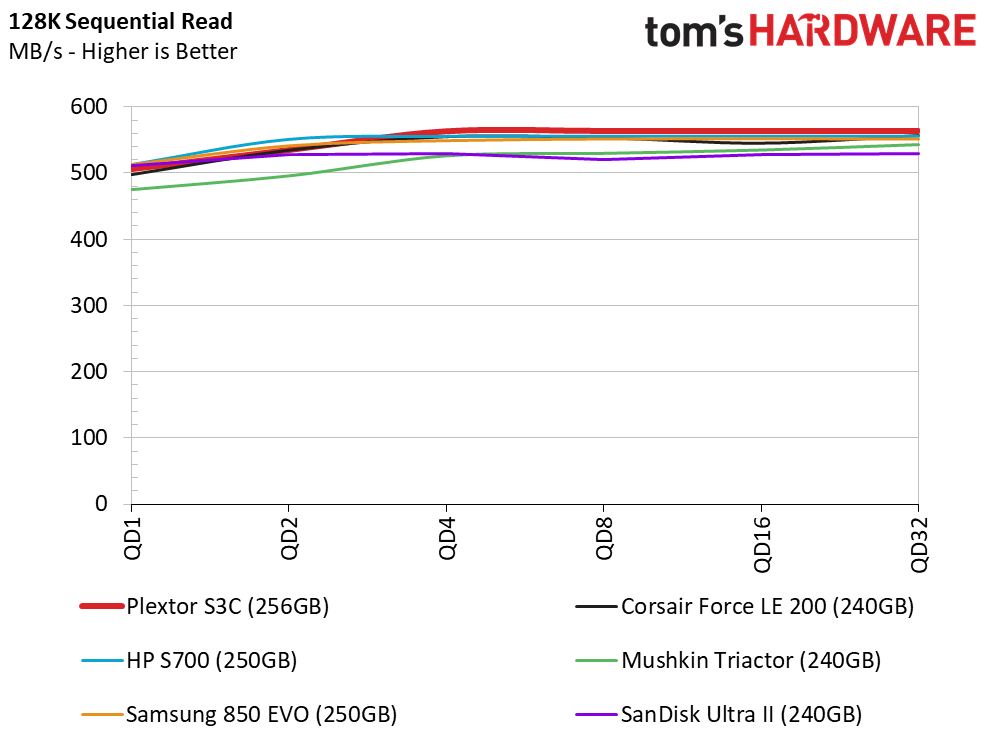
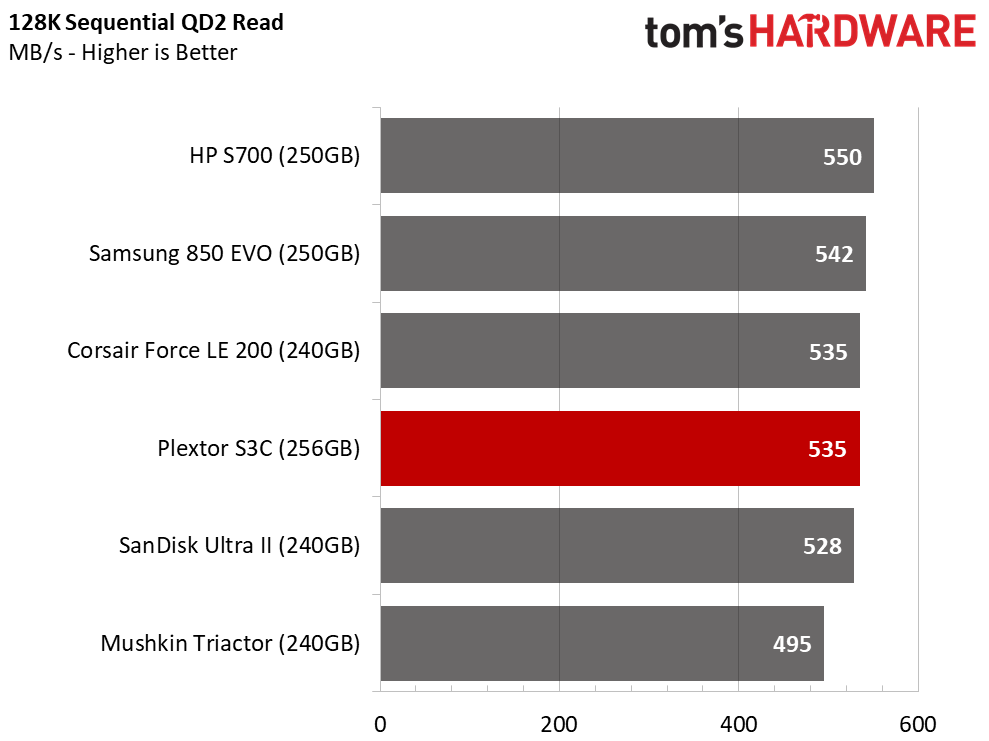
You won't find a significant difference between most modern SSDs when they read sequential data. Our tests show that most of these products deliver 500 MB/s or more at very low queue depths.
Sequential Write Performance
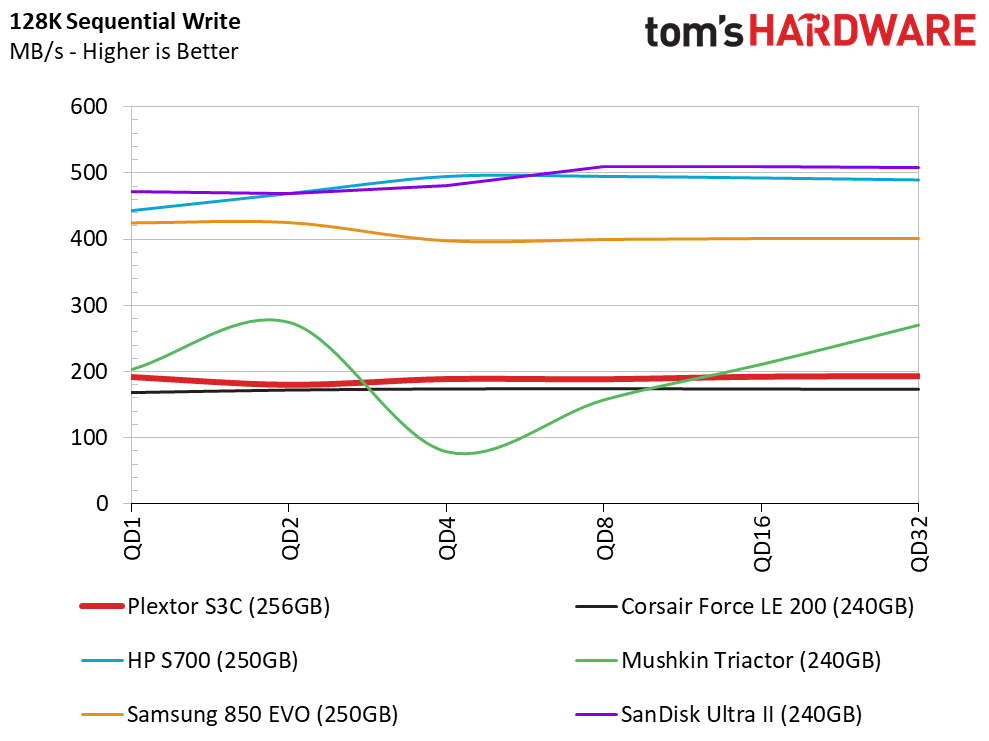
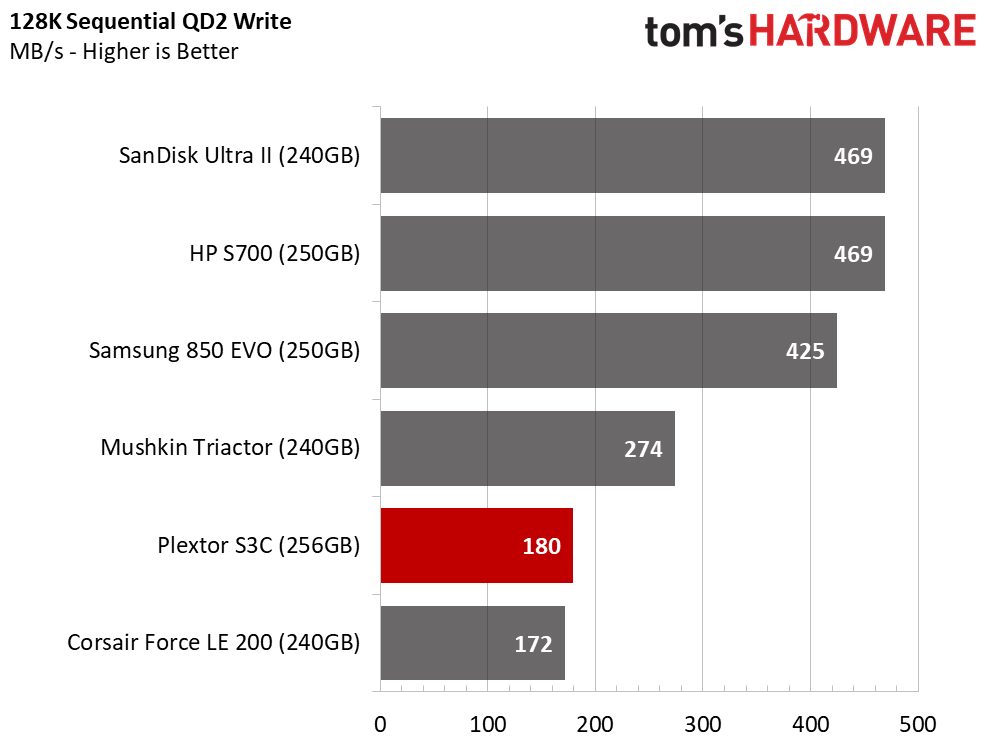
You will see much more variation during the sequential write tests. Companies use different algorithms to write this type of data to TLC flash. The preferred method is to use flash that is fast enough to keep the data rate high, like the 3D NAND in Samsung's 850 EVO. Some SSDs, like SanDisk's Ultra II, use slower flash and a folding technique that stores incoming data on an intermediary SLC buffer. Our favorite is direct-to-die writes. This technique circumvents the SLC buffer when it is full to ensure consistent performance.
Sequential Write Cache Effect
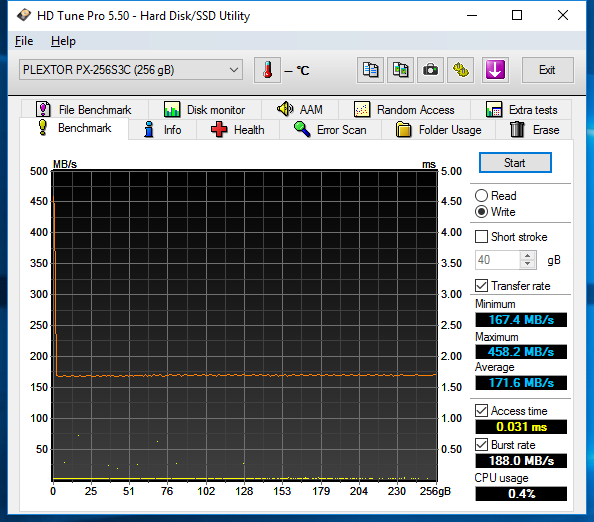
The Plextor S3C 256GB appears to use a form of direct-to-die writes after the SLC buffer fills. The problem is the flash's write speed is very slow compared to many of the other products. The Sk Hynix 14nm TLC in this configuration can write at 170 MB/s using 128KB sequential blocks. The speed is high enough that you will not feel like the drive slows down your network transfers, but it's less than ideal for installing software from a local drive.
Random Read Performance
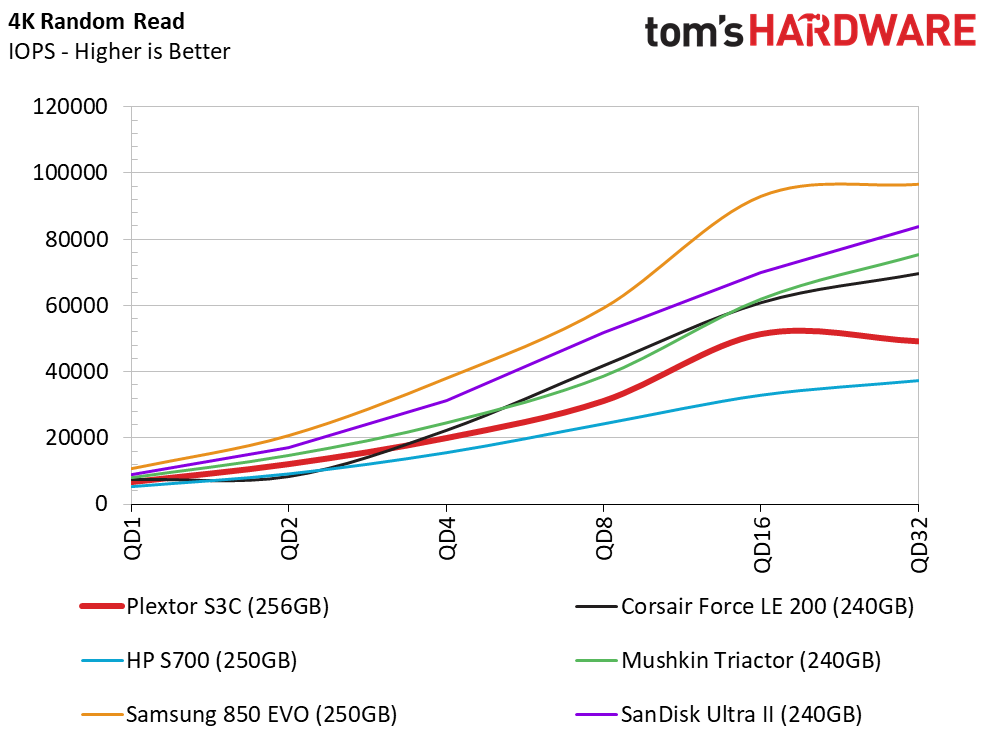
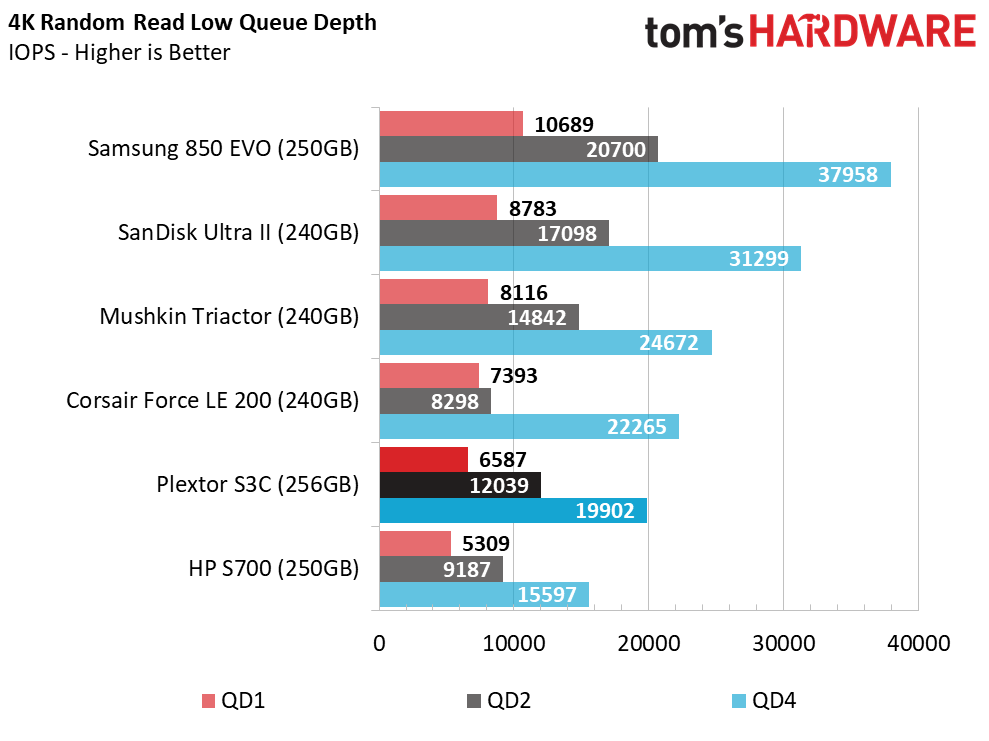
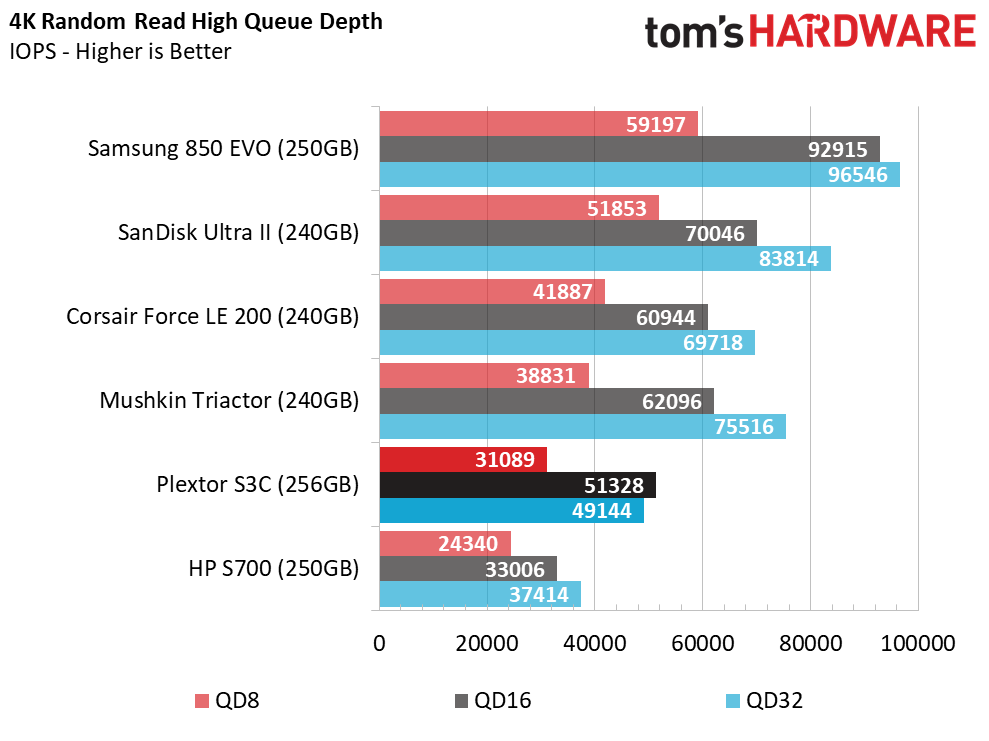
Random read performance at very low queue depths has a direct relation to the overall user experience. At first glance, the performance seems reasonable given the Plextor S3C 256GB's $100 price point. The problem is Samsung's 850 EVO 250GB also retails for roughly $100.
Get Tom's Hardware's best news and in-depth reviews, straight to your inbox.
Random Write Performance
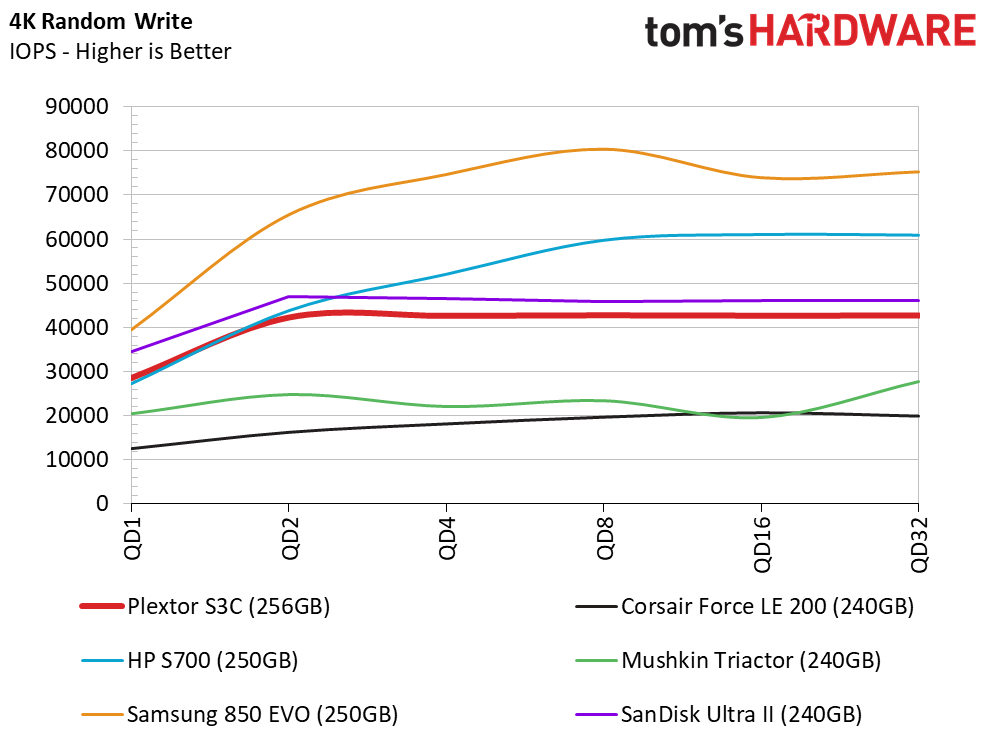
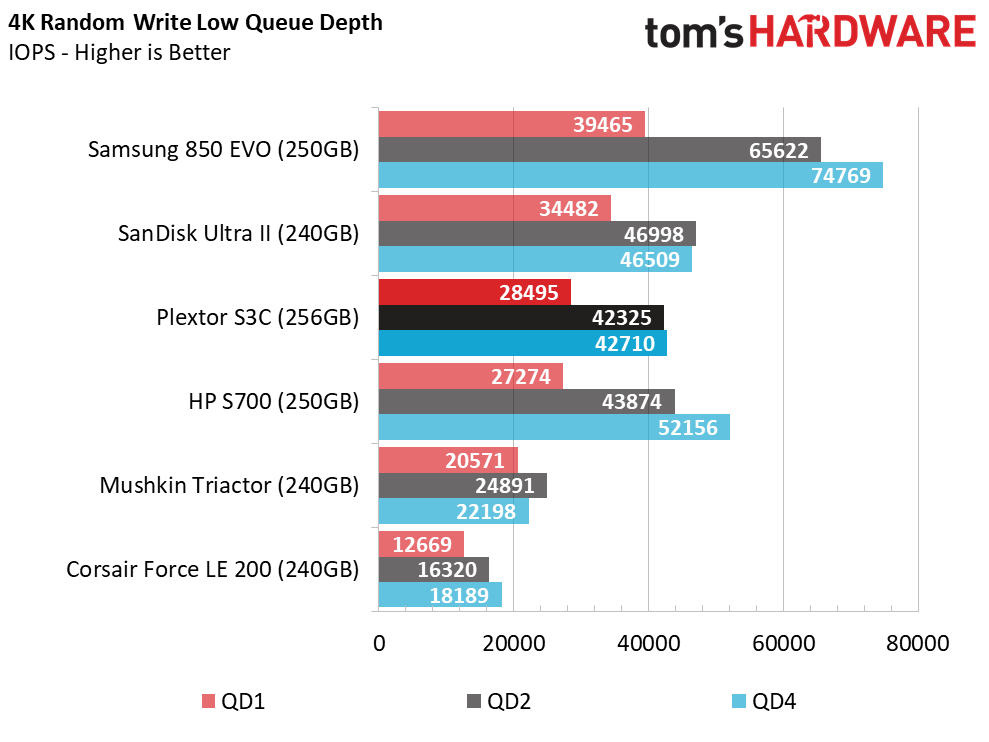
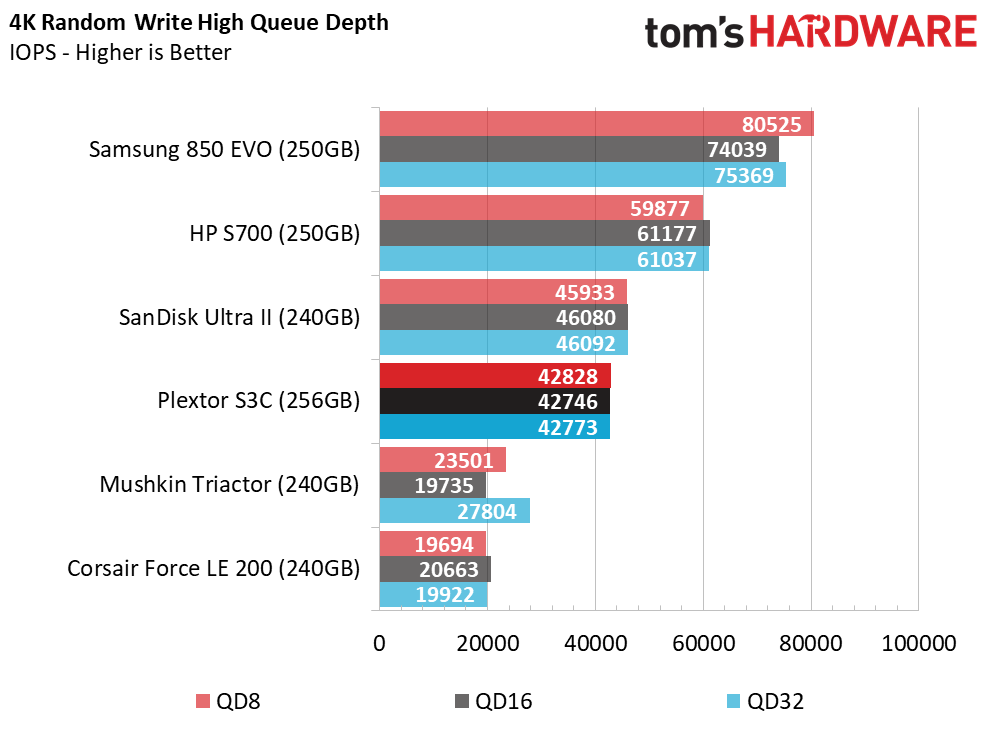
The S3C matches the HP S700 250GB DRAMless SSD in random writes at queue depth (QD) 1 and 2. The HP continues to scale well for a DRAMless drive, but the S3C hits a wall around 40,000 IOPS and refuses to scale further as we increase the workload.
80% Mixed Sequential Workload
We describe our mixed workload testing in detail here and describe our steady state tests here.
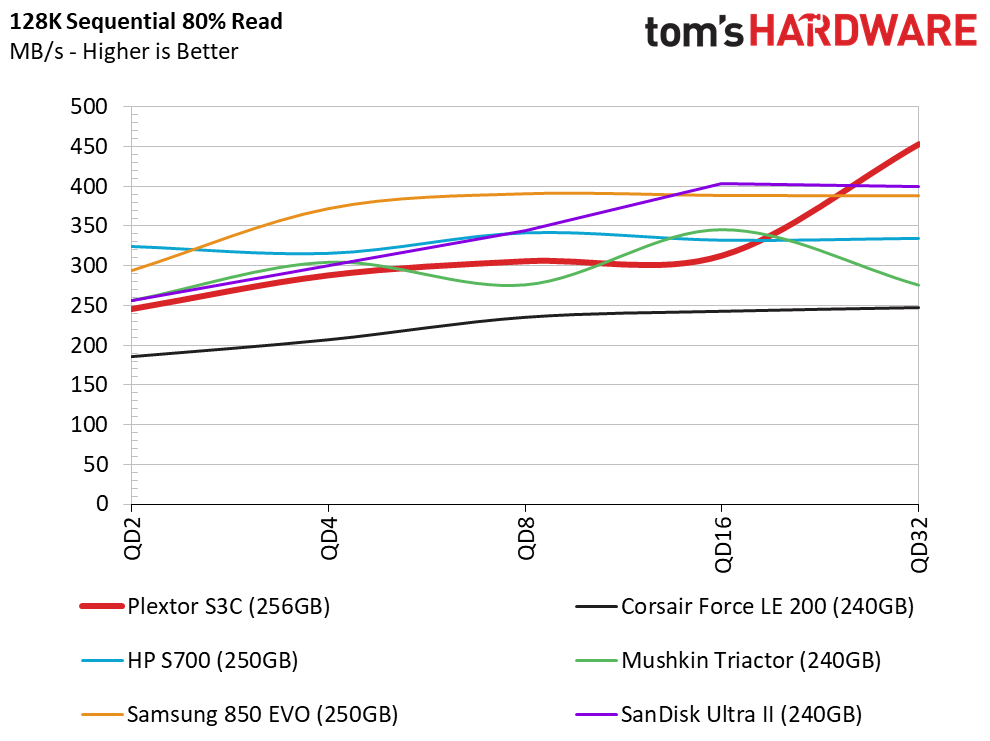
Entry-level and mainstream SSDs often suffer from low mixed workload performance. The charts are full of these products, except the 850 EVO. It has ascended into the upper class even though it sells in the same price range as the other products.
80% Mixed Random Workload
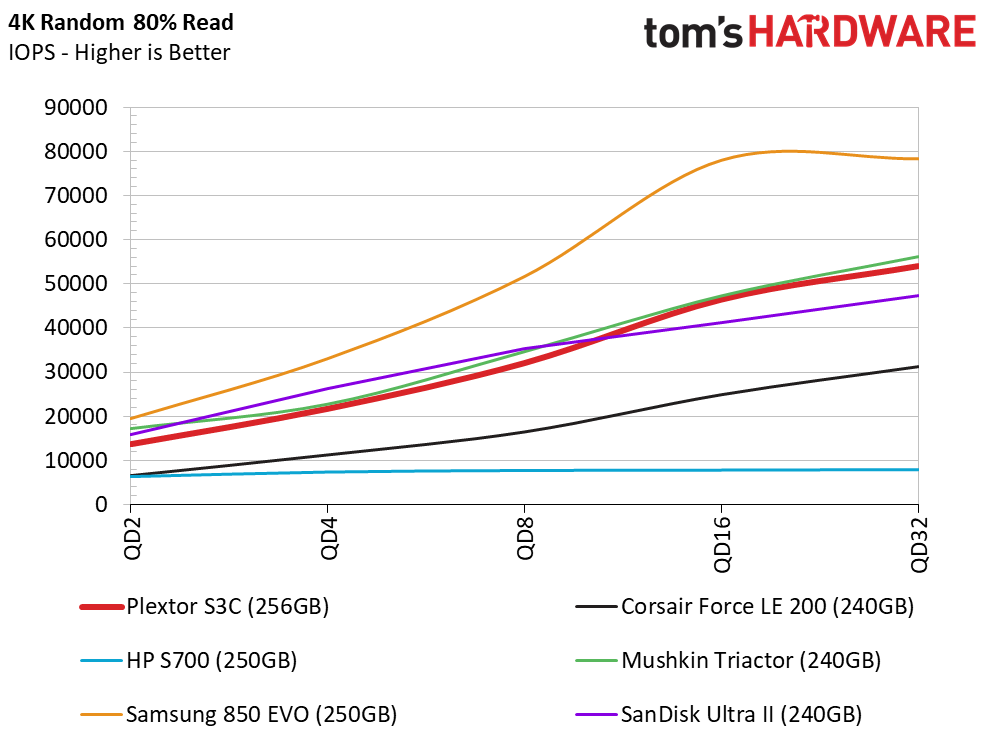
The 80% read mixed random test gives us a better look at the product hierarchy. The two DRAMless SSDs quickly fall to the bottom of the performance charts, while the mainstream drives cluster together in the middle.
Sequential Steady-State
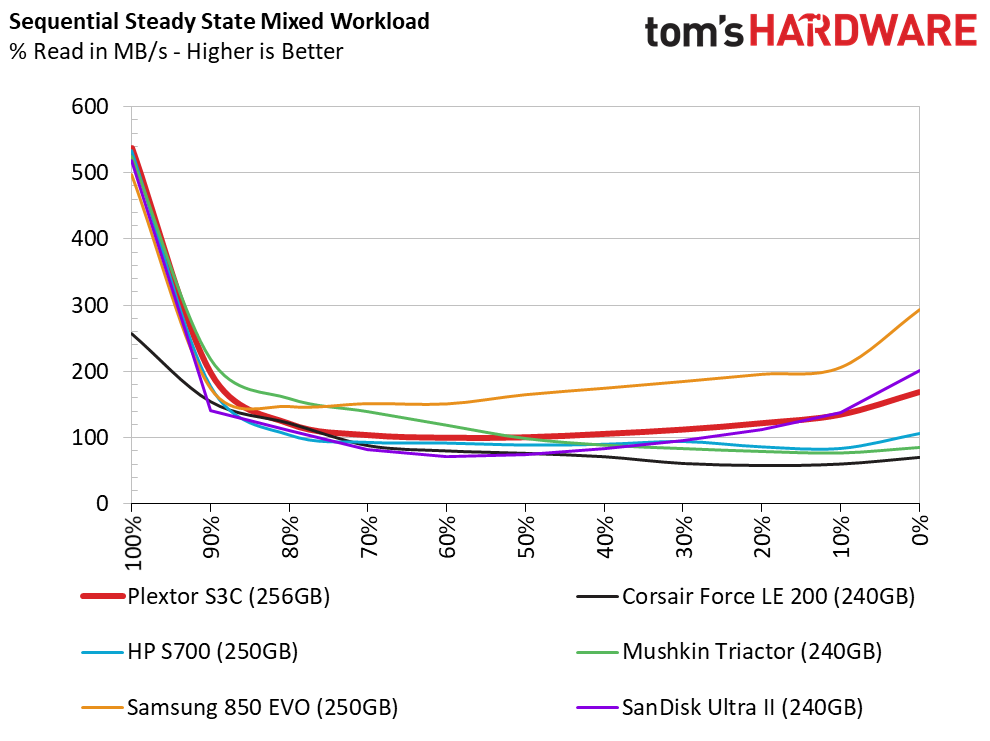
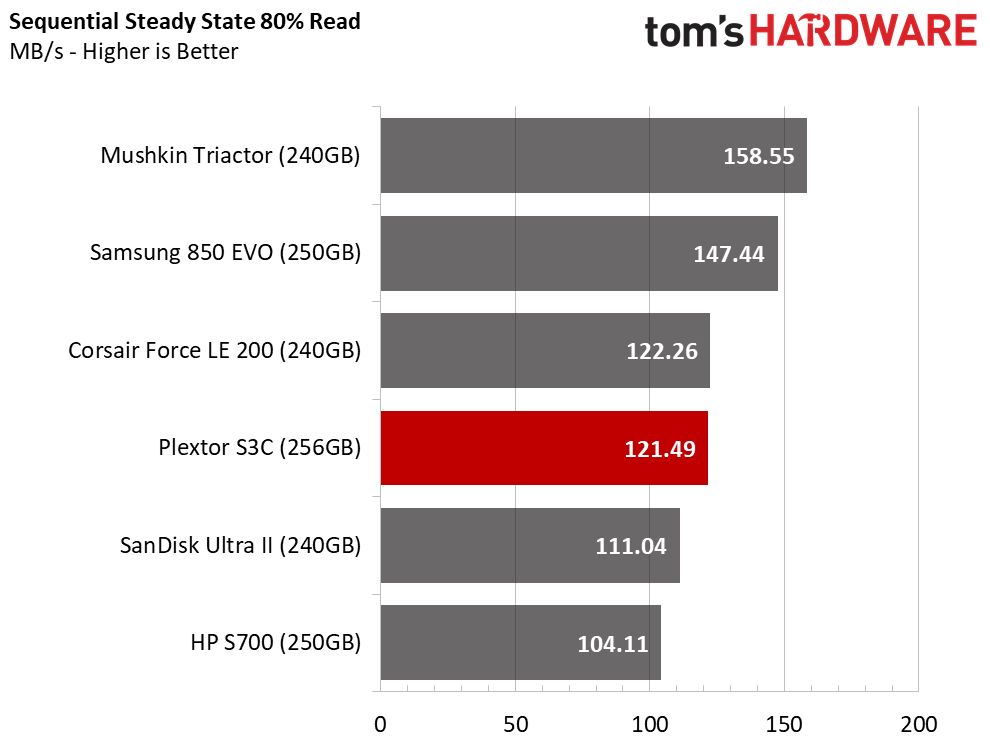
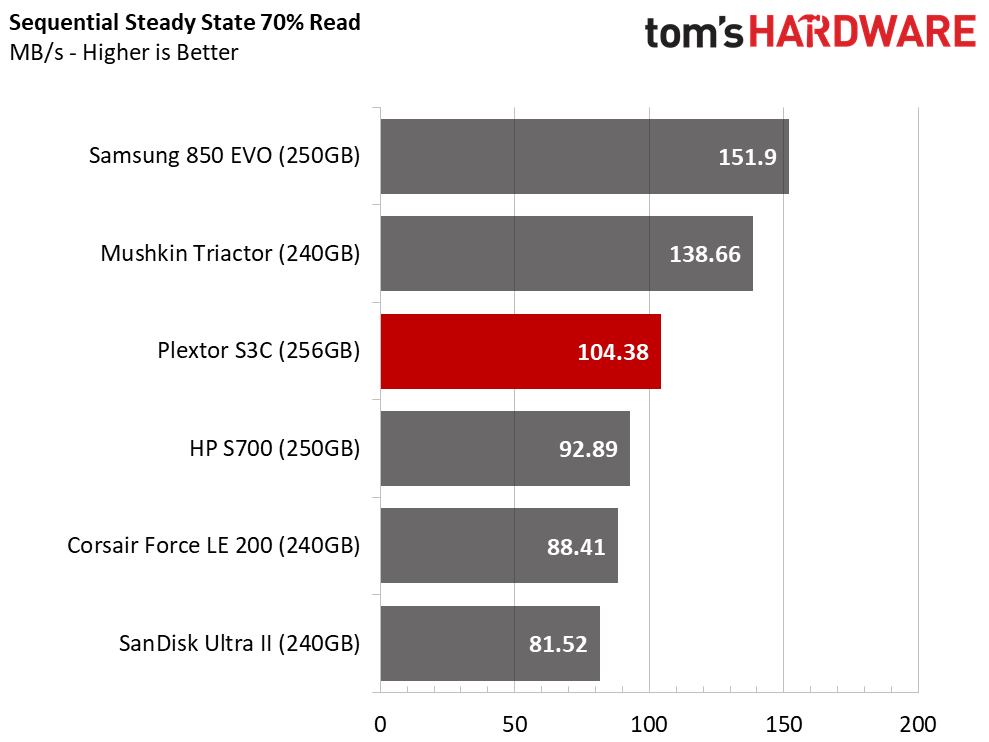
Given the new direction the consumer SSD has taken, we can no longer say that TLC products are not designed for heavy sustained workloads. We are about to turn that corner in the near future, but the Plextor S3C isn't in that room. We did see a slight uptick in the 100% write portion of the test, but the S3C only matches the SanDisk Ultra II 240GB.
Random Steady-State
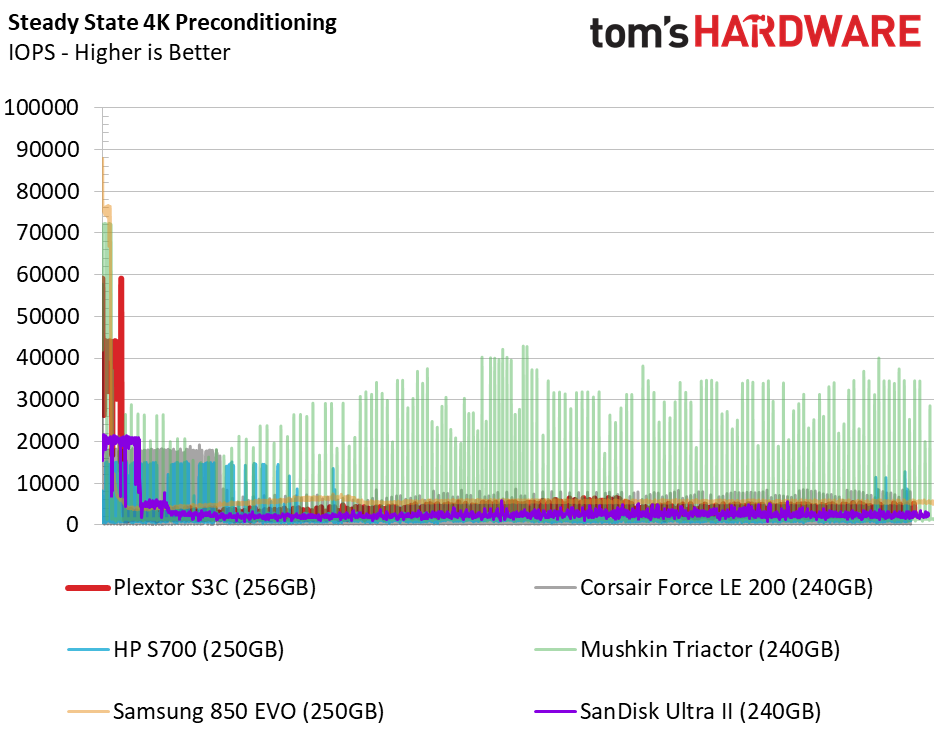
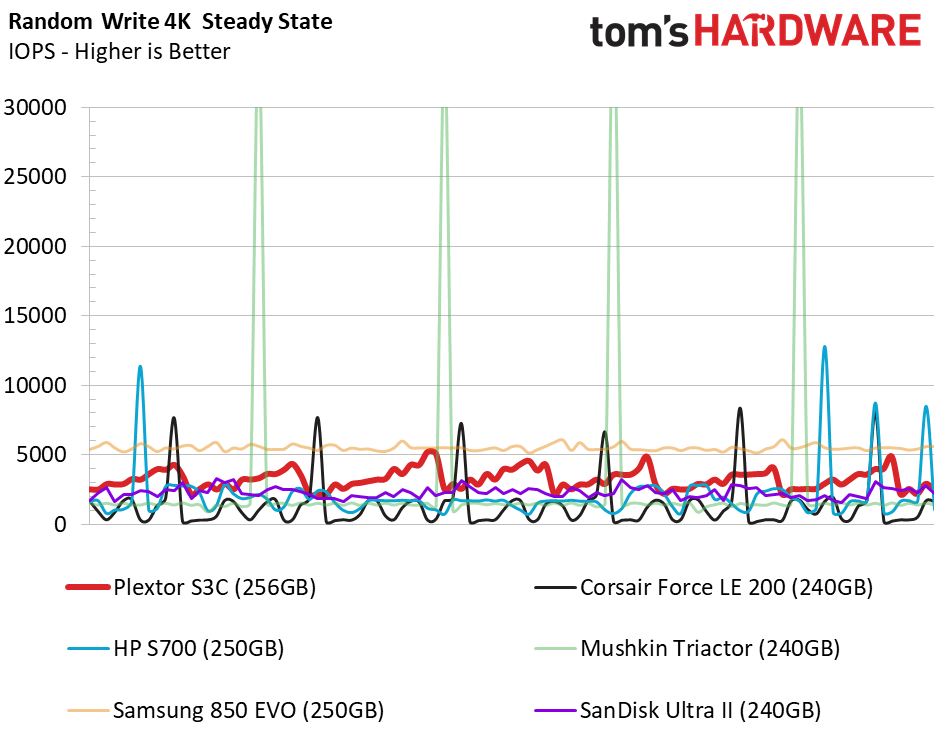
The random write steady-state test shows us performance as the cache fills and flushes. The result is inconsistent performance, but unlike the HP S700, it does allow the S3C to stay off the performance floor.
PCMark 8 Real-World Software Performance
For details on our real-world software performance testing, please click here.
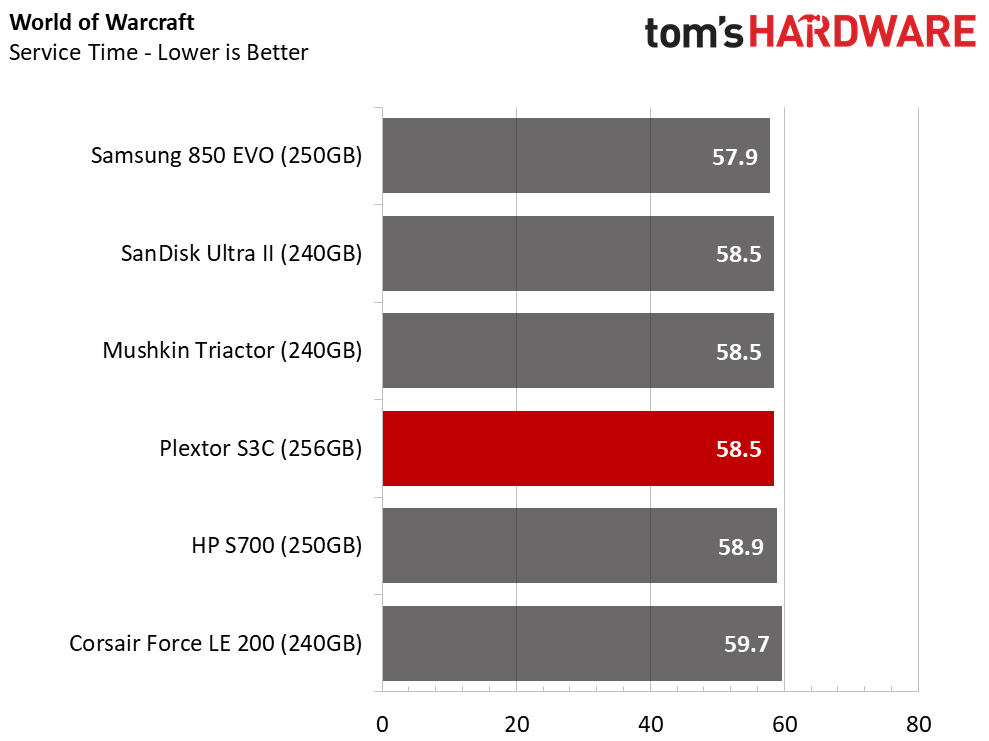
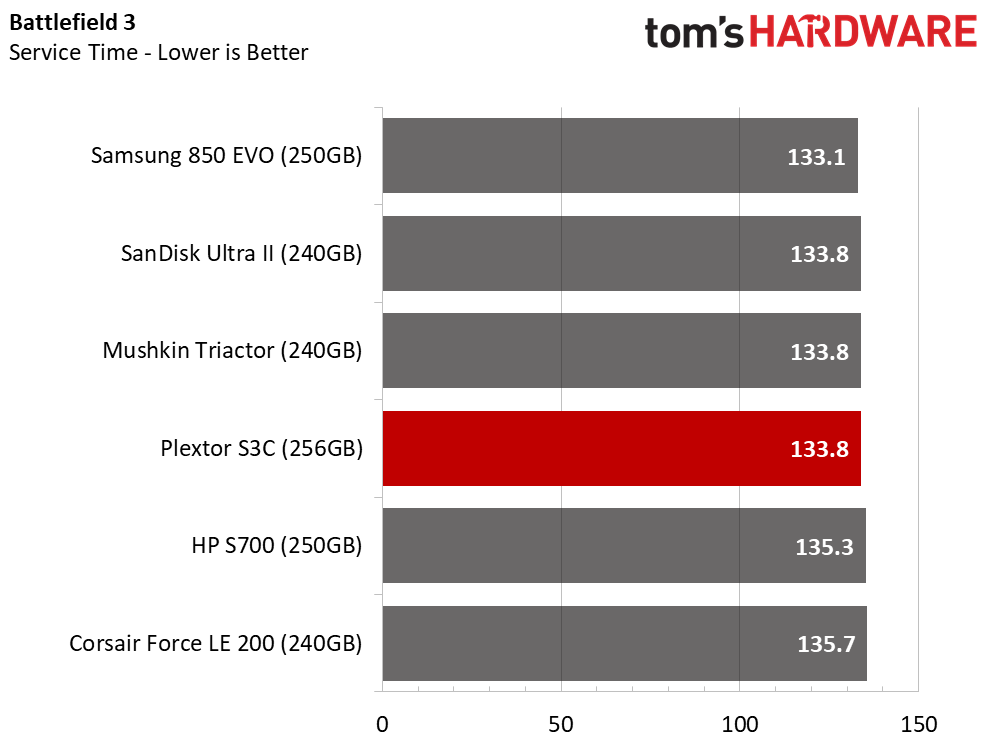
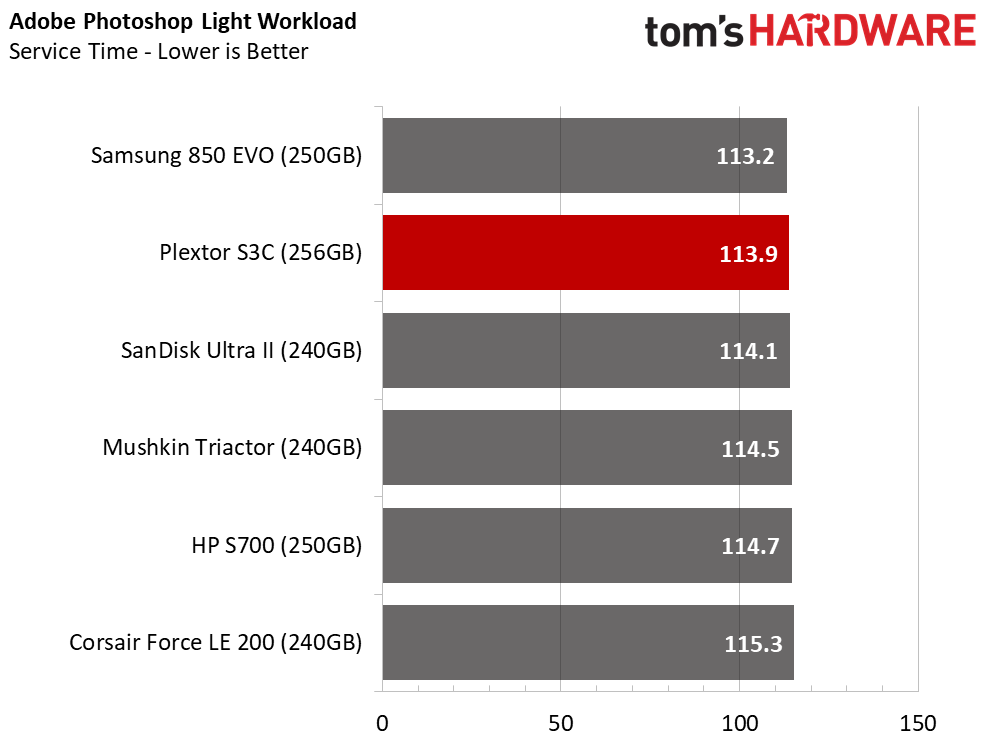
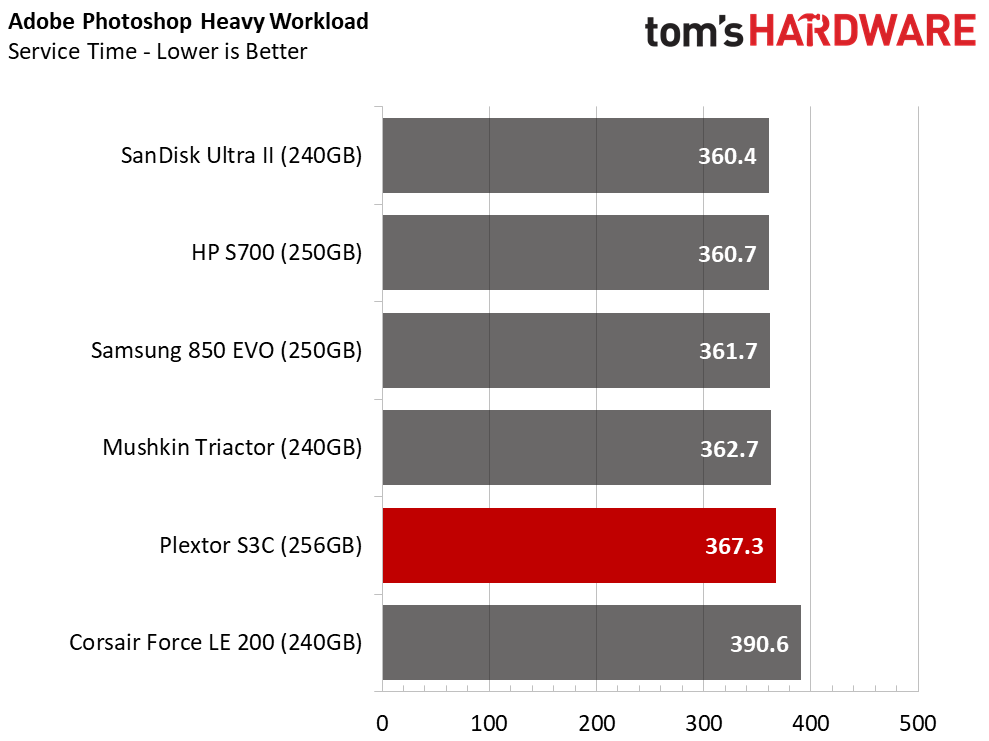
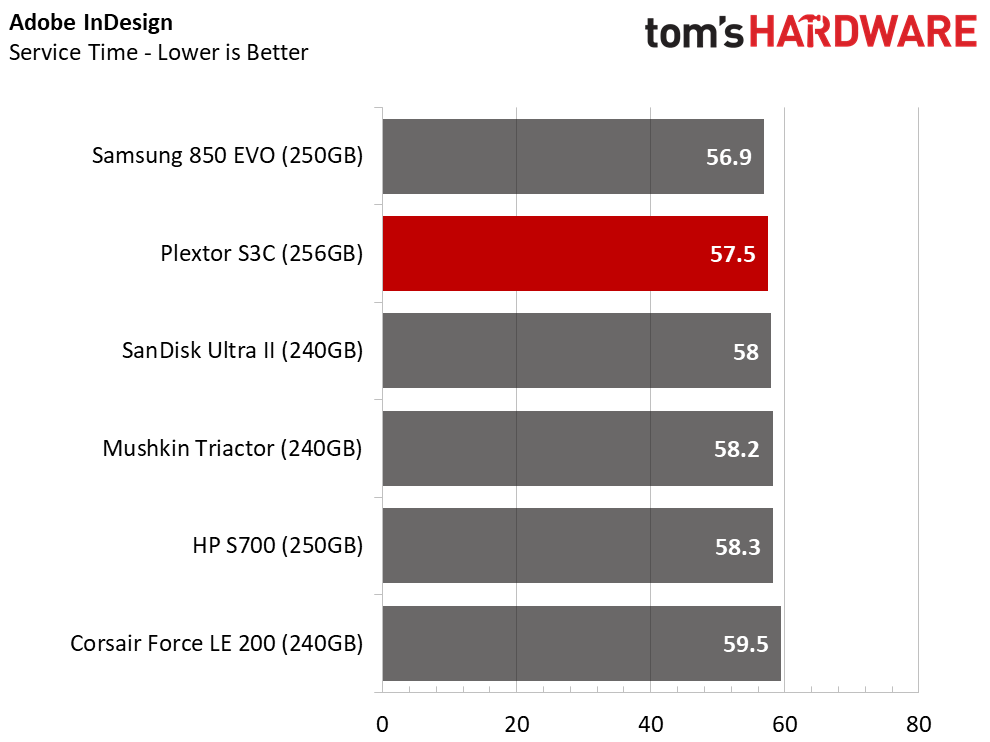
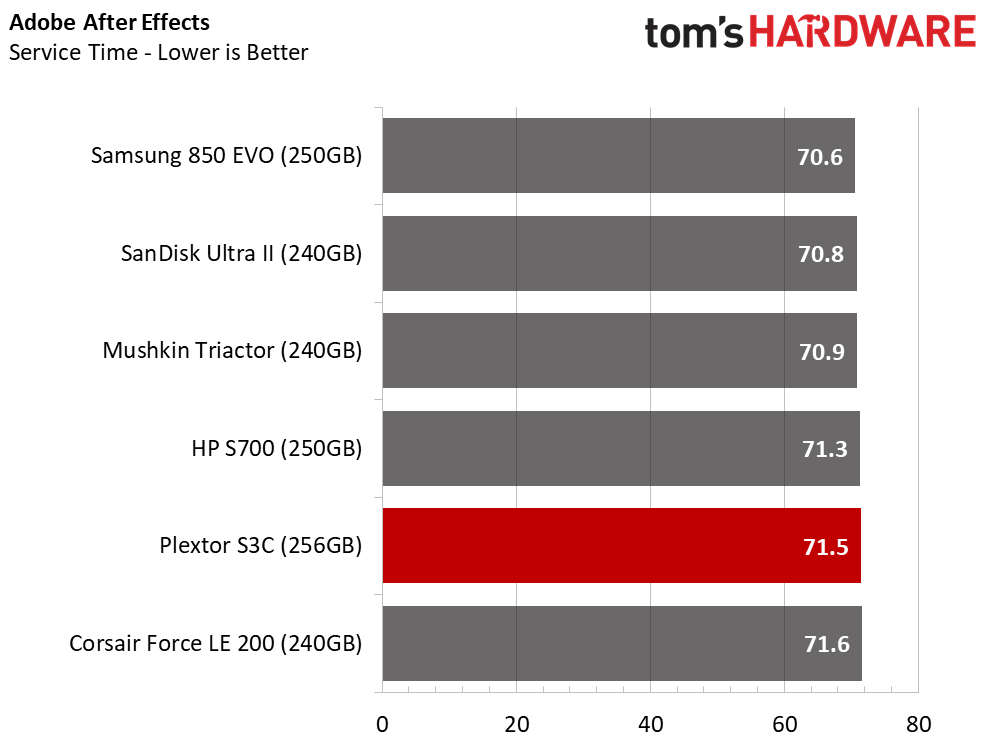
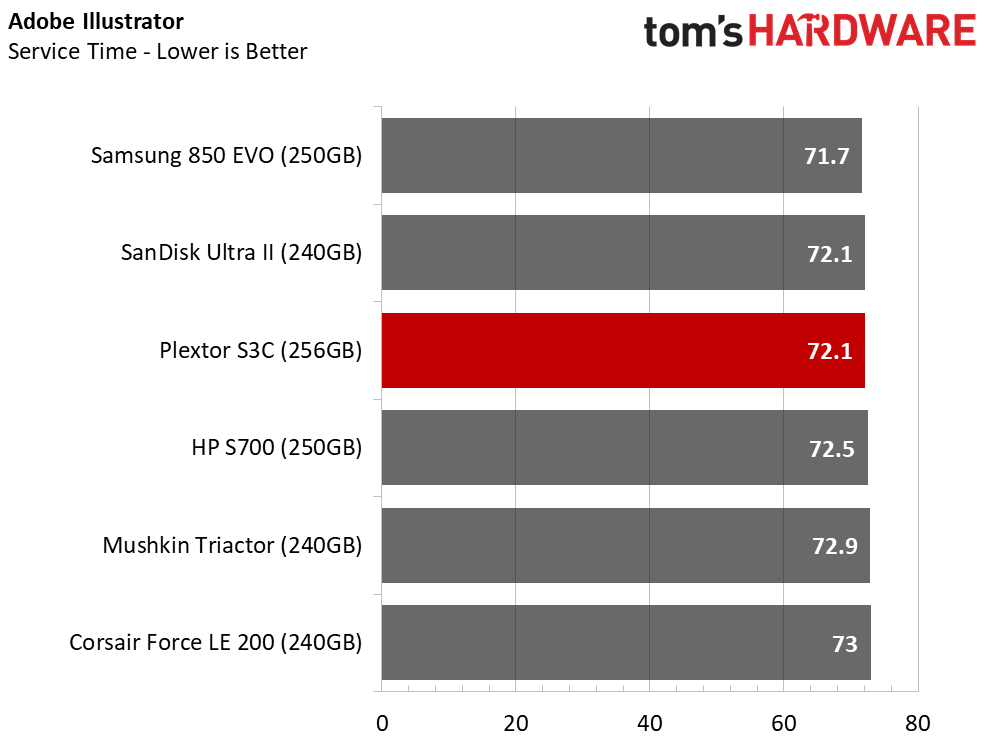
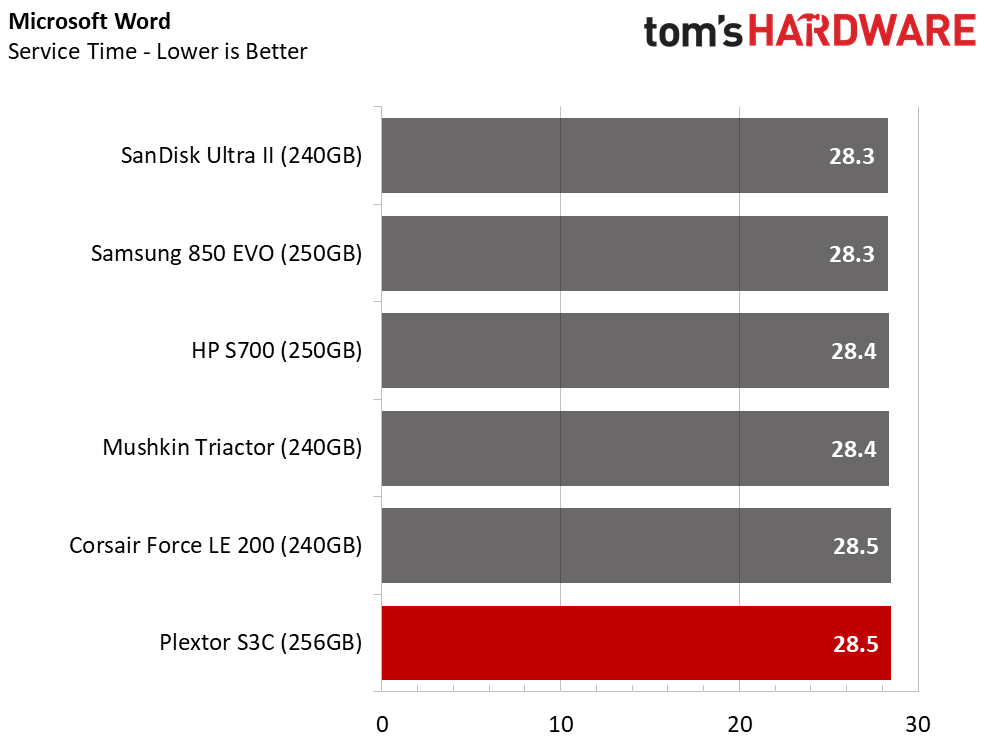
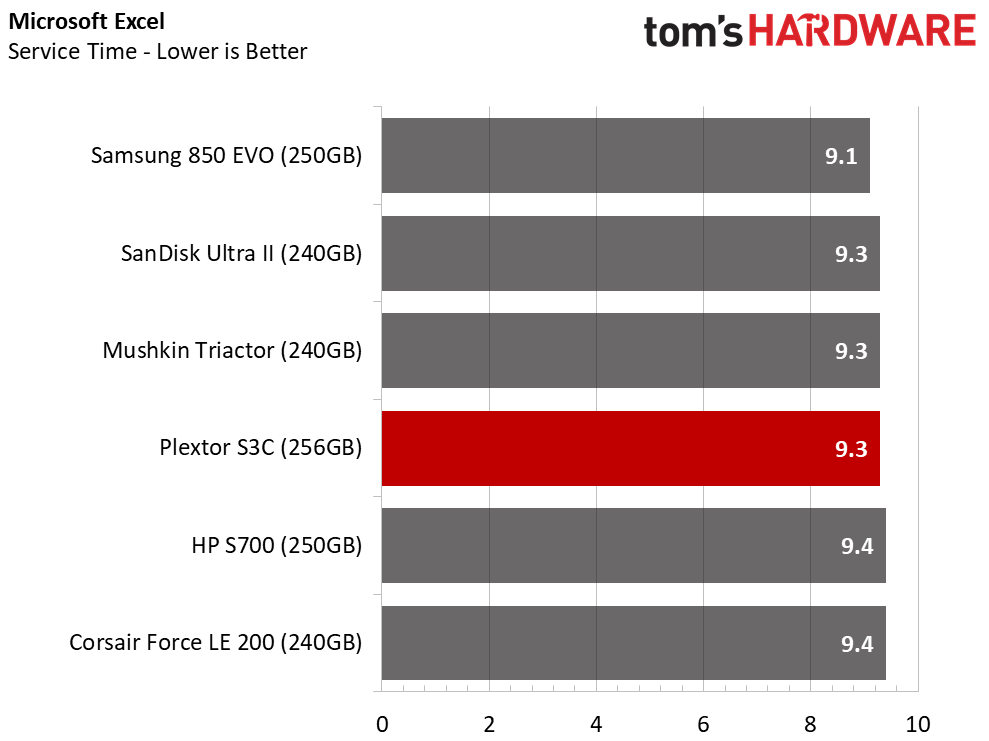
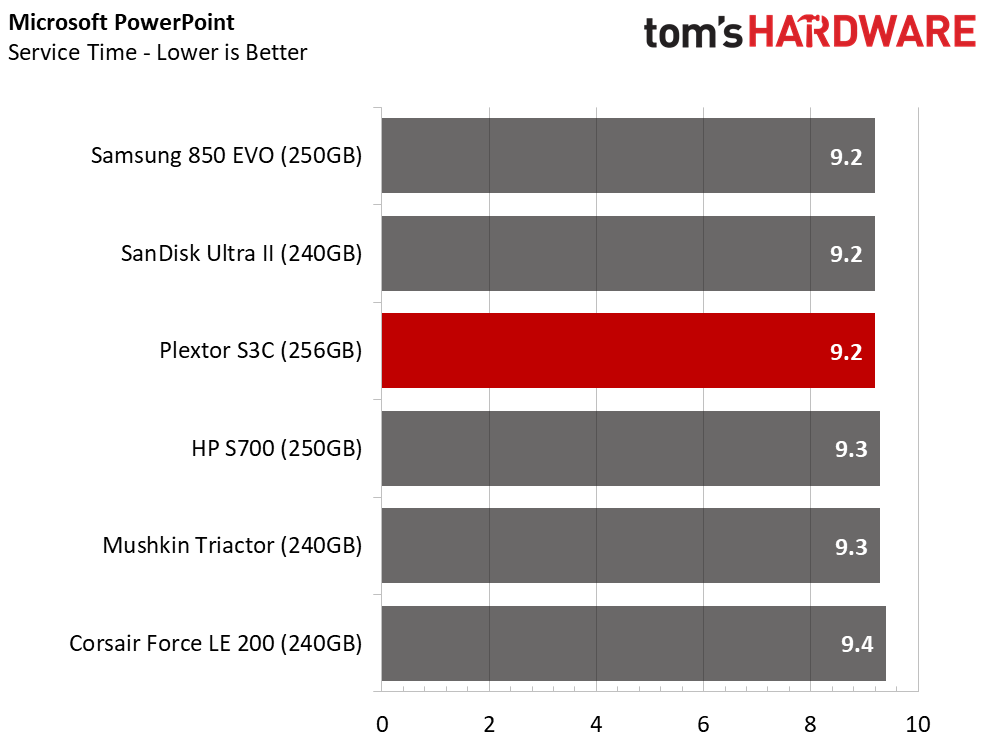
Application performance only varies by a second or less for most tests. As you ramp up the workload, like in the heavy Photoshop test, the drives separate a bit more. For many, the time difference is small enough to consider the drives equal. The seconds add up if you run these applications several times a day, though. Loading a game level every half hour and saving a couple of seconds doesn't seem like much. Loading an image in Photoshop every few minutes and saving six seconds in each instance may be a bit different.
Application Storage Bandwidth
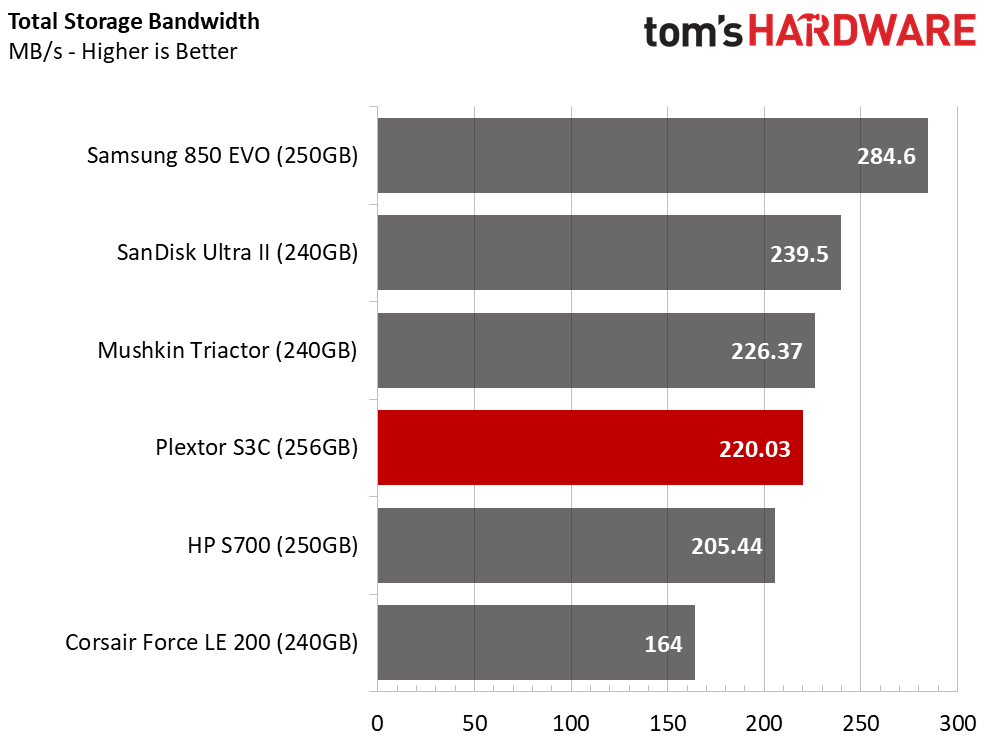
The Plextor S3C lands between the Mushkin Triactor and HP S700. The drive is still quite a bit off of the performance benchmark set by the Samsung 850 EVO 250GB, and that will keep many of our readers from considering this product.
PCMark 8 Advanced Workload Performance
To learn how we test advanced workload performance, please click here.
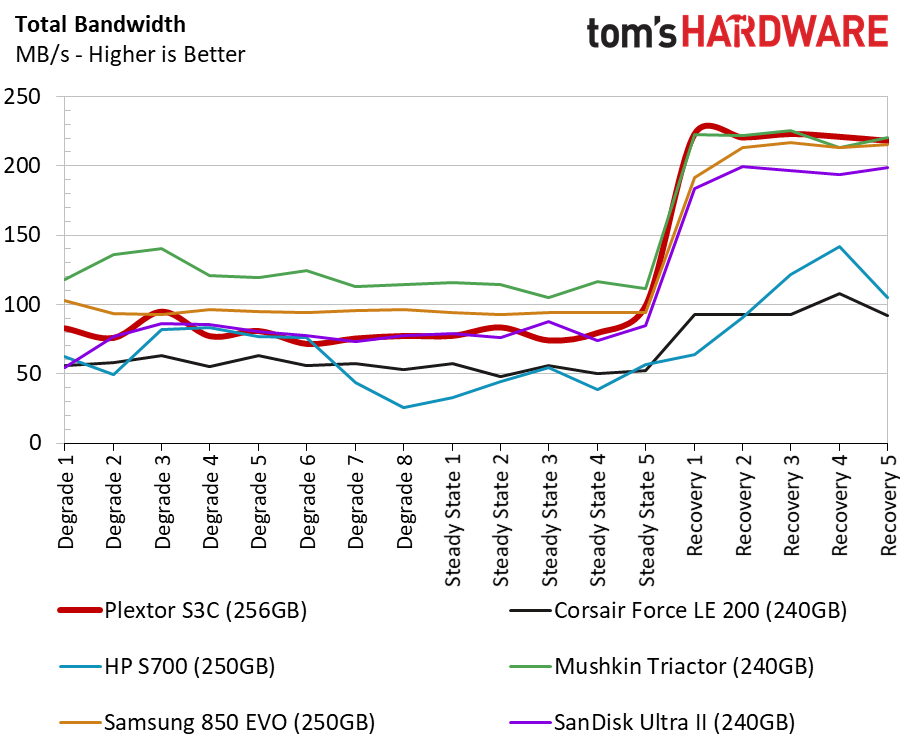
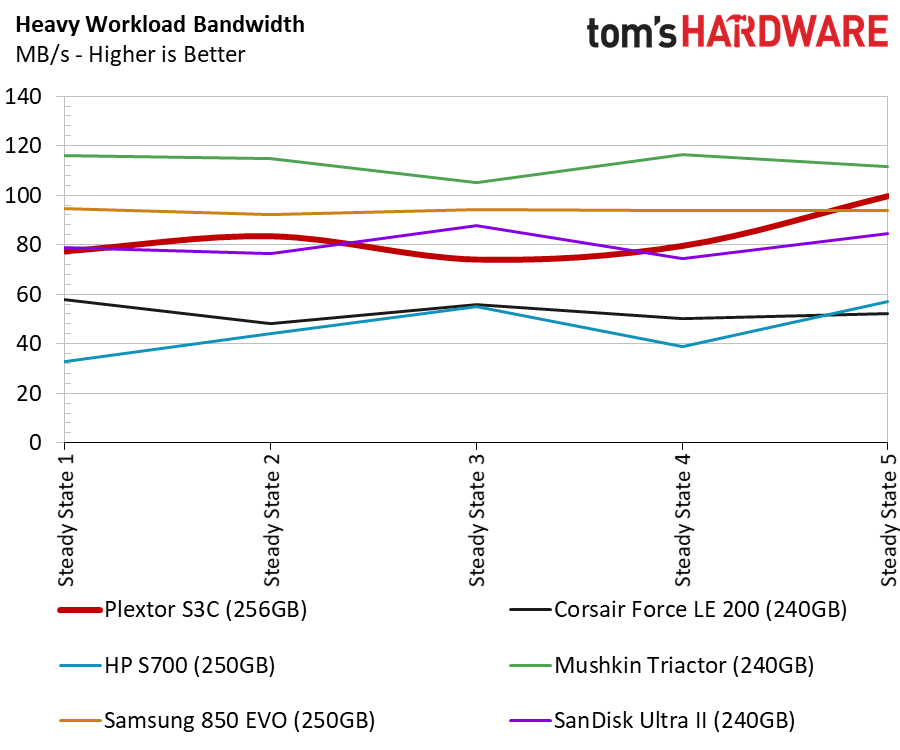
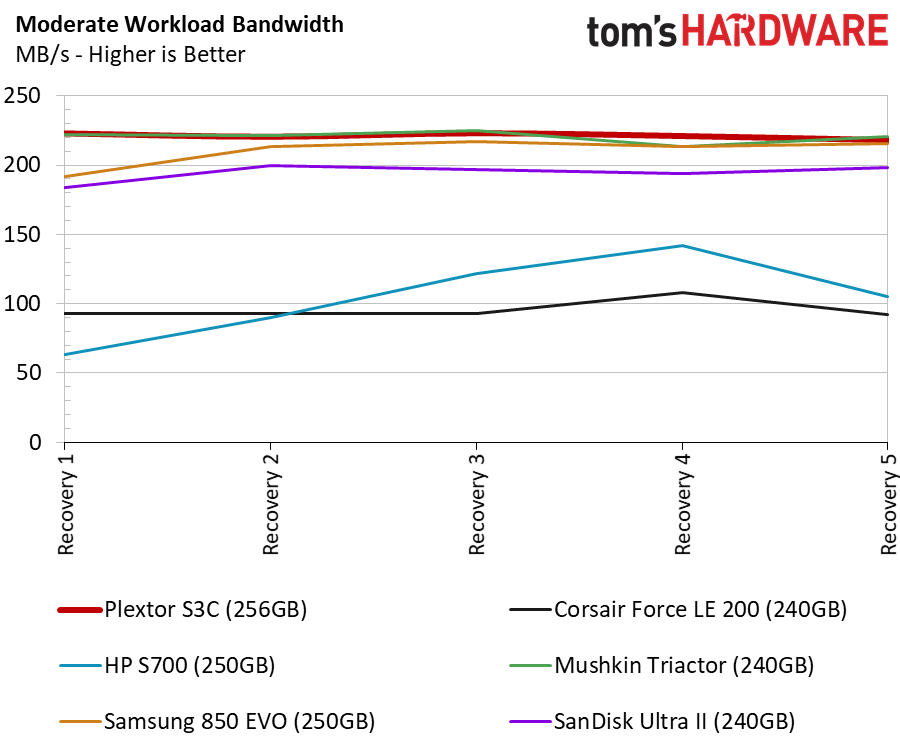
Coming off of a heavy workload, the Plextor S3C 256GB keeps pace with the Samsung 850 EVO. This is a test that historically hasn't favored Plextor SSDs. Several Plextor SSDs have had issues with this test, but those products all used Marvell controllers with Lite-On developed firmware.
Total Service Time
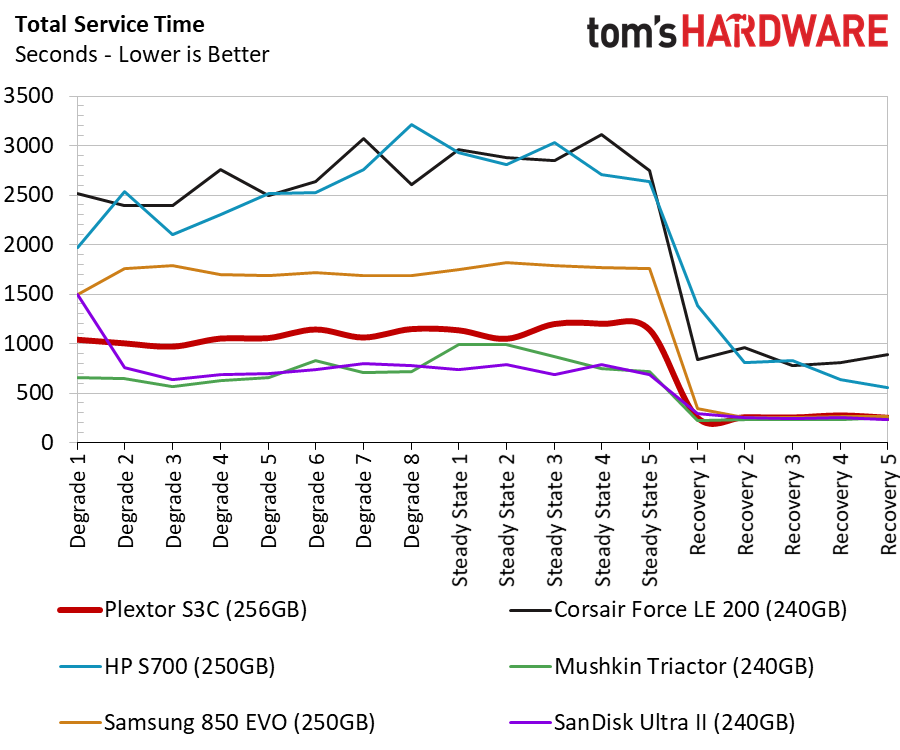
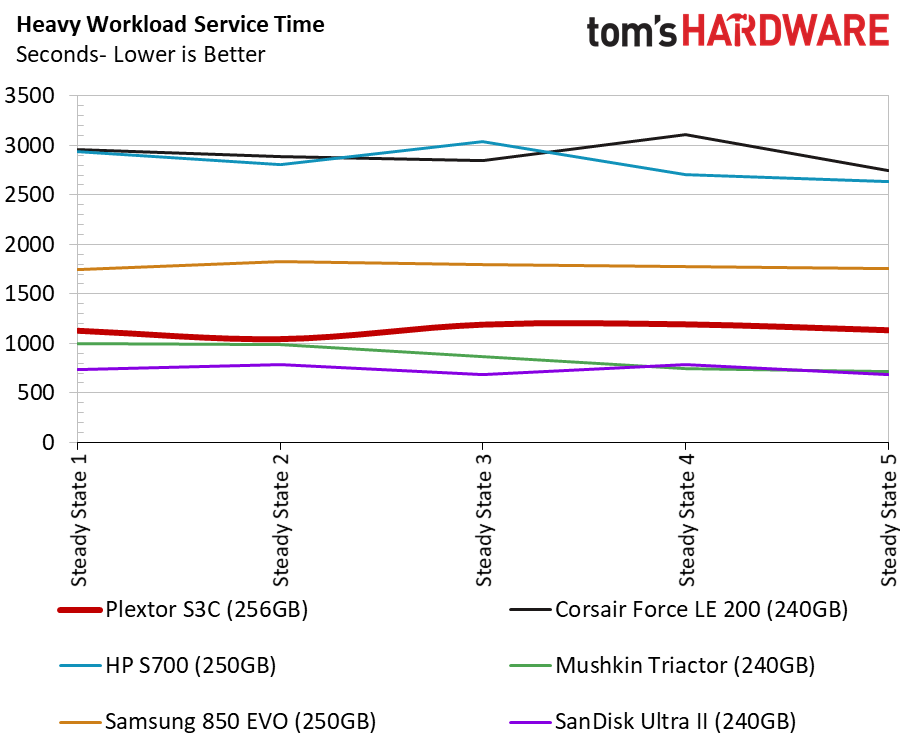
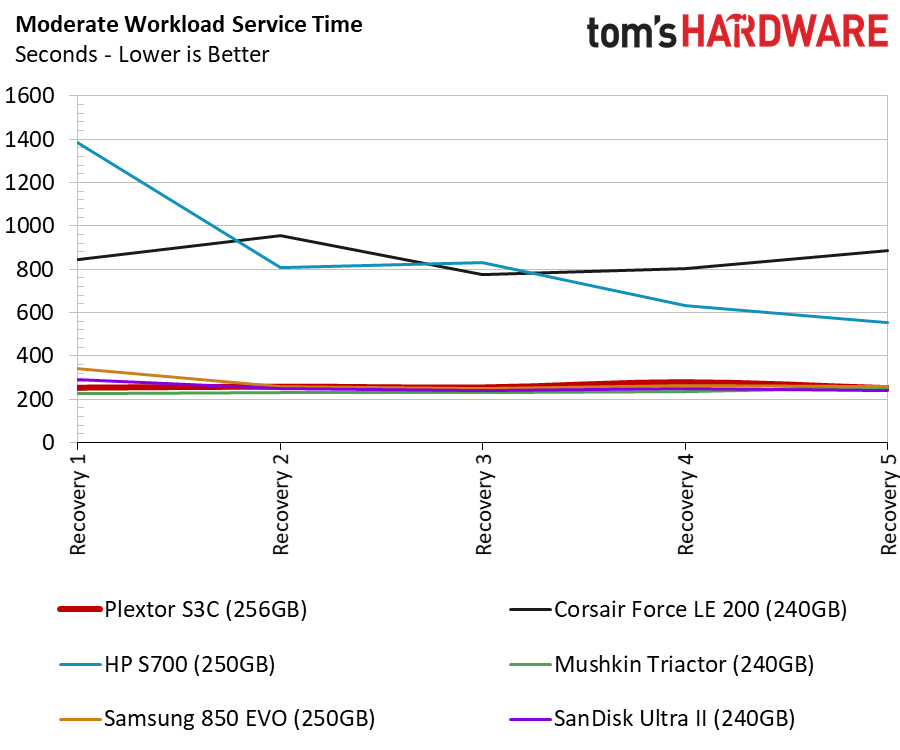
The Plextor/SMI combination seems to have fixed the recovery latency issues, at least for this product. With the S3C near full capacity, the performance is very similar to the 850 EVO SSD.
Disk Busy Time
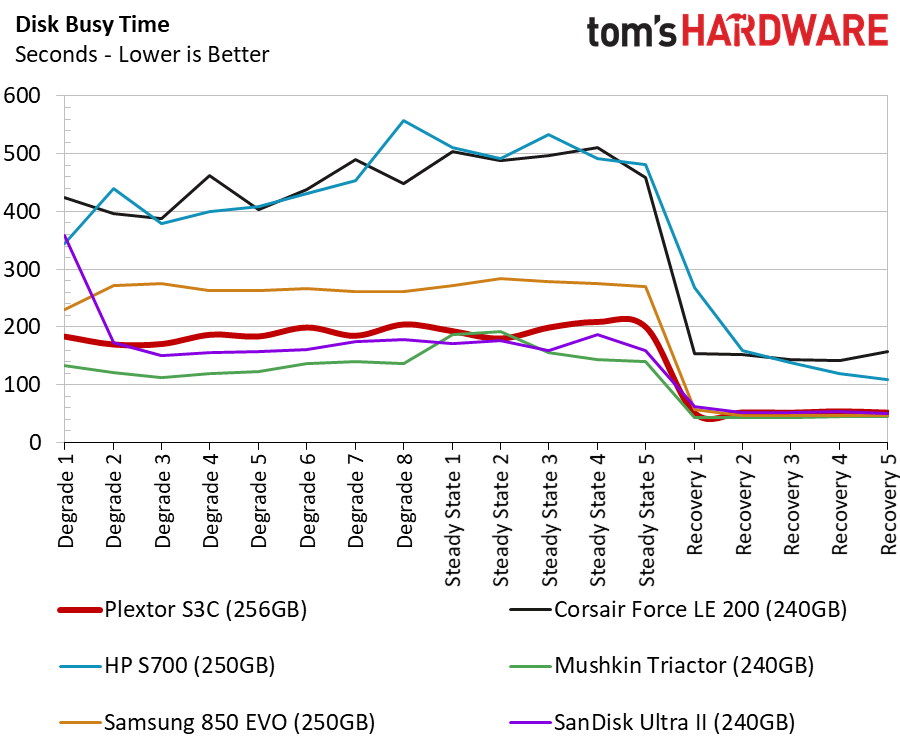
The S3C separates itself from the DRAMless SSDs during the disk busy time test. The line chart measures the amount of time it takes to complete several tasks. This is sometimes called "time to completion," and it's an important test for storage because the SSD can return to a low power state quickly after it completes the task.
Responsiveness Test
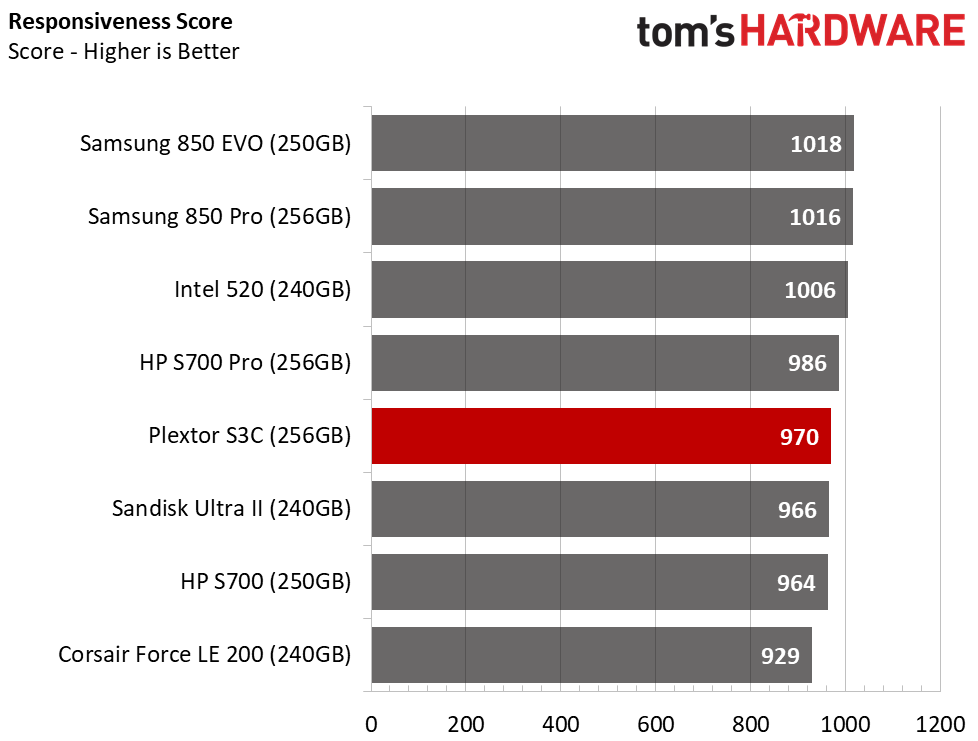
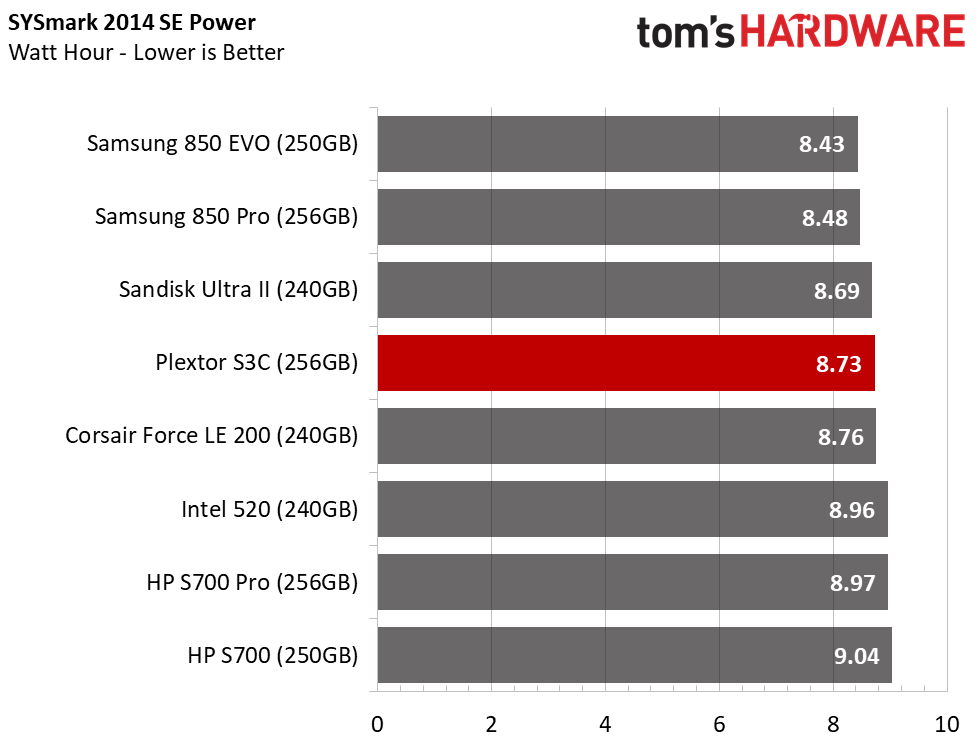
The Responsiveness Test comes from BAPCo's SYSmark 2014 SE software suite. It uses real software and realistic workloads to measure response time and latency. This is one of the best tests we've run for comparing the user experience. The test also measures system-level power consumption. We use a Lenovo Y700-17 with an Intel 6700HQ processor for the two BAPCo software suites.
Notebook Battery Life
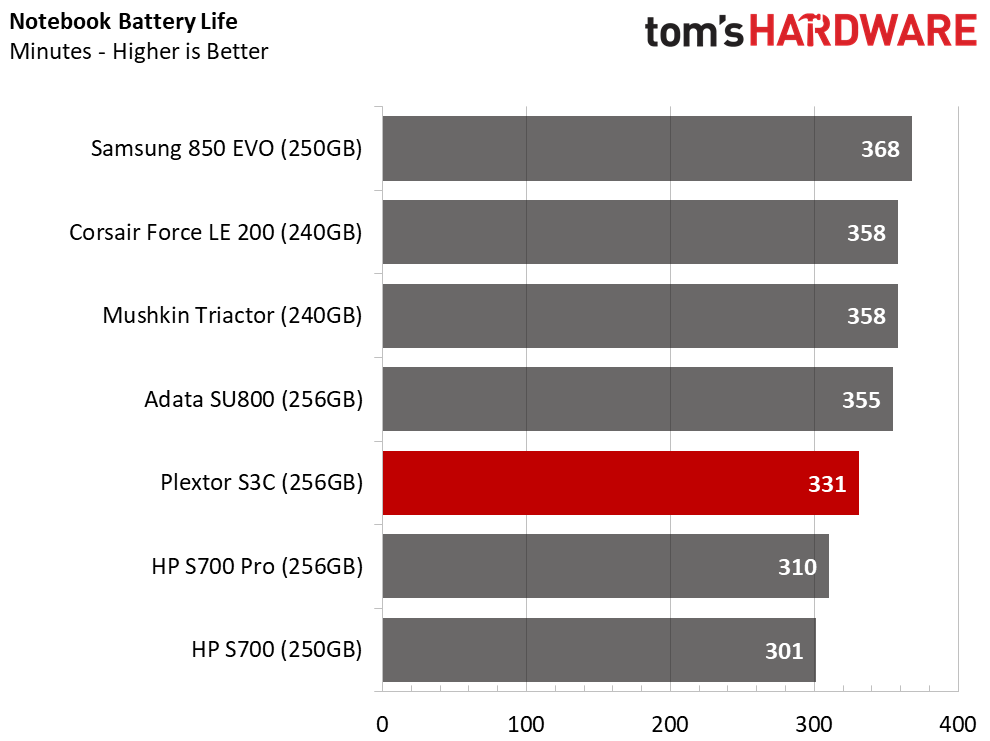
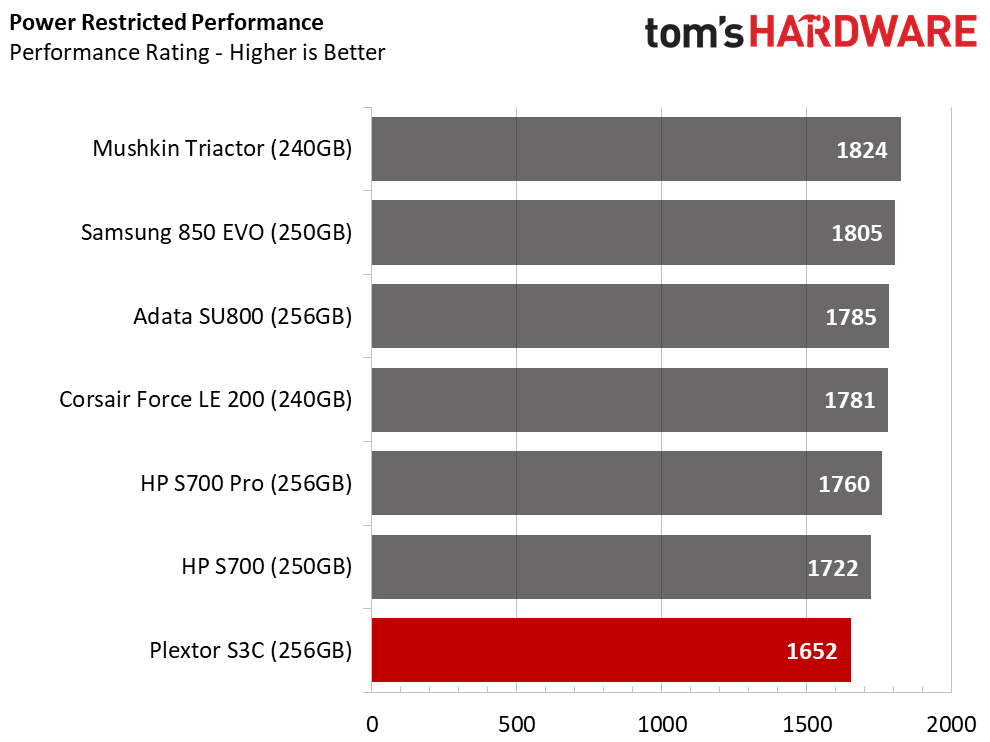
The Plextor S3C 256GB achieved 331 minutes in our Lenovo Y700-17 gaming notebook running MobileMark 2012.5. The test runs through a typical office workload using real-world software like Microsoft's Office and Adobe's suites, along with Winzip and other popular productivity applications.
Notebooks restrict the CPU, DRAM, and DMI buses to save power when they are running on battery. Thisaffects the system performance as a whole, but it also hurts storage performance. Some drives perform well under the restricted power conditions, but others lose more performance than expected. The Plextor S3D 256GB falls into the latter category. System performance drops off sharply when the system is on battery power.
MORE: Best SSDs
MORE: How We Test HDDs And SSDs
MORE: All SSD Content

Chris Ramseyer was a senior contributing editor for Tom's Hardware. He tested and reviewed consumer storage.
-
Martell1977 It seems that no one but Samsung is really looking to improve performance. New SSD's come out and none seem to come close to dethroning the 850 EVO, which has been out for a while now. I'm not complaining, my 850 EVO is great, but I'd think that, as in other markets (like CPU's) new generations would bring more performance...on some level.Reply
Is it just laziness, stagnation, or companies just don't want to put the money into R&D? -
kalmquist I'm guessing that big advantage the EVO has over the competition is the flash memory, combined with a controller that is good enough that it isn't a bottleneck.Reply
I don't think that the continued dominance of Samsung it the result of other companies not investing in R&D. Other companies are spending money on R&D; they just aren't getting the same kind of results as Samsung is. In particular, Micron/Intel, Toshiba/Western Digital, and SK Hynix have all spent heavily to develop 3D NAND flash. The point is that you can spend a lot of money on R&D and end up with something like the AMD Bulldozer design--which worked, but didn't offer much in the way of competition to Intel. -
derekullo You also have to contend with both sata and nvme / pci-express having products that are near the theoretical ceiling of what they can offer.Reply
Sata 3.0 = 6 gigabits per second or 600 megabytes due to unit conversions and taking 8b/10b encoding into account
Samsung 850 Pro has 550 MB/s read and 520 MB/s write
Nvme / pci-express 3.0 x4 link = 3.94 GB/s
For comparison the read speed of the Samsung 960 Pro is 3.5 GB/s
And so the race is to spend millions in research and development to get closer to closing the gap between what you have and the theoretical limit so you can proclaim your product is the fastest.
Or to spend millions in research and development to make the cheapest dollar / gigabyte product in order to saturate your product as the goto SSD for the OEM so the OEM can say their computer is "Powered By A Solid State Drive" allowing them to place bar charts on the box.
QLC would be the best example of this, but really all of the NAND after SLC are examples.
Even a 300 megabyte/s read and write ssd getting 5000 IOPS at a queue depth of 1 can still claim to be 50 times faster more responsive than a 7200 rpm hard drive.
Or they can be even sneakier and compare their 5000 IOPS ssd at a queue depth of 1 and compare it to a 5400 rpm hard drive "in small print of course" and say it is "100 TIMES MORE RESPONSIVE THAN A SPINNING HARD DRIVE DISK" in big bold letters just like that.
They never quote actual speed due to only being able to say 5+ times faster.
50 or 100 times are much better numbers for marketing.
I'd be perfectly content with a 10 Terabyte SSD with 6000 IOPS at a QD of 1 and 300 MB/s read and write at lets say $300.
Even if that was QLC at 500 DWPD that is still 5000 terabytes or 5 petabytes of data.
Allowing me to ditch hard drives forever. -
daglesj I would add that in going from a 550MBps SSD to a 3500MBps Samsung NVMe, in day to day stuff...I cannot tell the difference. There is a limit to the speed benefits. But cheaper and bigger is always nice.Reply -
derekullo Reply20162265 said:I would add that in going from a 550MBps SSD to a 3500MBps Samsung NVMe, in day to day stuff...I cannot tell the difference. There is a limit to the speed benefits. But cheaper and bigger is always nice.
You are absolutely correct.
If your goal is starting a game then games in general don't really load much data to start.
They load alot of small files that need to be processed by the cpu.
Tom's had an article a few years ago that illustrates this beautifully.
http://www.tomshardware.com/reviews/ssd-gaming-performance,2991-11.html
629 megabytes of data needed for Civ5 to start.
Civilization V took 38 seconds to launch but of those 38 seconds the ssd was only busy for 2.15 seconds
Note they used a Sata based ssd, OCZ Vertex 3 240 GB.
With a 3500MBps Samsung NVMe, assuming 960 Pro, the game start time would not be affected by much if any.
The disk busy time would only be 1 second or less followed by 30+ more seconds of waiting for the cpu to catch up.
The only way to really see the difference would be to transfer a multi-gigabyte file between 2 ssd through an interface with a higher than 540 megabytes a second bandwidth, like 10 gigabit ethernet.
540 megabytes a second being the read speed of an 850 Pro.
10 gigabit (1.25 gigabytes a second) would be about 50% saturated from a sata based ssd, like an 850 Pro.
Due to the 10 gigabit limit a Samsung 960 Pro would only appear to be twice as fast as an 850 Pro due to completely saturating the 10 gigabit link.
-
DerekA_C either way it paves the way for future speeds and connections when we start seeing 100gbs=(10%) actual throughput we shall start getting even more CPU and chipset bottleneck. CPU's need to start pushing passed 5ghz base clock @ 8-cores, but question is who will actually push that and the ability to utilize the next phase of DDR5/DDR6 and PCI-E 4.0 and 5.0 slots.Reply -
Jeffs0418 When one considers that the 850evo was released in December of 2014 and still dominates the price segment. It's remarkable that the others are still trying to catch up!Reply
I bought one(250gb) shortly after release for a lot more than they cost now but have no regrets at all.
