PowerColor PCS+ R9 290X Review: Cool, Quiet, And Priced Right
PowerColor sent over a second 2.5-slot Hawaii-based card. The first was MSI's R9 290X Lightning. This one, the PCS+ R9 290X is both lighter and less expensive. Does PowerColor out-engineer MSI and score an upset, or is the PCS+ simply less capable?
Power Draw: Gaming, Web Browsing, And Idle
Measuring the Power Draw
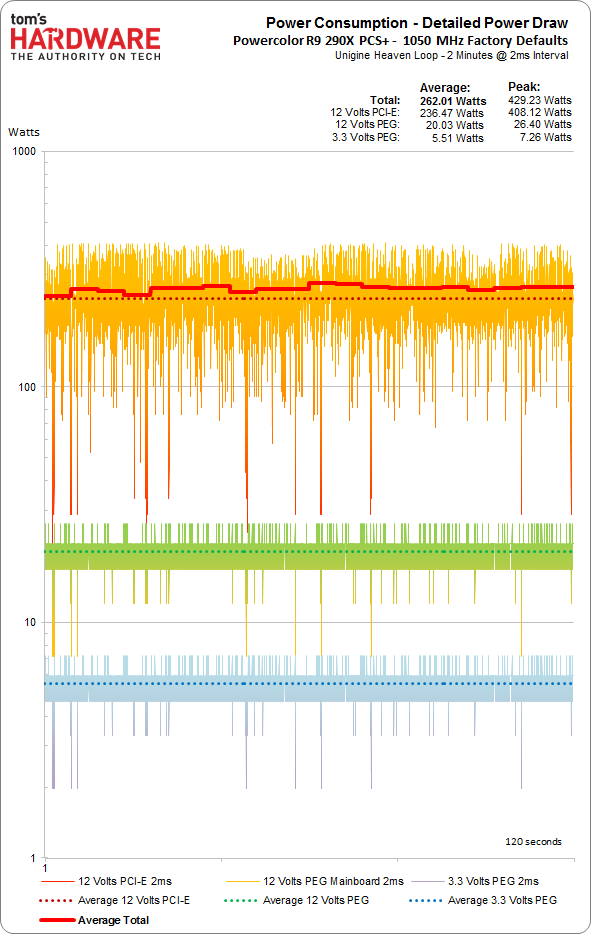
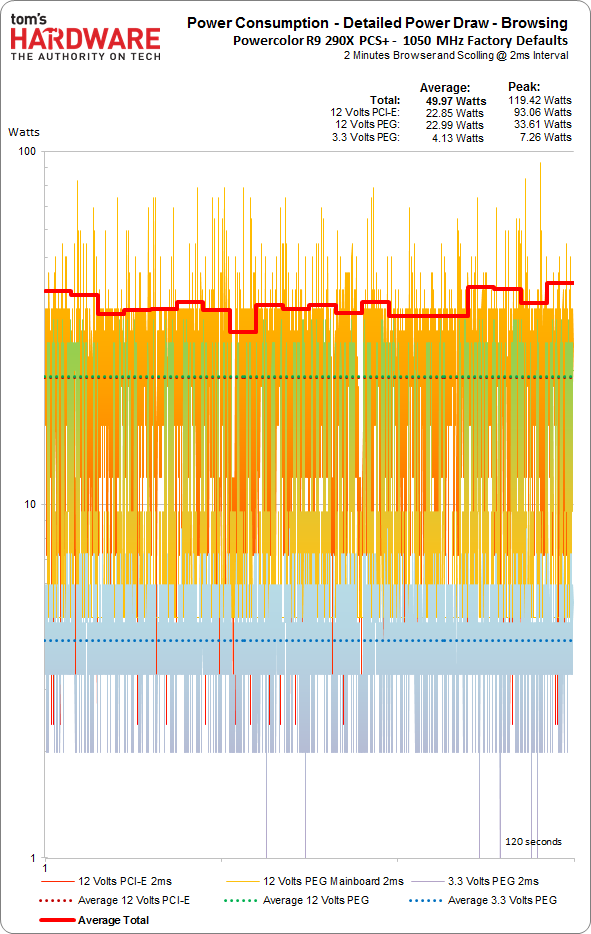
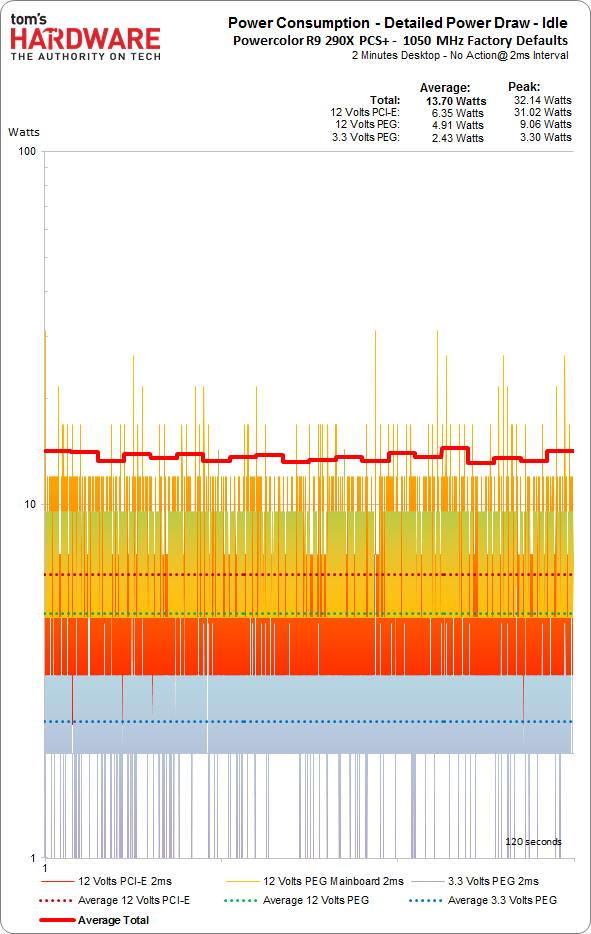
The following diagrams contain a text header, which is followed by the actual measurement curves. In that header, you'll find the average and peak power draw on all three rails, along with the sum of those averages, giving us the total average and peak power consumption.
Total peak wattage is not simply the sum of the three individual peaks, but rather the total peak wattage observed within the 120-second sample window. That makes more sense than adding the peak wattages together, since it's unlikely that all three max out at the same moment.
Power Consumption during Gaming
These diagrams employ a logarithmic scale. The thick red line represents average total power draw at a time resolution of six seconds.
The average power consumption demonstrated by PowerColor's PCS+ R9 290X is 262 W, in line with what we expected. That's 3 W higher than the 30 MHz-faster MSI R9 290X Lightning. Approximately half of a watt can be attributed to the PowerColor card's memory, which operates at 1350 MHz, rather than 1250 MHz. But a few watts could be lost by less complex voltage regulation circuitry.
Still, the differences are small. And while the PCS+ R9 290X may exhibit slightly higher power use, it also pulls about 10 W less from the motherboard slot than MSI's card.
Power Draw During Internet Surfing
People don’t spend all of their time gaming; typically, much more is spent browsing the Web. We simulate this workload with a static version of our home page, scrolling all the way down and back up again. While scrolling does make use of hardware acceleration, the power draw for that is quite benign.
Power Draw at Idle Load
Many people leave their PCs on all the time, making the power consumption of components at idle quite important. Measuring draw from the wall doesn't cut it if we want to isolate the graphics card, since there's no way to reliably factor out the rest of the platform.
Get Tom's Hardware's best news and in-depth reviews, straight to your inbox.
Our state-of-the-art test equipment shows that this graphics card only draws 13.7 W at idle, which is less than our previous generation of lab instruments indicated:
Current page: Power Draw: Gaming, Web Browsing, And Idle
Prev Page Power Draw: Test System And Methods Next Page Clock Rates, Temperature, And Sound Level
Igor Wallossek wrote a wide variety of hardware articles for Tom's Hardware, with a strong focus on technical analysis and in-depth reviews. His contributions have spanned a broad spectrum of PC components, including GPUs, CPUs, workstations, and PC builds. His insightful articles provide readers with detailed knowledge to make informed decisions in the ever-evolving tech landscape
-
CaptainTom I just want to point out that this and most 290X's beat a stock 780 Ti. The fact is both 780 Ti and the 290X are trade blows and belong on the same GPU tier. However only one does cost $150 less and come with 4GB VRAM...Reply -
Memnarchon Reply13232466 said:I just want to point out that this and most 290X's beat a stock 780 Ti. The fact is both 780 Ti and the 290X are trade blows and belong on the same GPU tier. However only one does cost $150 less and come with 4GB VRAM...
Well, since you are comparing a non reference GPU, you should take also a non-reference GPU to compare.
Tom's using Gigabyte's 780ti OC which costs the same as the reference card...
So even the non-reference models are on a different tier as well as their reference... -
FormatC Reply13232896 said:Any chance of measurements in metric as well as imperial?
Typical translation errors, the original is in metric ;)
http://www.tomshardware.de/powercolor-r9-290x-pcs-review,testberichte-241519-3.html4
I will clearify with Chris, that we use both in the future. Metric is worldwide more common :D -
dave_trimble Surprised the benchmark graph show performance at 1080p. Aren't the 290 series kind of wasted at that resolution? I would love to see the results at 1440p or even 4k. I have a feeling the 780ti might not look quite as good in comparison at higher resolution.Reply -
photonboy A stock GTX780Ti is 7% faster at 2560x1440, and 8% faster at 1920x1080 (18 games averaged):Reply
http://www.techpowerup.com/reviews/EVGA/GTX_780_Ti_SC_ACX_Cooler/26.html
With such a HUGE difference in prices, quality, and performance on all top-end cards you really have to do your research.
The R9-290X prices vary from $550 to $780 USD! -
dave_trimble Reply13233877 said:A stock GTX780Ti is 7% faster at 2560x1440, and 8% faster at 1920x1080 (18 games averaged):
http://www.techpowerup.com/reviews/EVGA/GTX_780_Ti_SC_ACX_Cooler/26.html
With such a HUGE difference in prices, quality, and performance on all top-end cards you really have to do your research.
The R9-290X prices vary from $550 to $780 USD!
Thanks for the response! I thought I had seen reviews elsewhere that showed the 290 series really closing the gap, or even surpassing the 780ti at higher resolutions, but perhaps I was remembering wrong. I recently decided to upgrade to a dual-290 setup, but if I had gone with a single card, the 780ti was at or near the top of my list (until the 290x prices came crashing down, that is).
-
That_Guy88 So is the difference between 290x's almost entirely due to cooling (and some OC)? I have someone who wants to sell me a reference 290x for $350, but I have a gtx 770, so it would seem that I would need to buy an after market cooler as well to make it worth my while. Thoughts?Reply -
vertexx Reply
See these articles for after-market cooling options:13234604 said:So is the difference between 290x's almost entirely due to cooling (and some OC)? I have someone who wants to sell me a reference 290x for $350, but I have a gtx 770, so it would seem that I would need to buy an after market cooler as well to make it worth my while. Thoughts?
Air cooling:
http://www.tomshardware.com/reviews/r9-290-accelero-xtreme-290,3671.html
Liquid Cooling:
How to:
http://www.pcper.com/reviews/Graphics-Cards/Using-NZXT-Kraken-G10-Watercool-Radeon-R9-290
And results:
http://www.tomshardware.co.uk/radeon-r9-290-and-290x,review-32872.html


