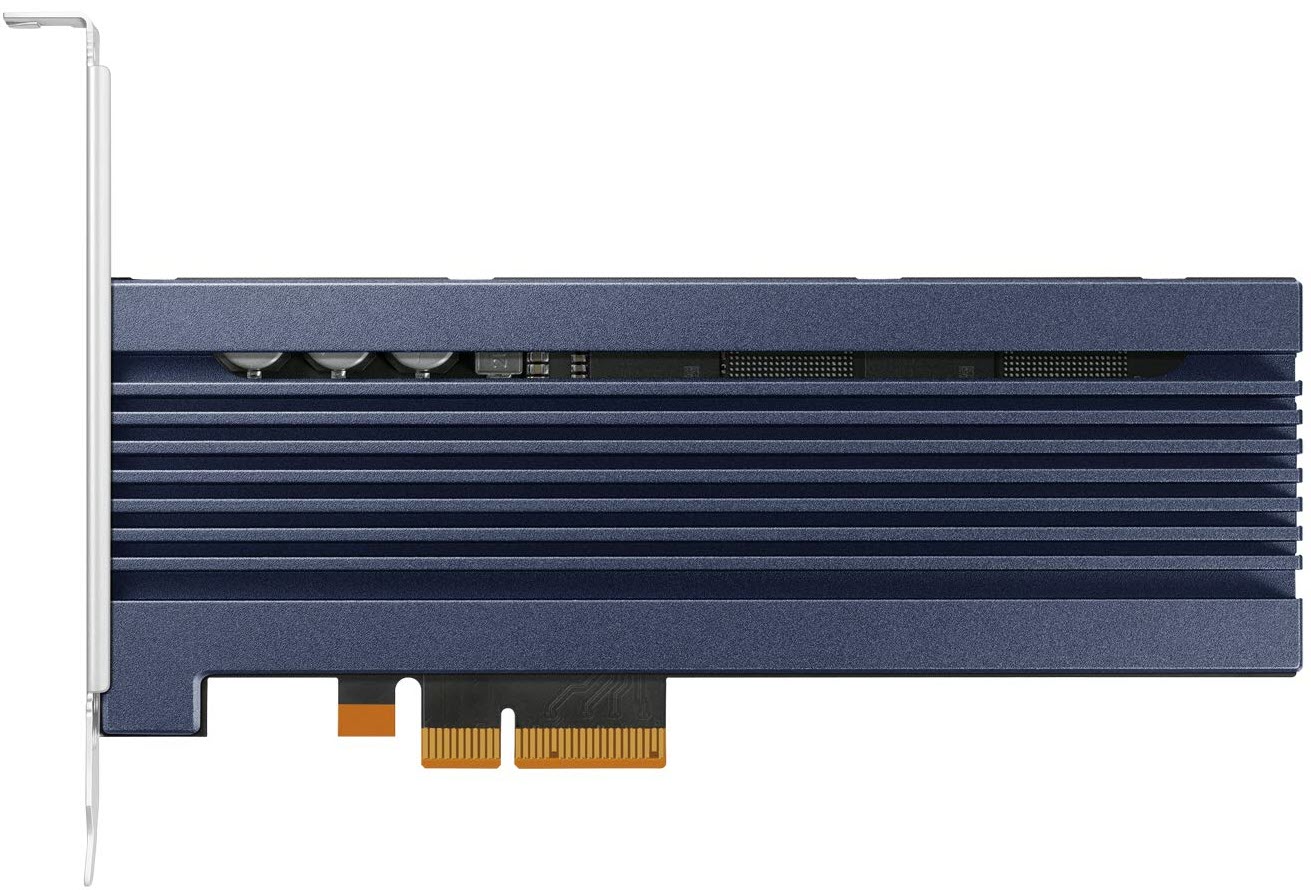
Samsung 983 ZET SSD Review: Z-NAND Takes On Optane
Why you can trust Tom's Hardware
4KB Performance Results
4KB Random Read Performance
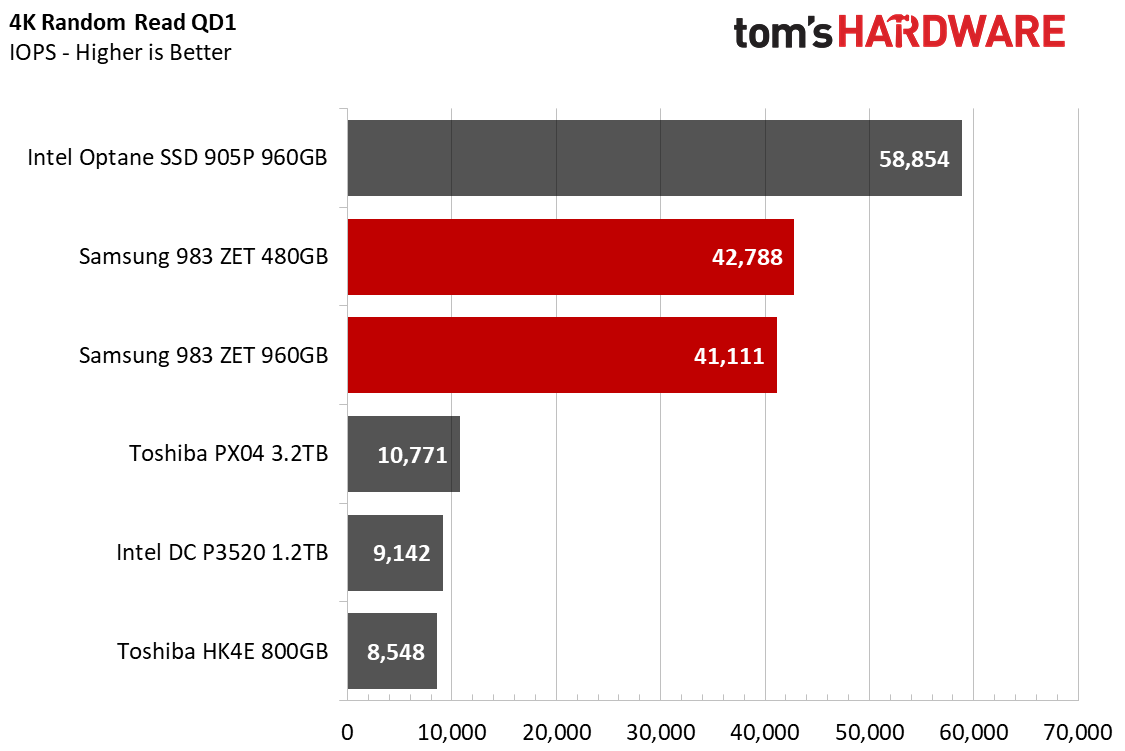
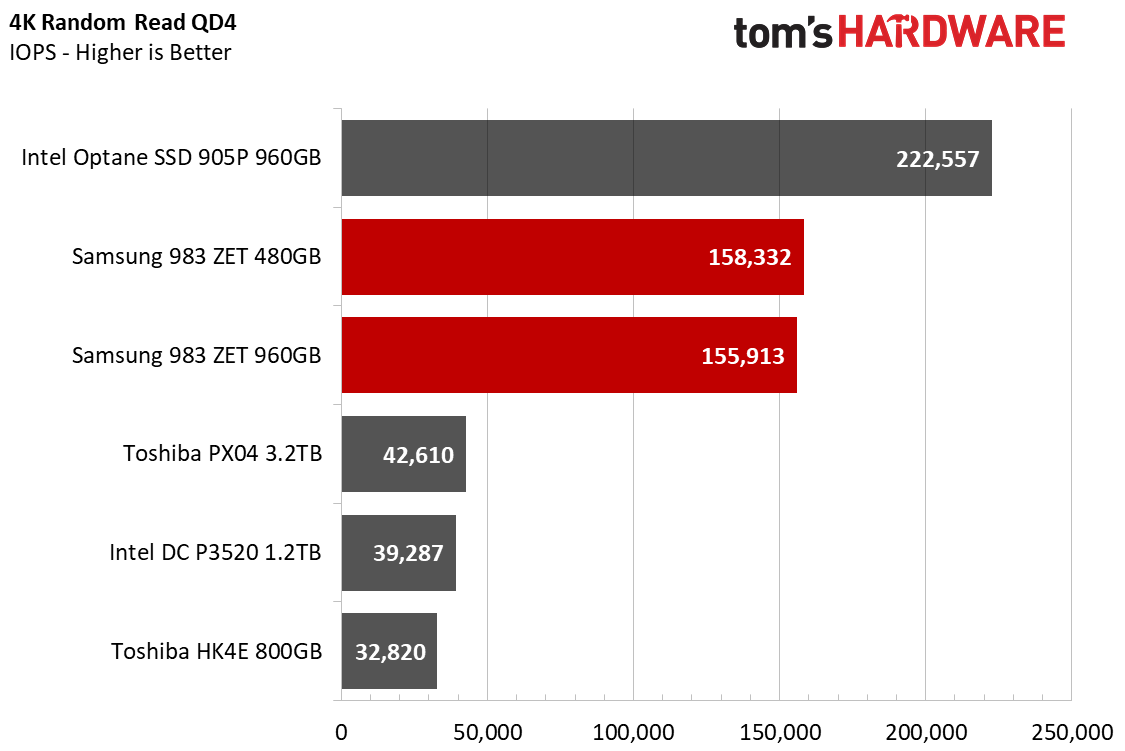
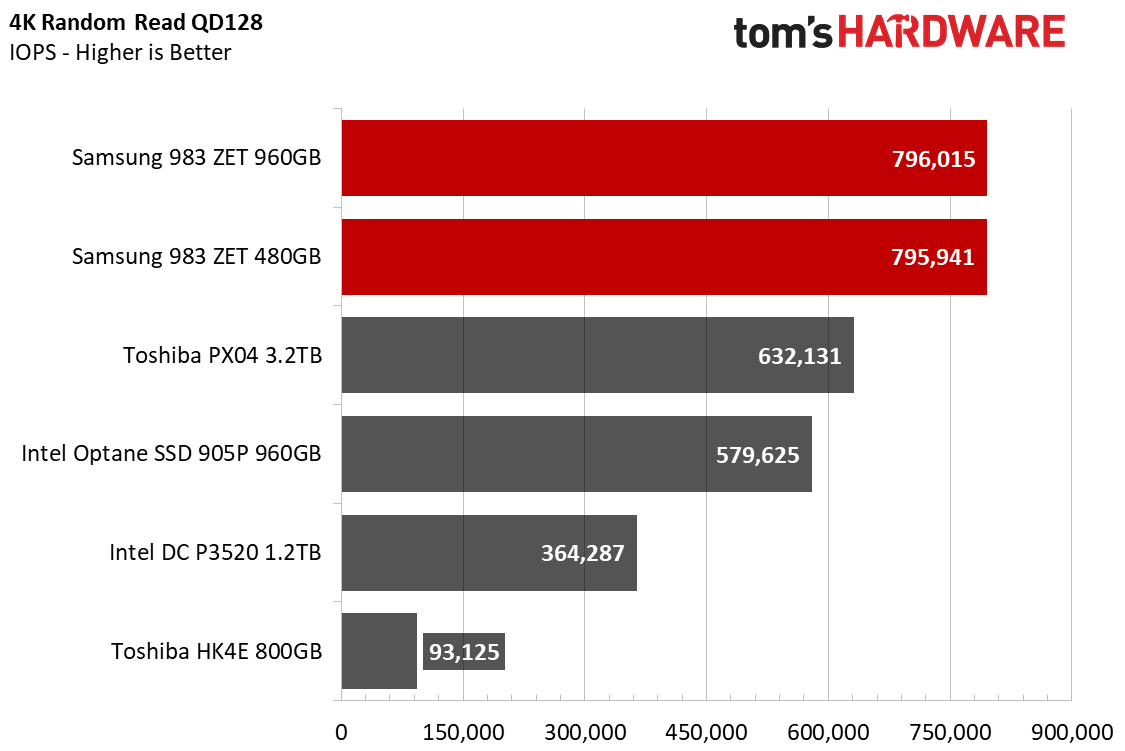
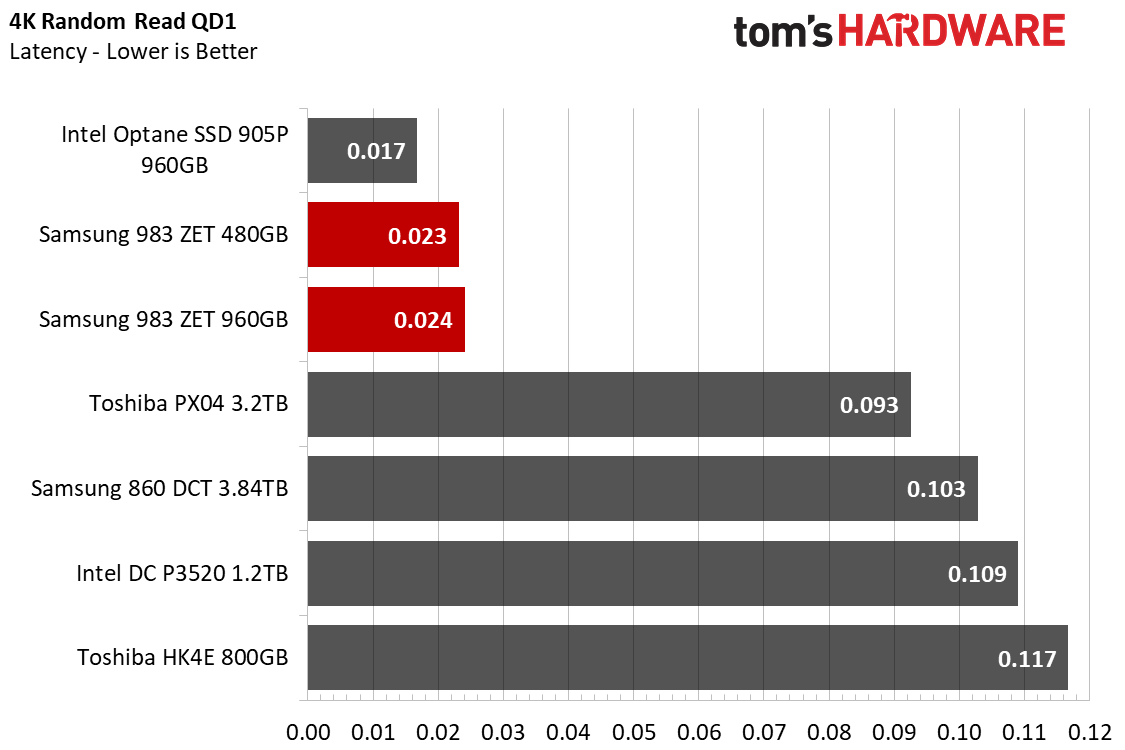
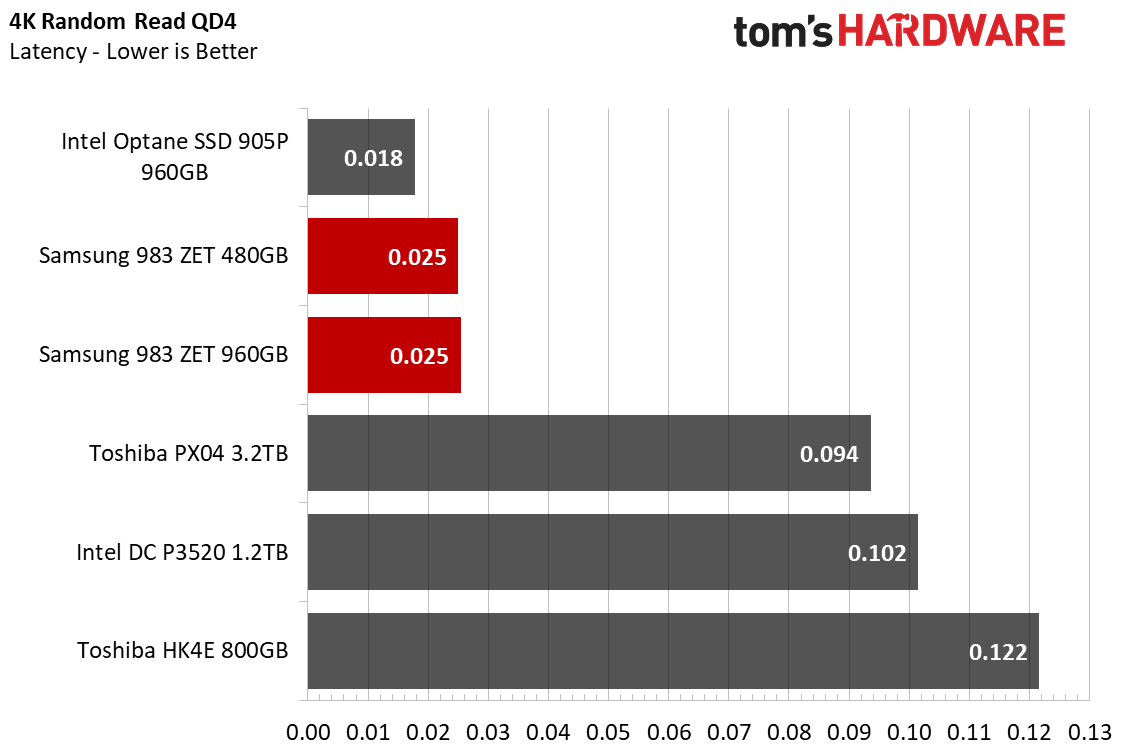
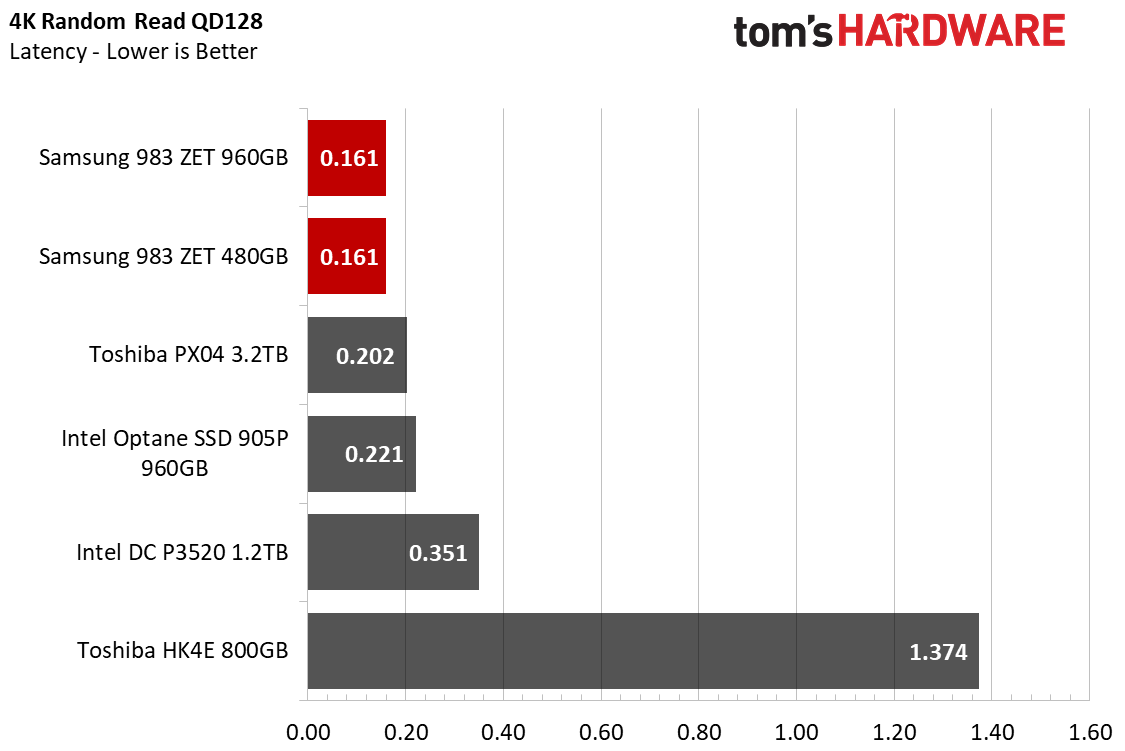
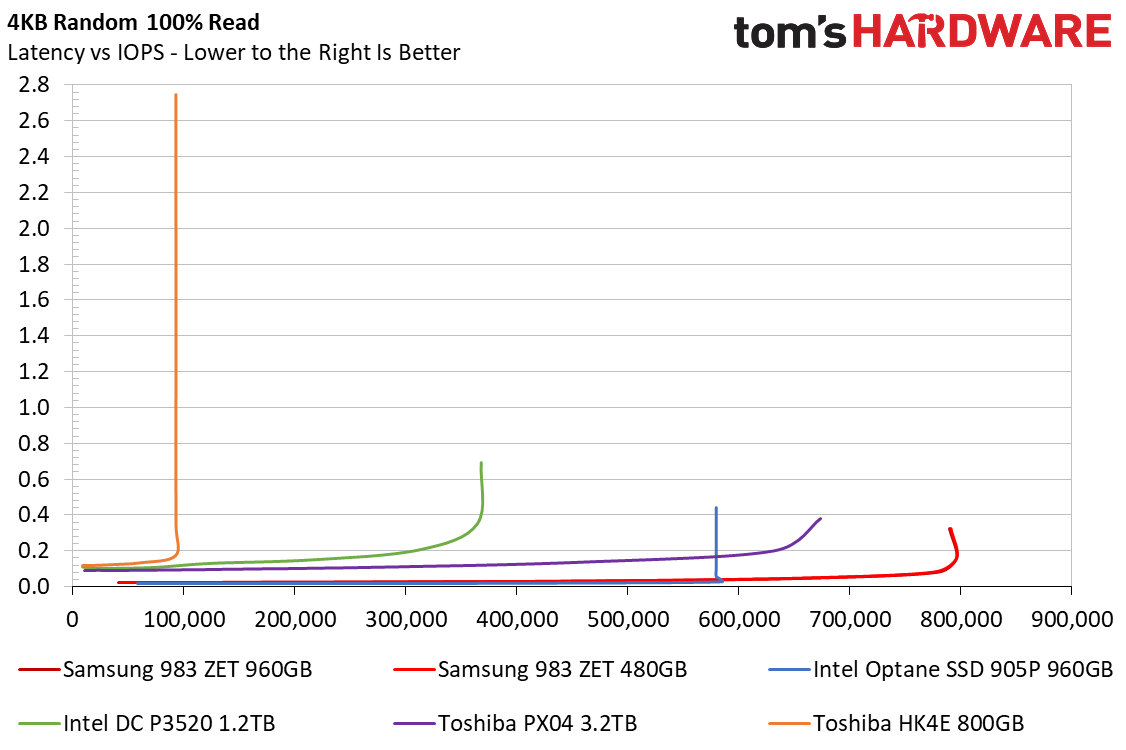
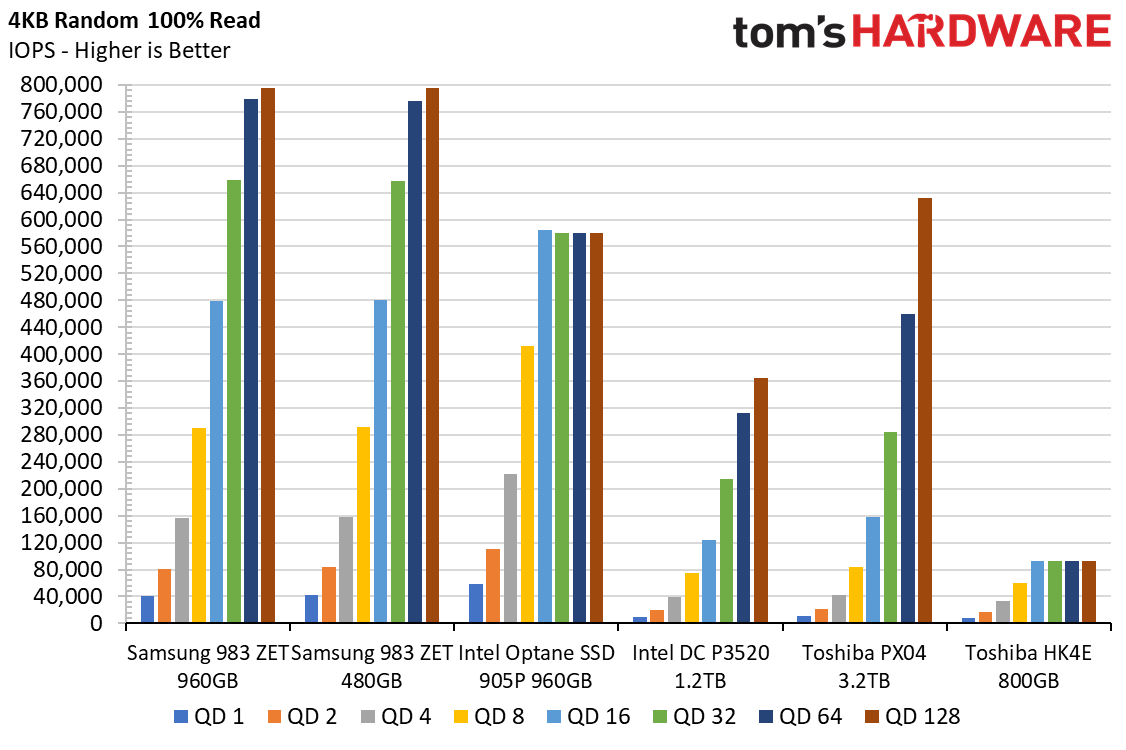
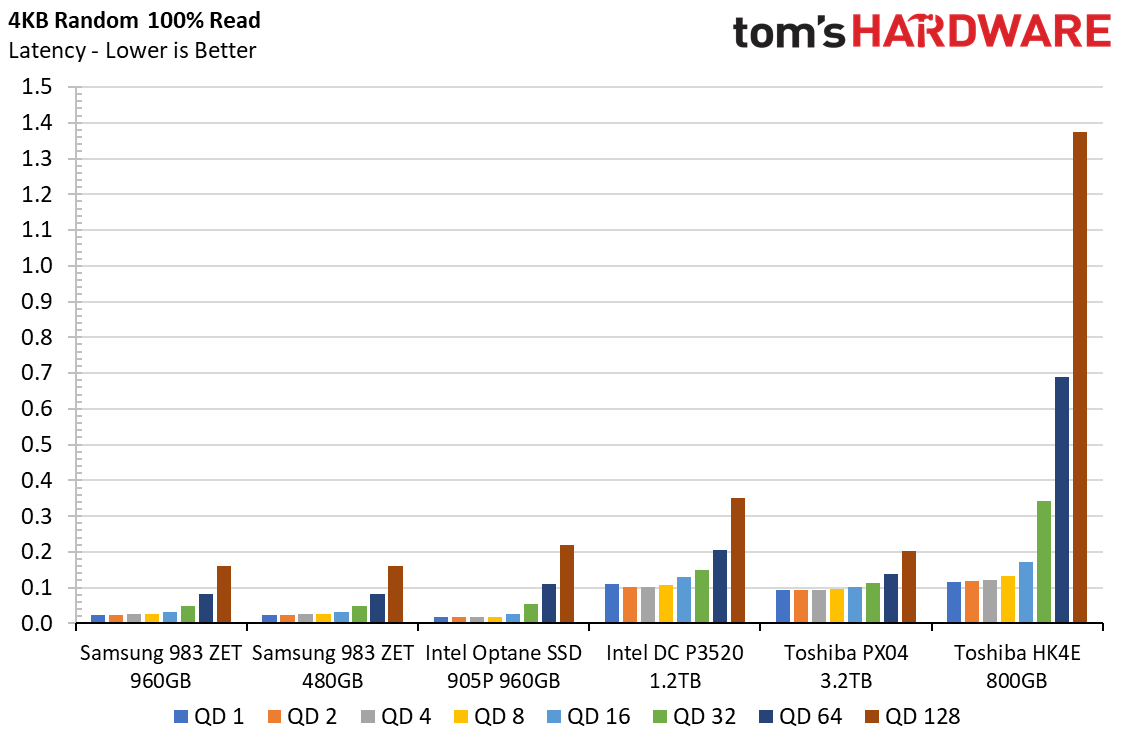
While slightly more latent than the Optane based 905P at lower QDs, Samsung's controller proves to be a bit more capable than Intel’s. Both the 480GB and 960GB 983 ZET provide nearly 800,000 IOPS during a pure random read workload.
The 983 ZET is also significantly better than any other MLC or TLC SSD on our charts. At a QD of 1, Samsung rates the 983 ZET for a read latency of just 0.03ms, but our samples achieved even faster results of 0.025ms up to a QD of 4. That's one quarter the latency of the PX04 and Intel DC P3520, and nearly as fast as Optane, which clocked in at 0.19ms.
4KB Random Write Performance
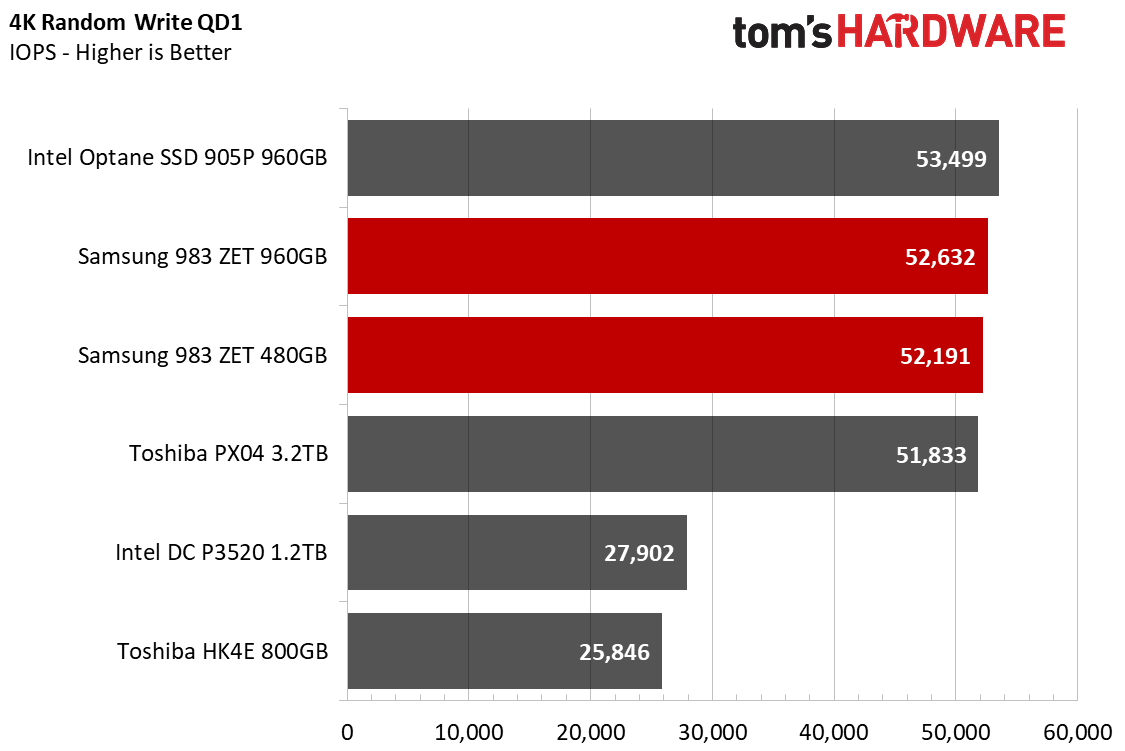
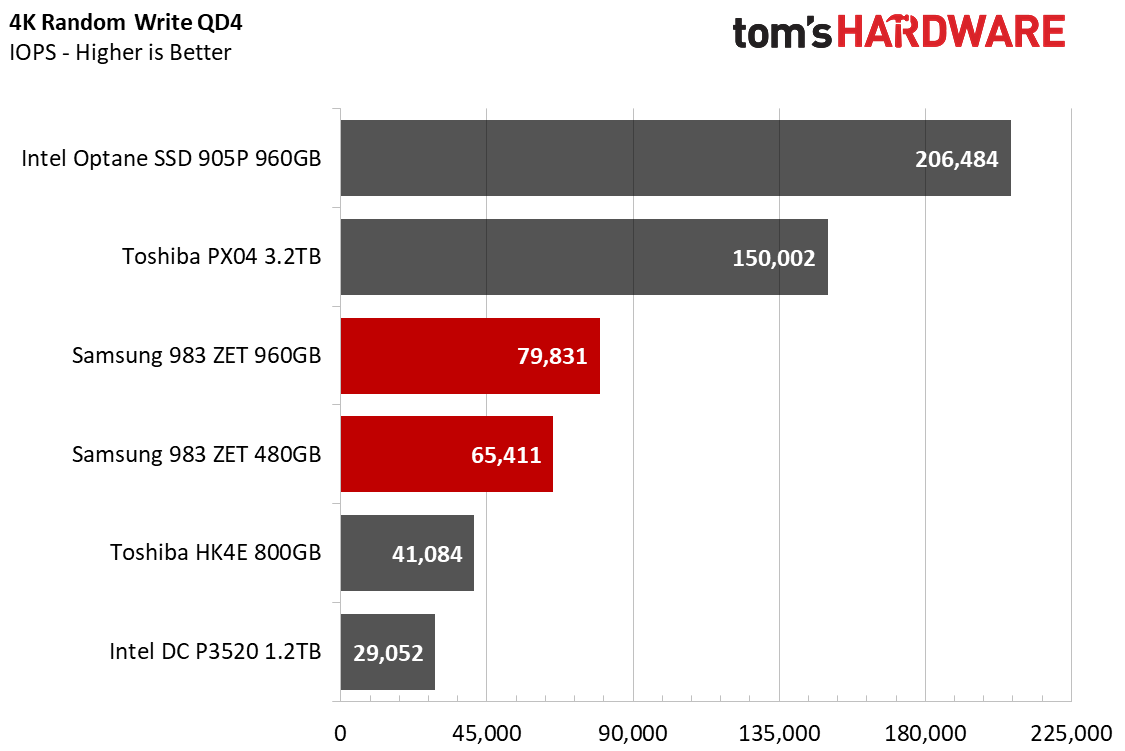
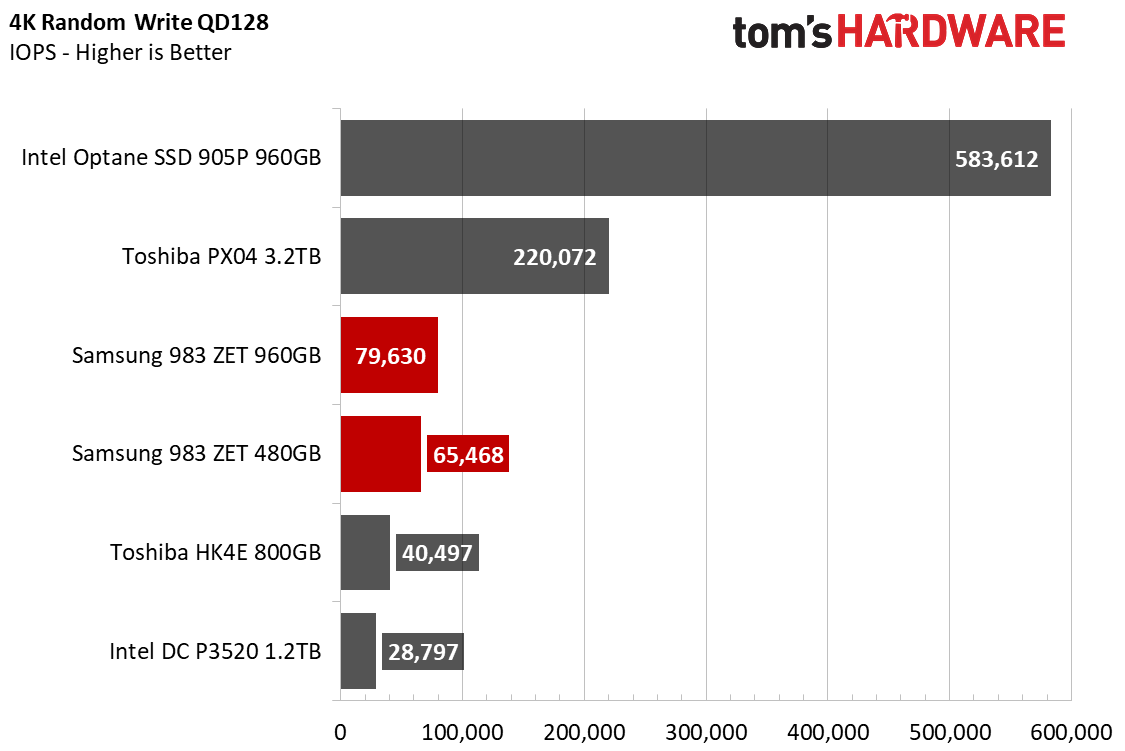
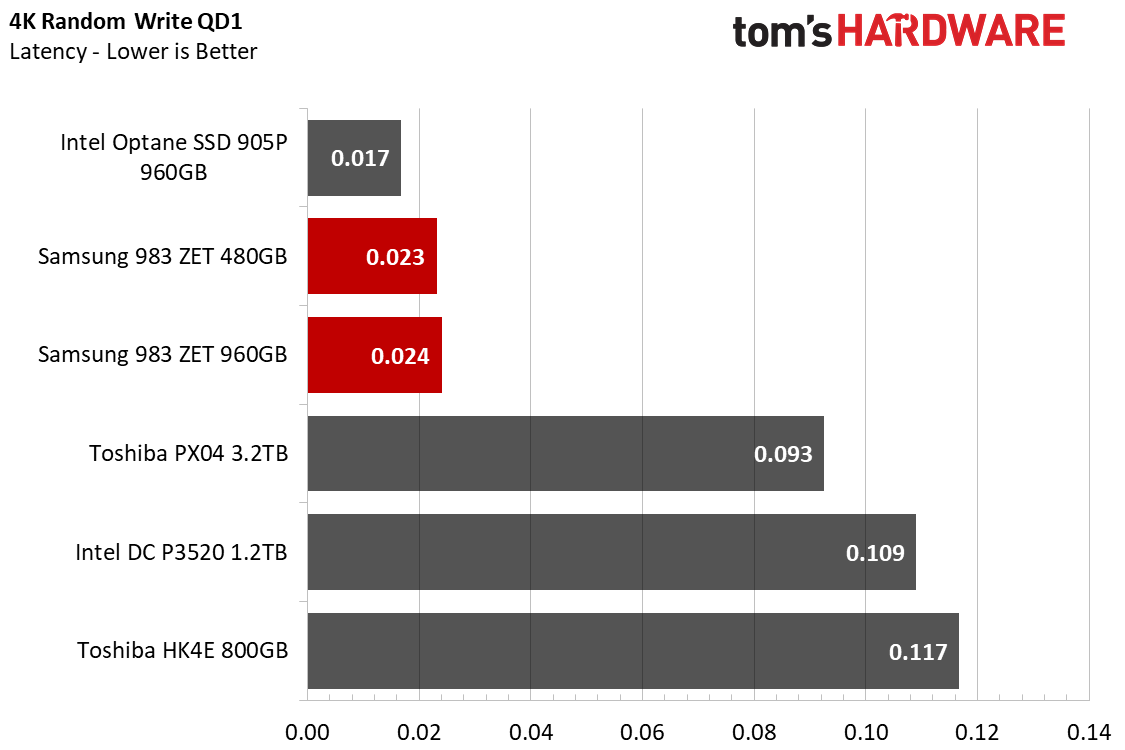
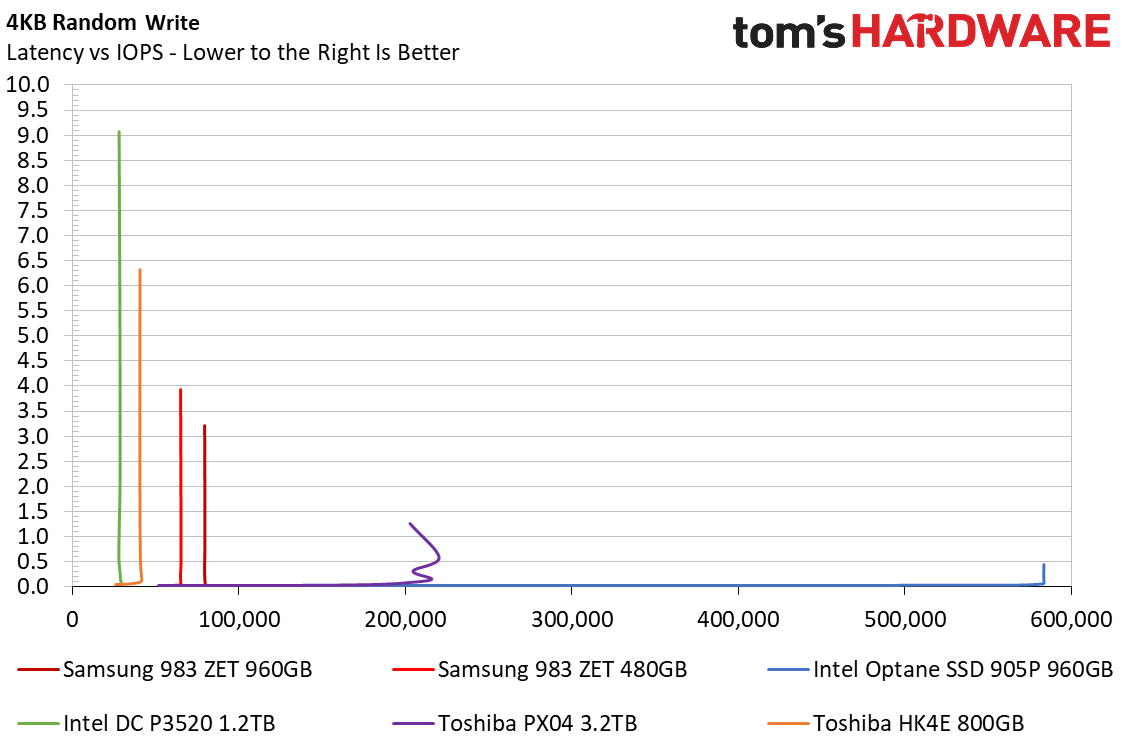
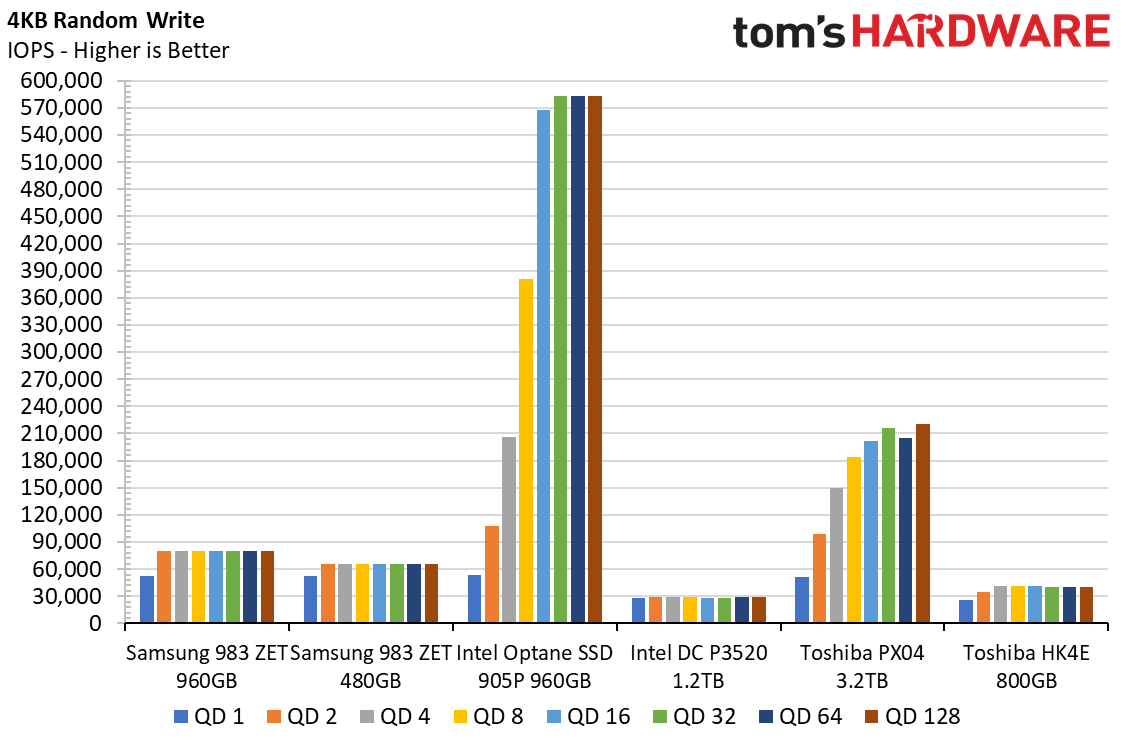
Unlike the Toshiba PX04 and Intel 905P, Samsung’s 983 ZET comes with lower random write performance. At a QD of 1, the PX04 gives the 983 ZETs a run for the money with very similar results, but beyond that, it easily surpasses the ZET drives as it reaches up to 220,000 IOPS. Here, the 480GB 983 ZET can sustain up to 65,000 IOPS, while the 960GB model serves up nearly 80,000 IOPS.
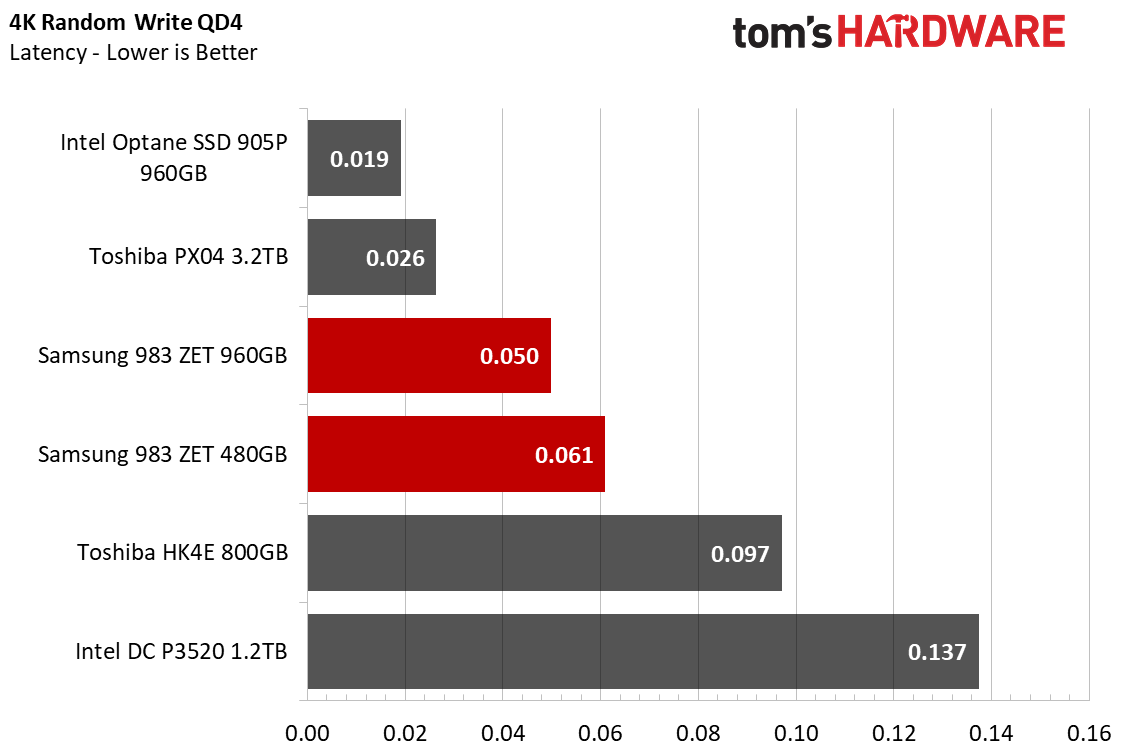
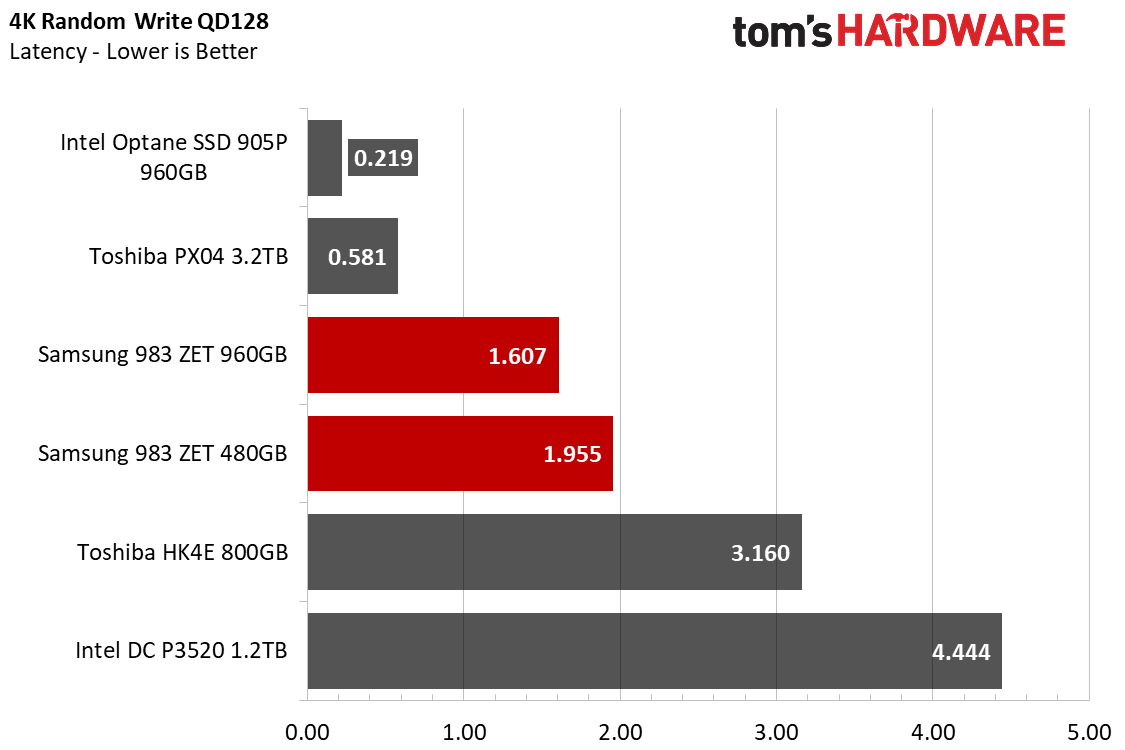
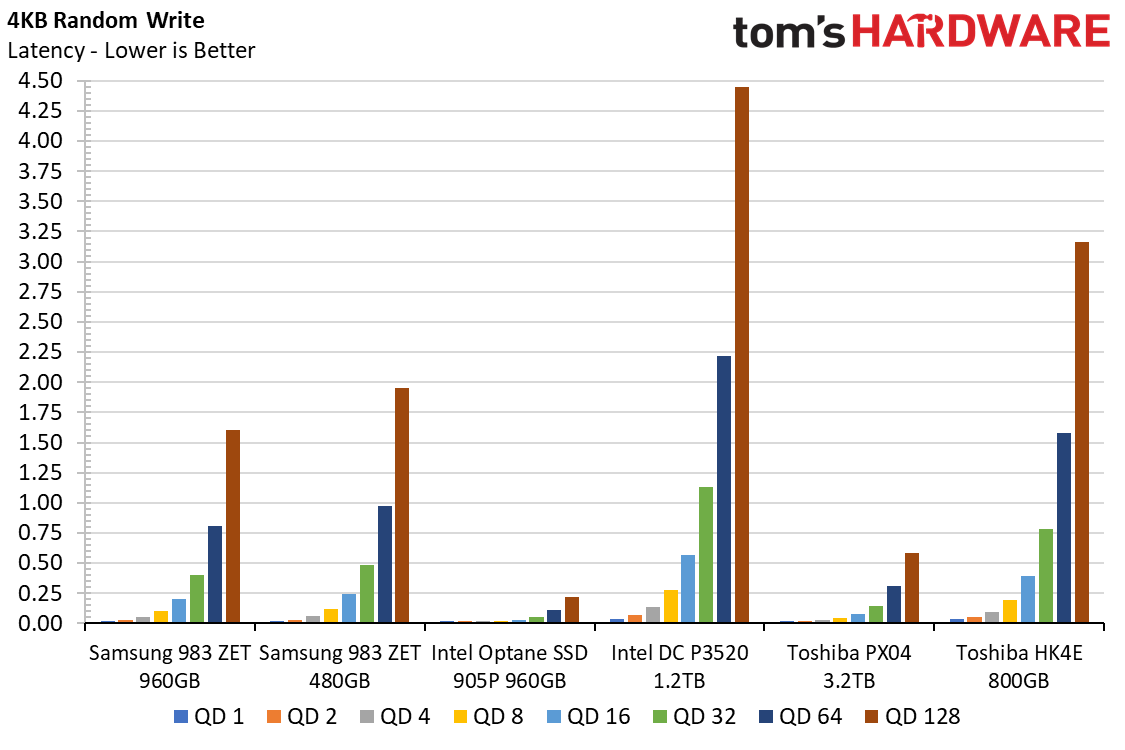
Additionally, random write latency is rated at 0.030ms, but we measured a more-impressive 0.023ms from the 480GB model and 0.024ms from the 960GB model. Scaling up to a QD of 4 adds a bit more latency than it did in reads, and at a QD of 128, the 983 ZET lags behind at 1.6-2ms while the 905P maintains ~0.2ms.
4KB Random Mixed Performance
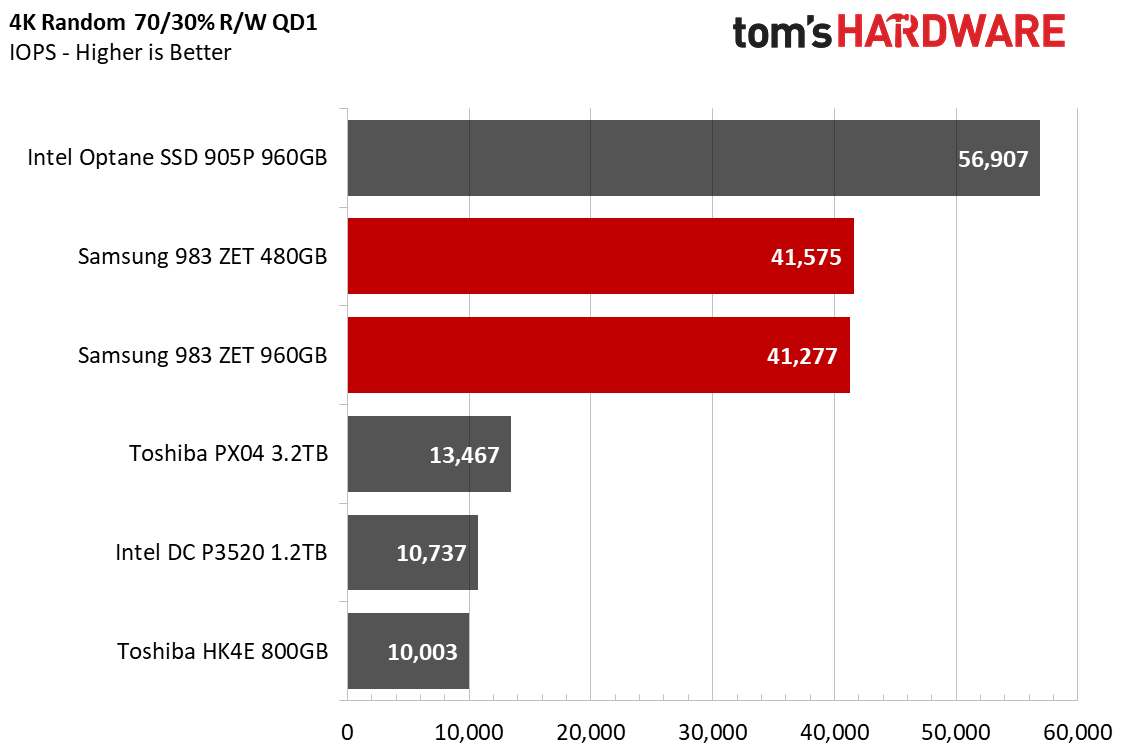
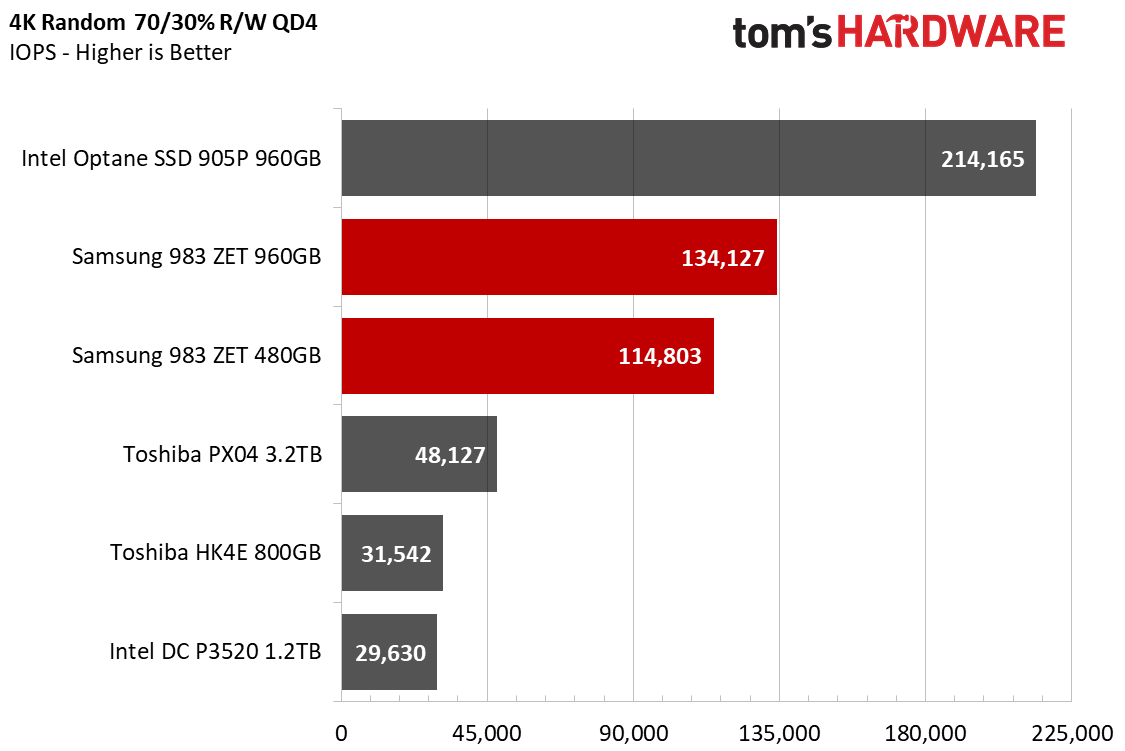
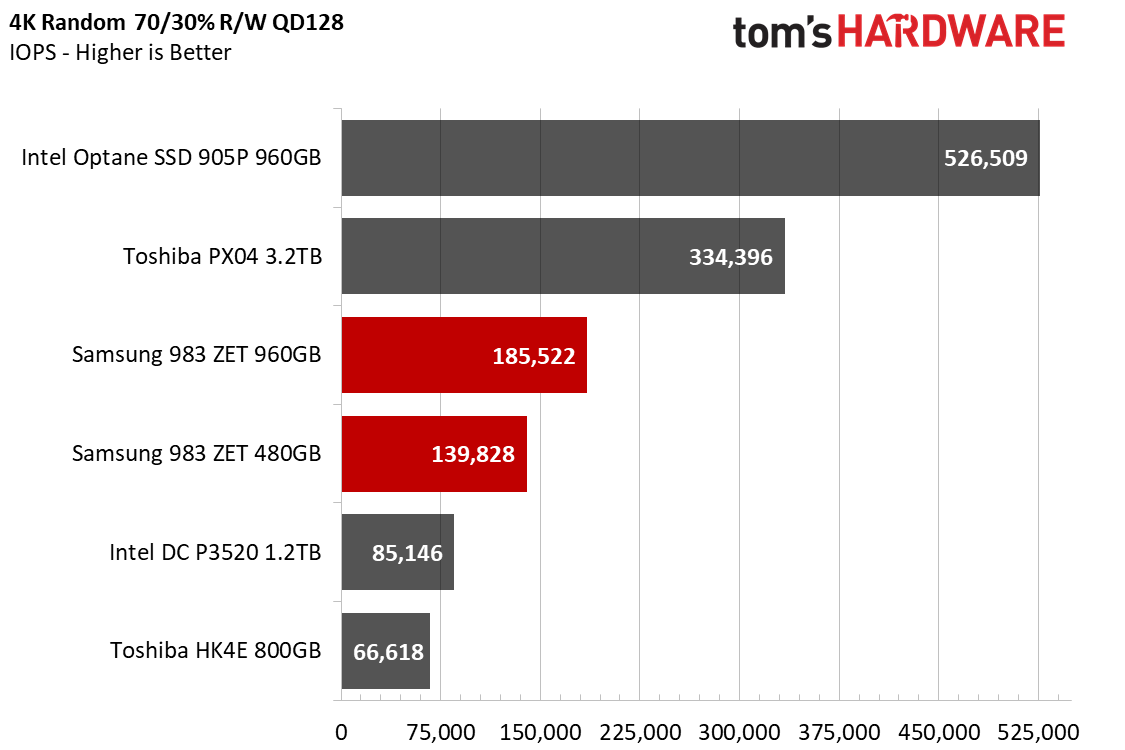
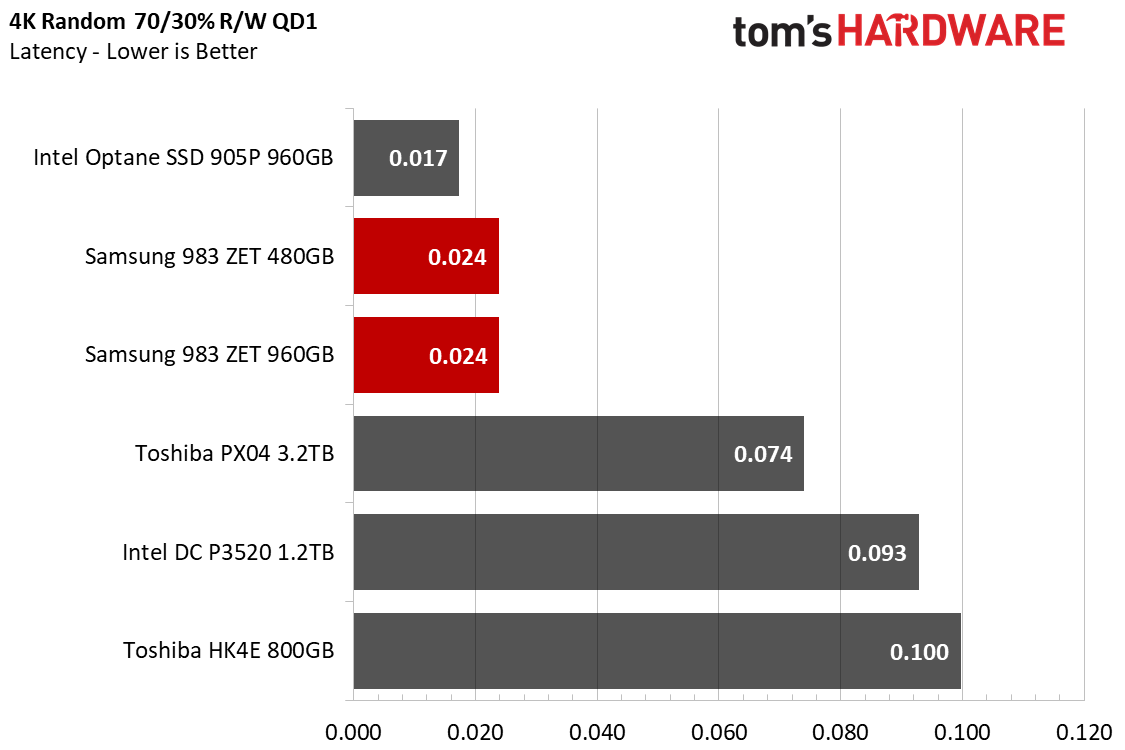
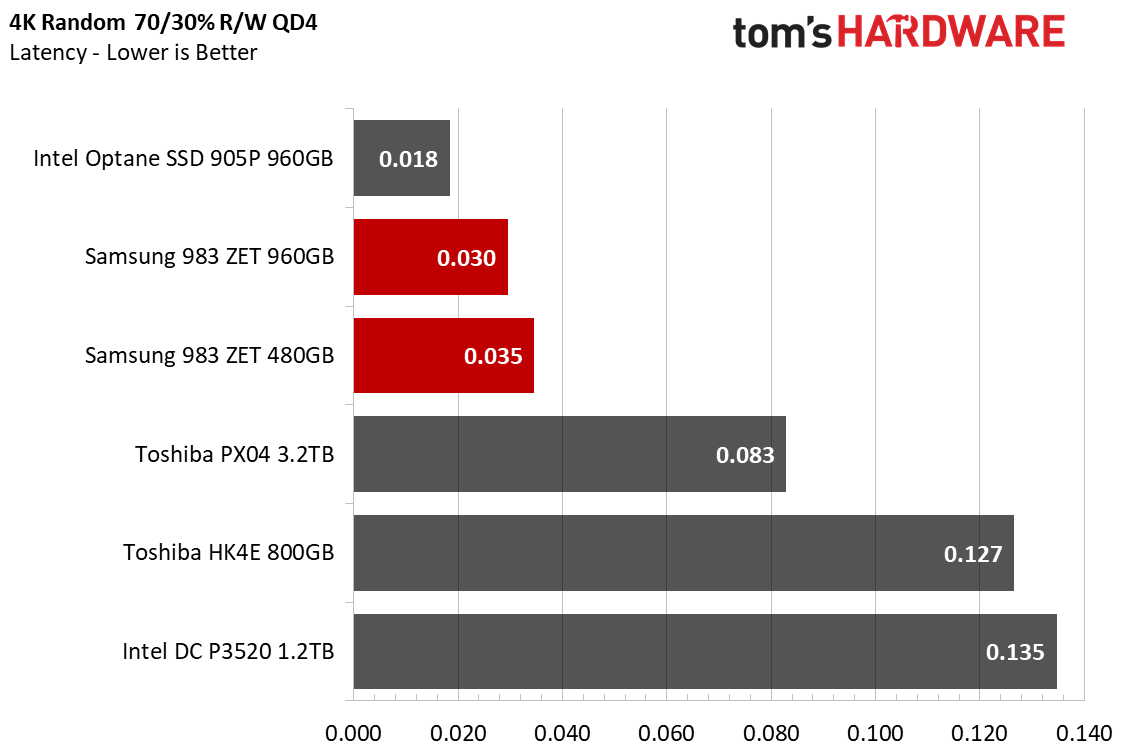
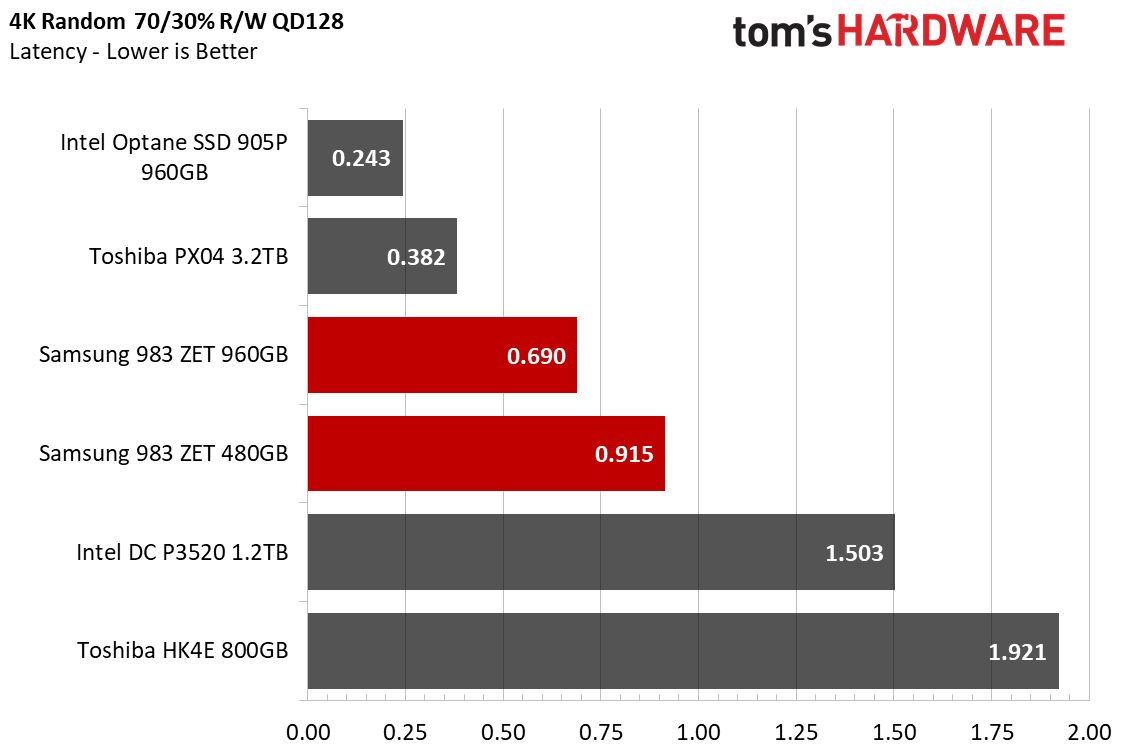
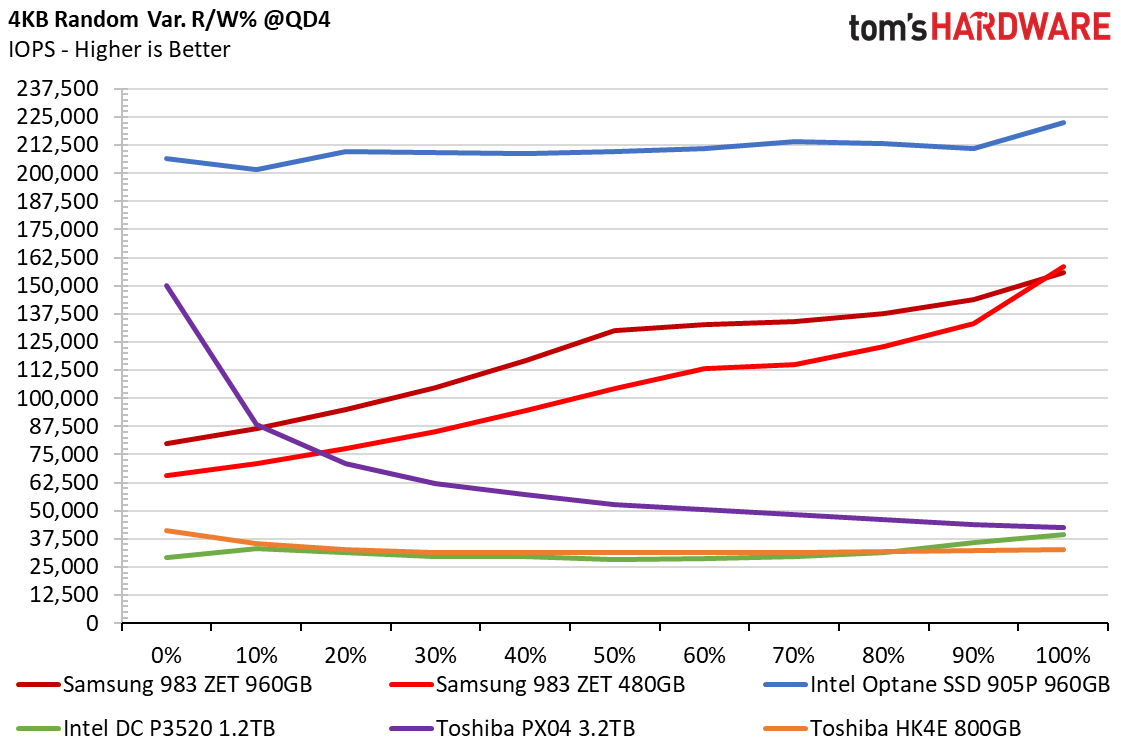
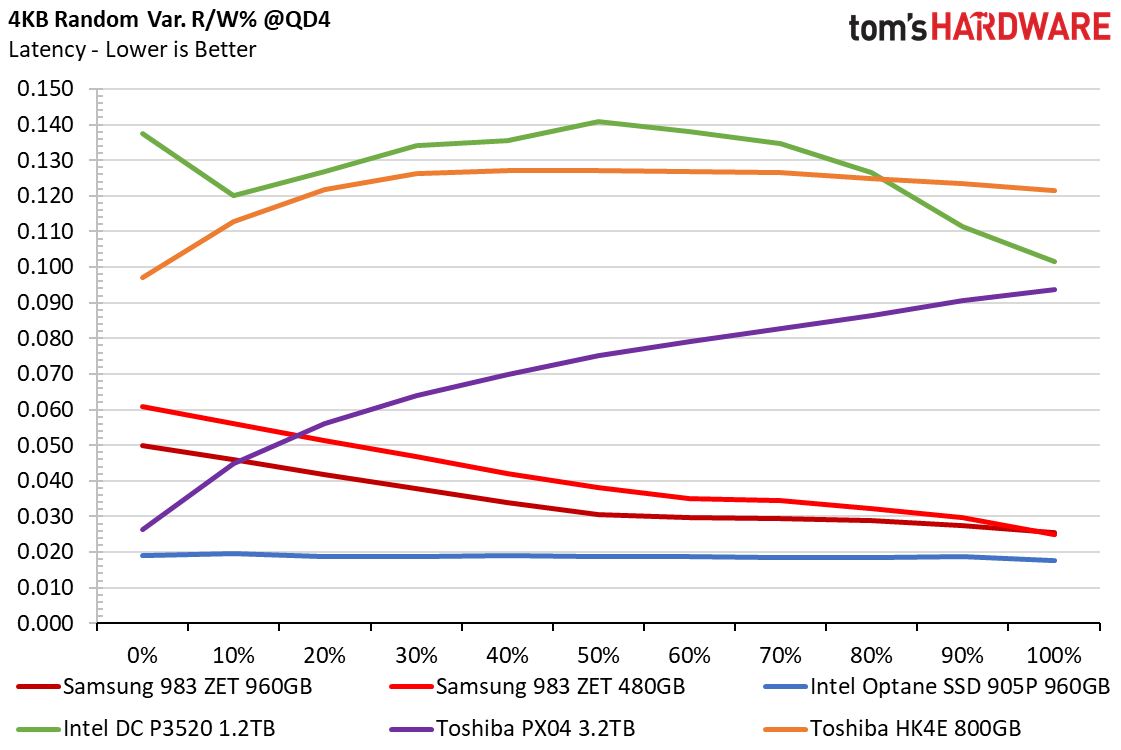
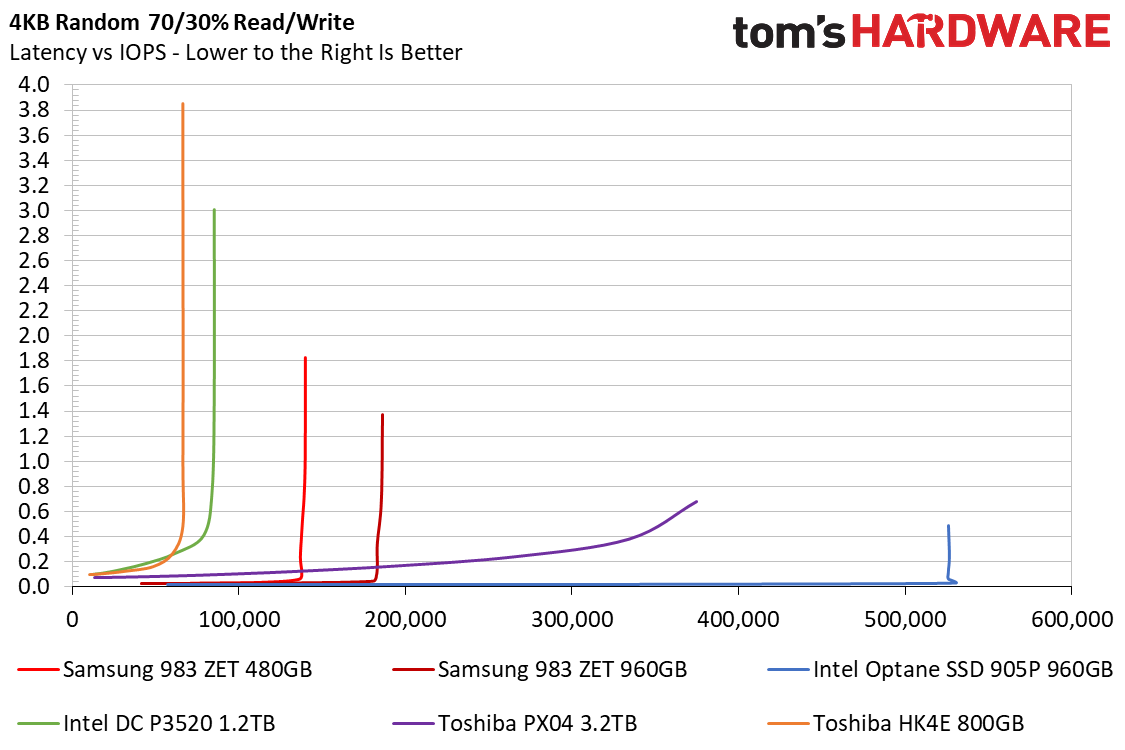
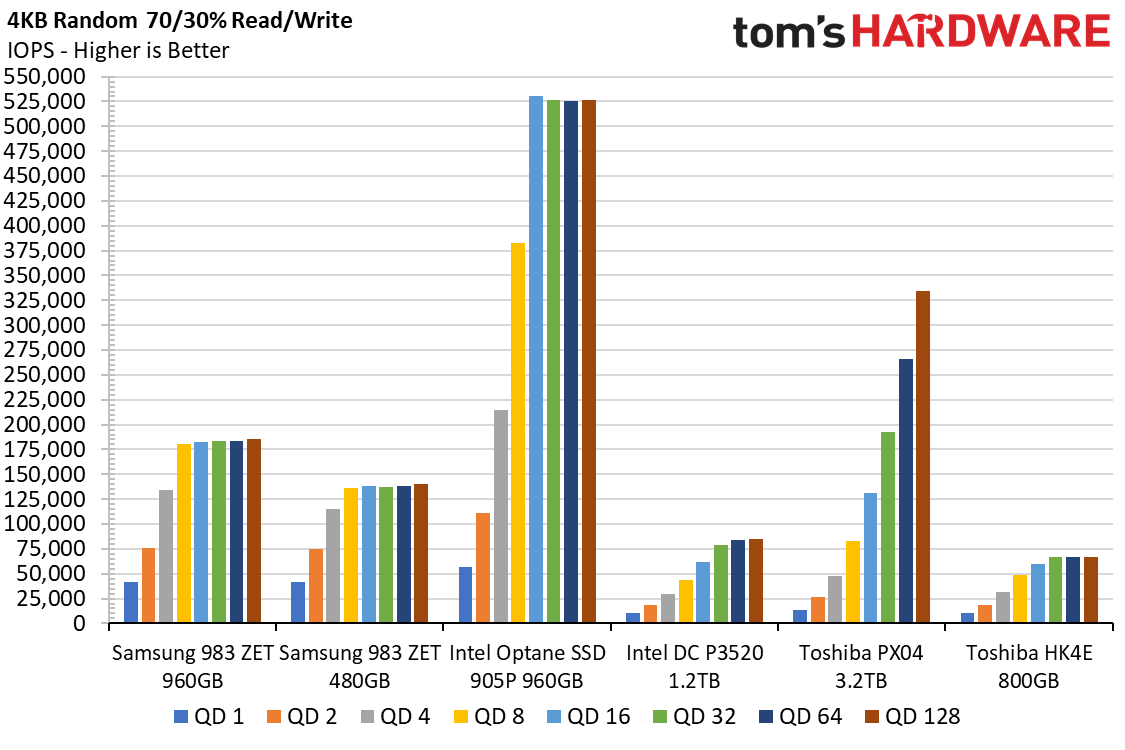
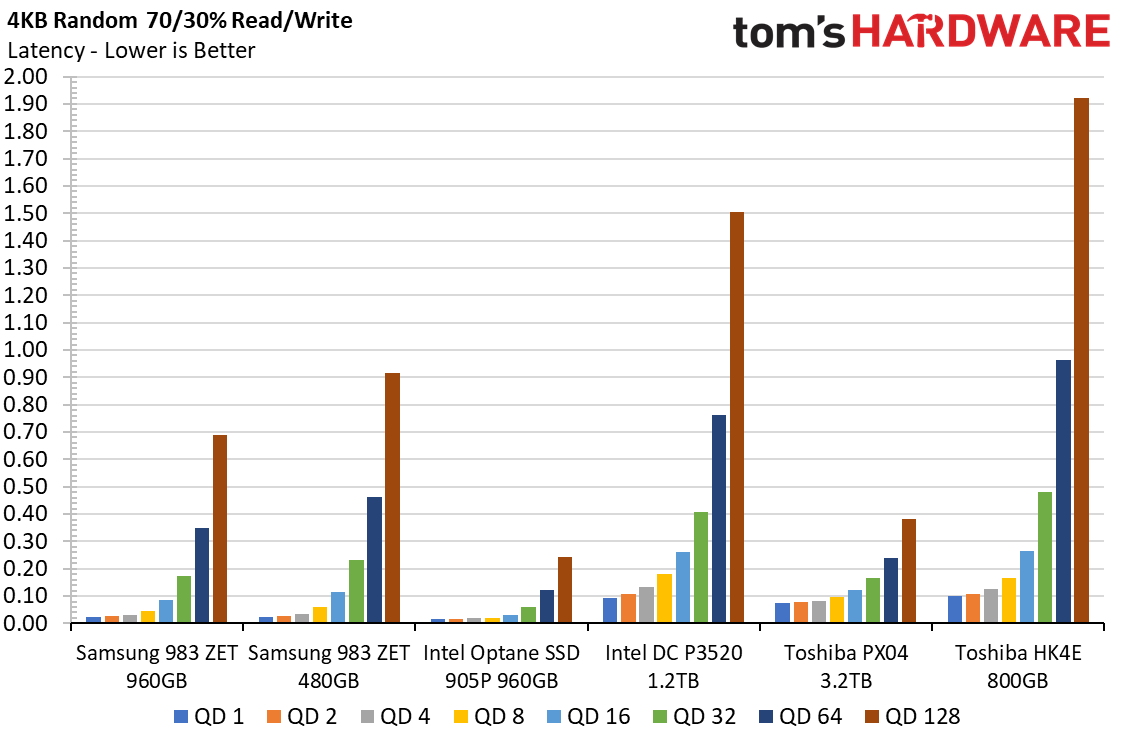
Similar to what we see with random write testing, the Toshiba PX04 can deliver much higher random performance than the 983 ZET (up to 334,000 IOPS in a 70/30% read/write mixture), but this comes at the cost of added latency at higher queue depths.
The 983 ZETs have restricted performance at higher queue depths, capping out at 185,000 IOPS from the 960GB model and 140,000 IOPS from the 480GB model, but nearly match Intel's Optane at lower queue depths. At QD 1, the 983 ZETs offer triple to quadruple the performance of the other flash-based SSDs, and again, display very tight latency profiles.
4KB Random Power Consumption
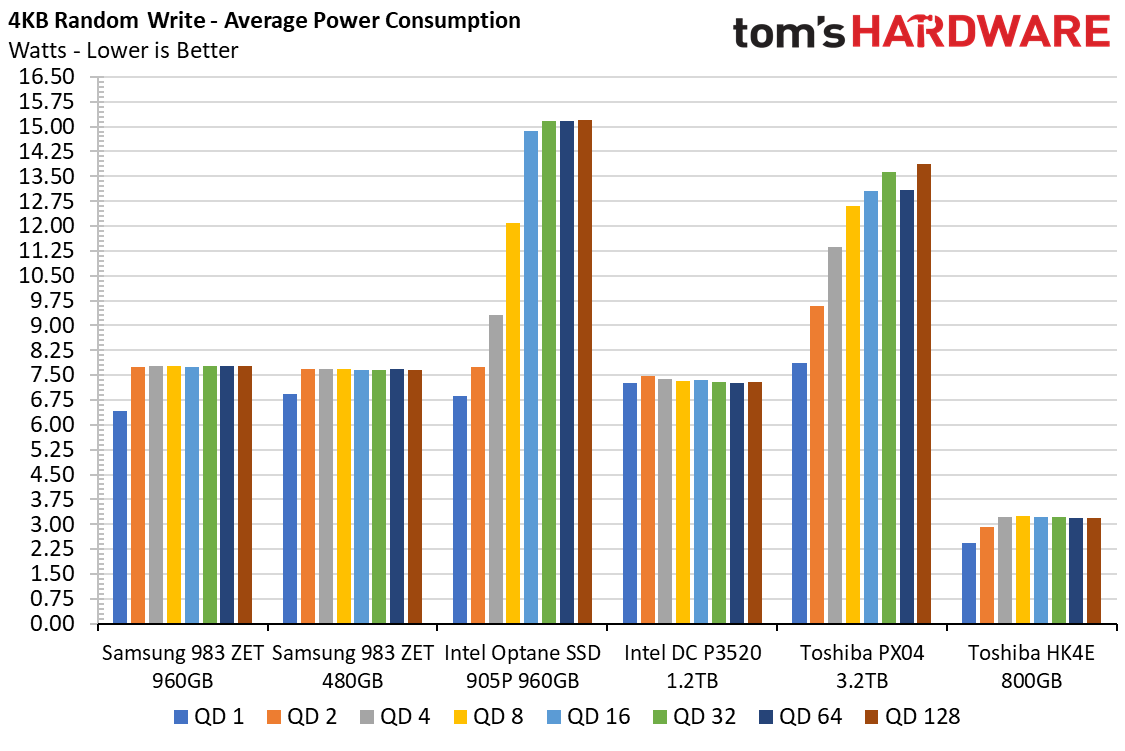
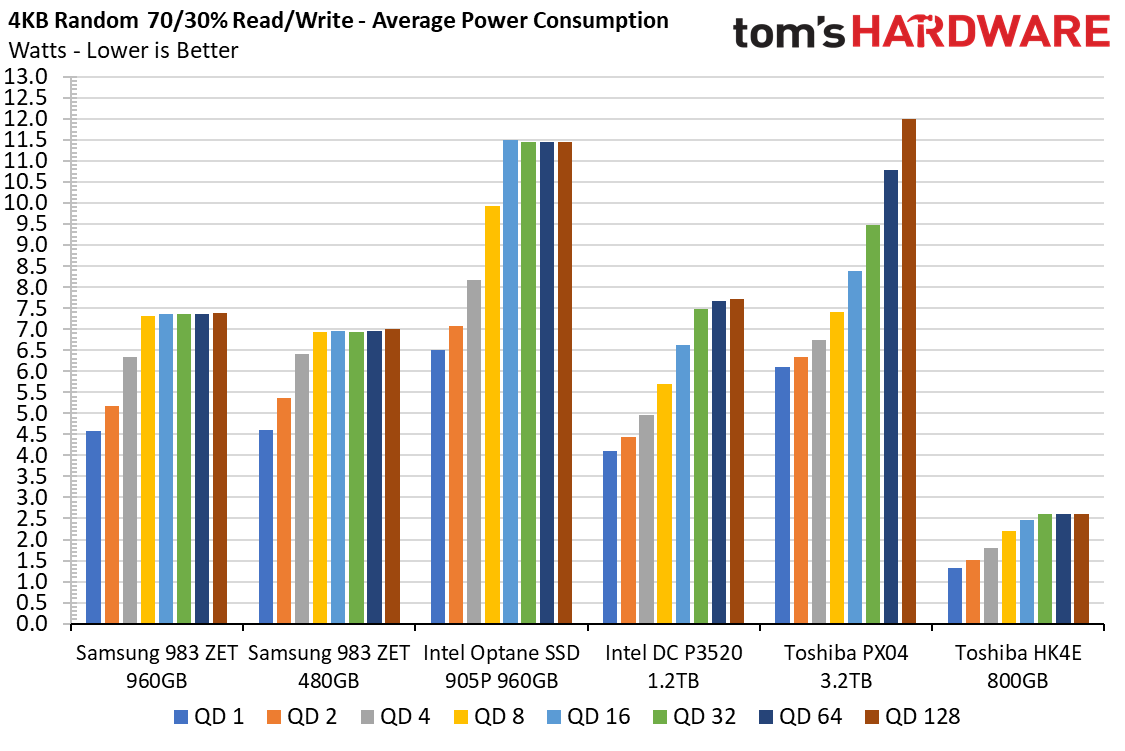
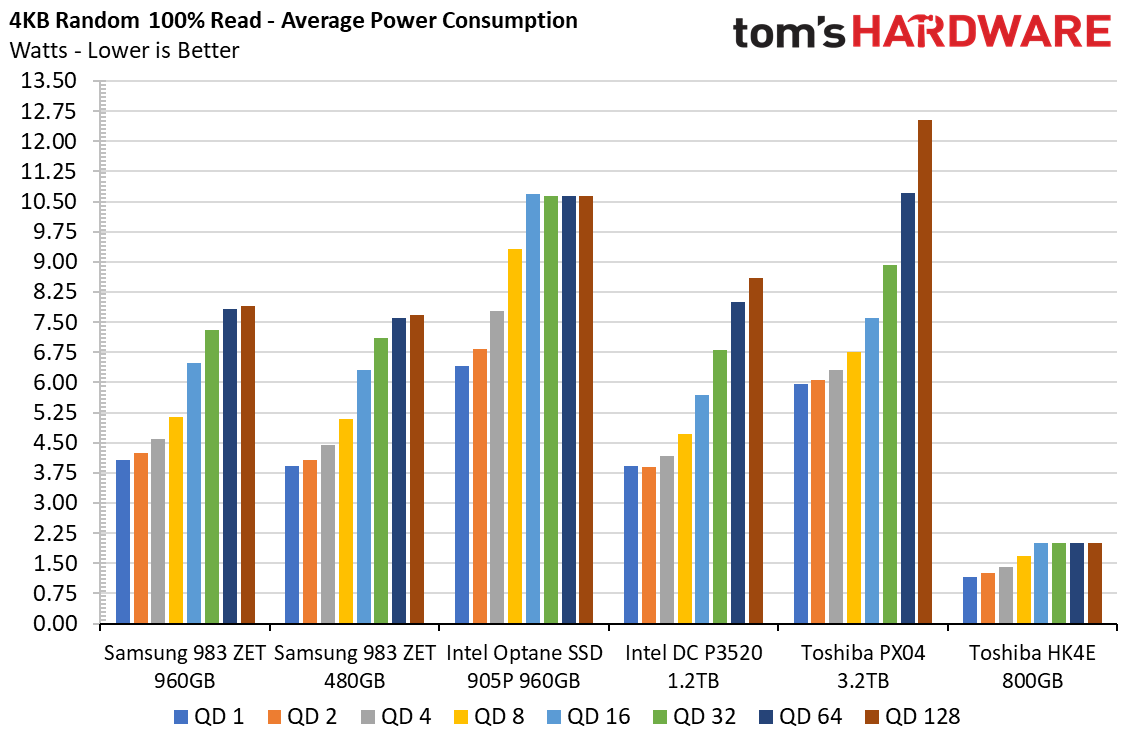
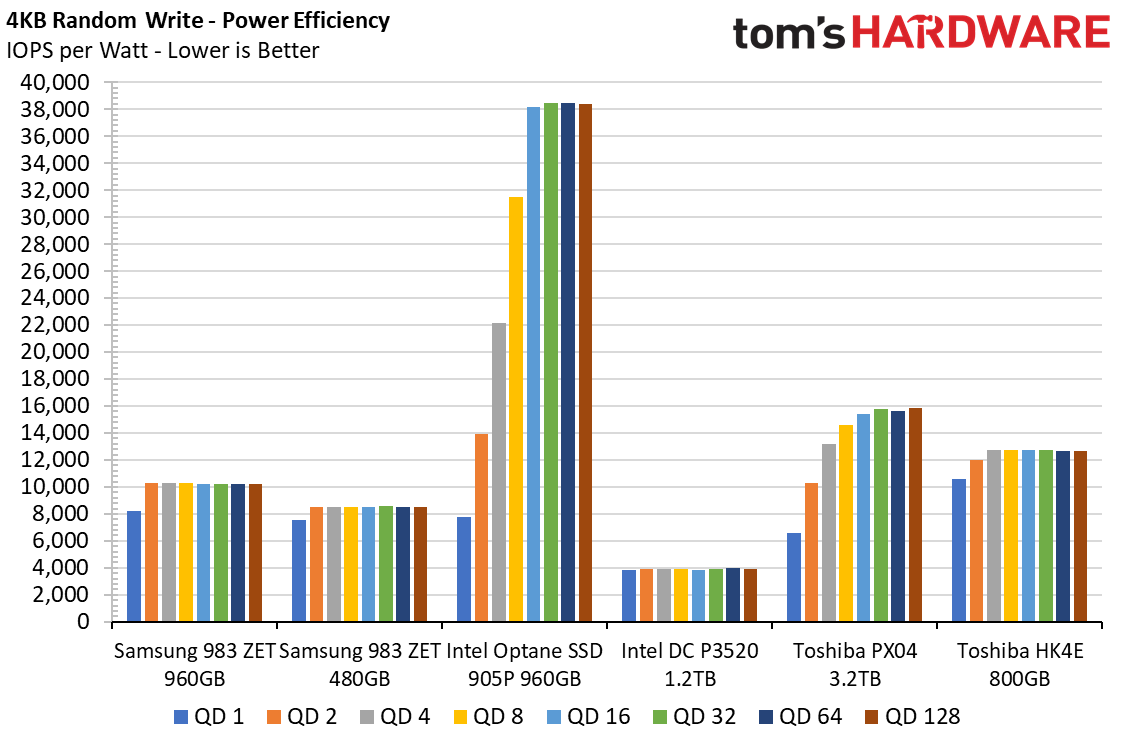
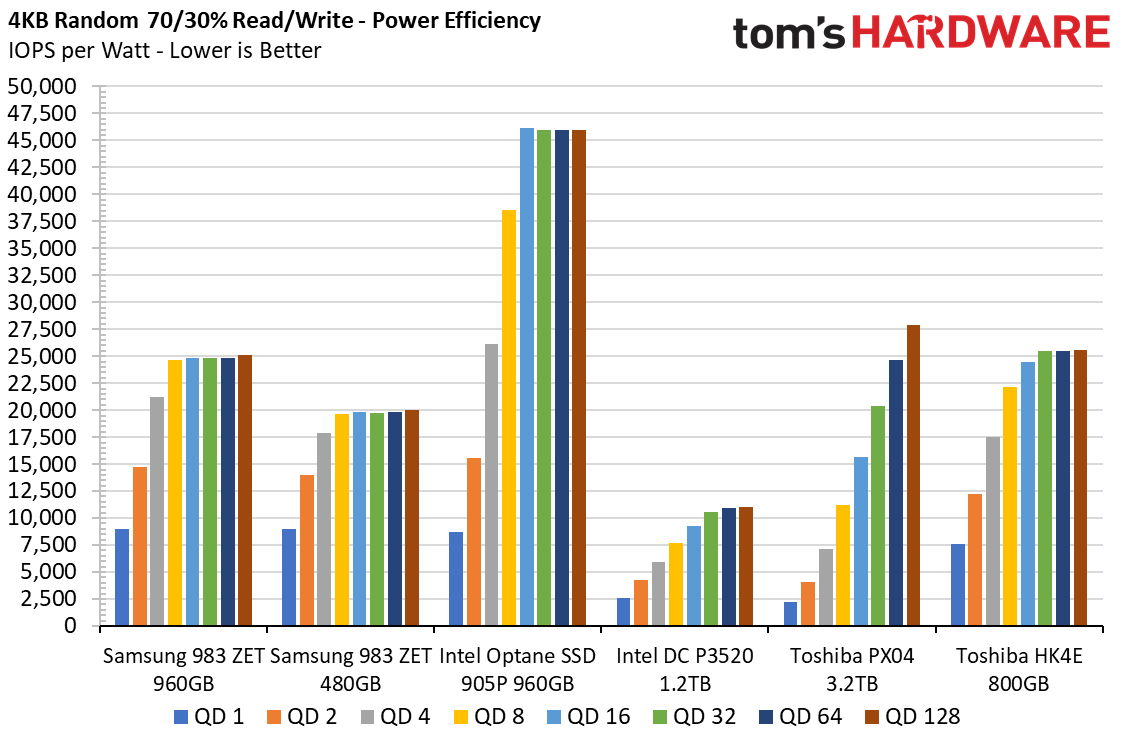
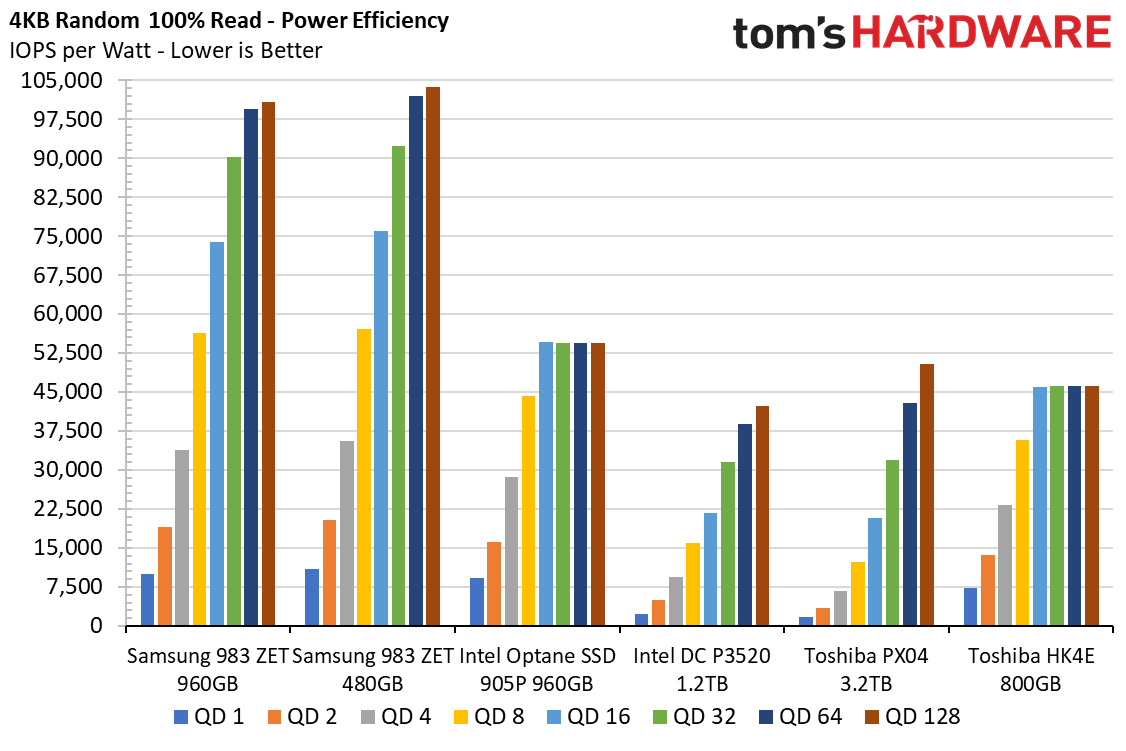
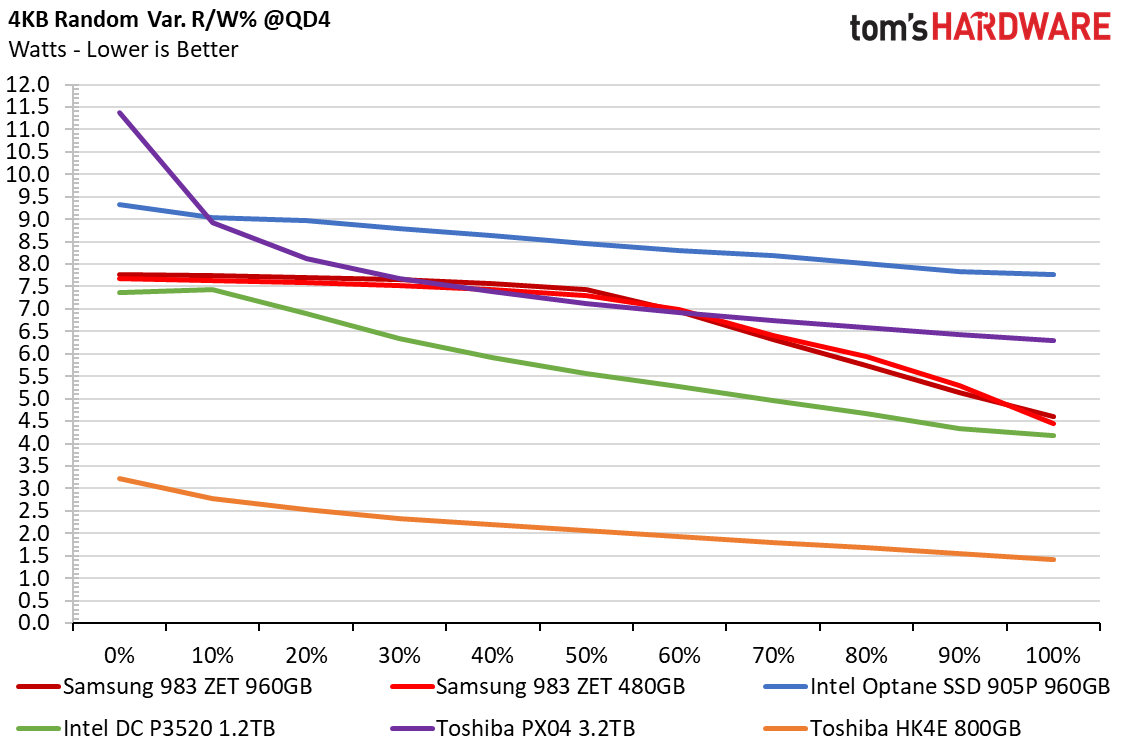
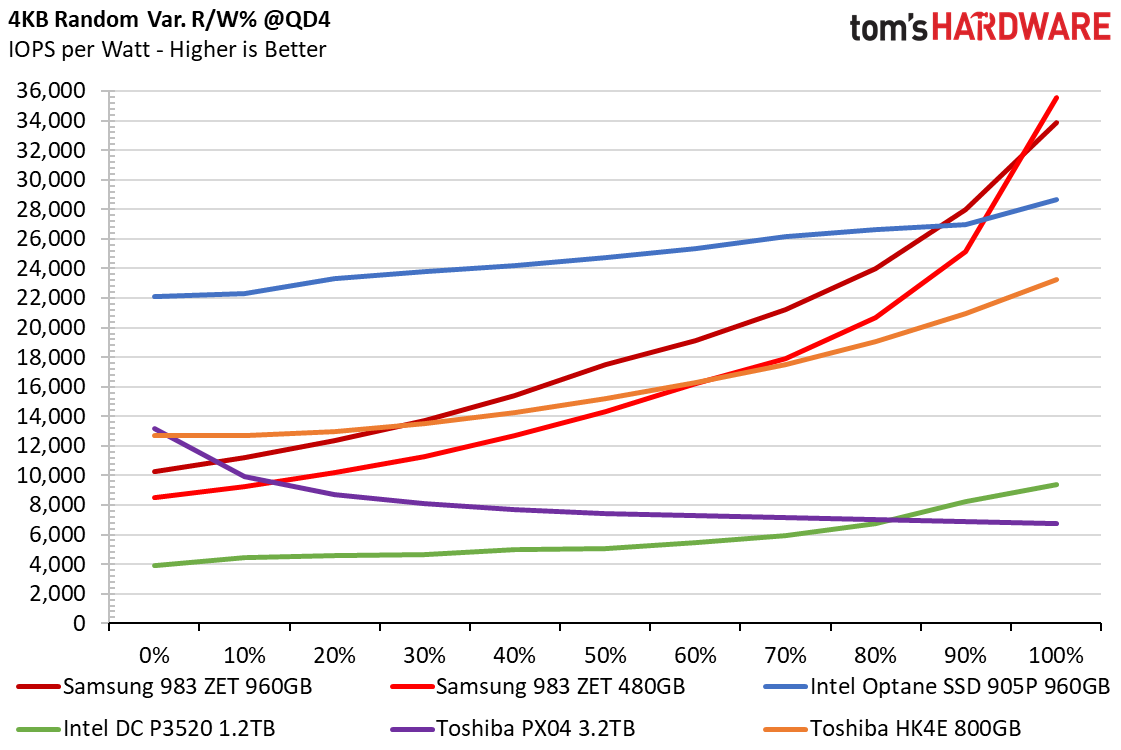
Whether it be during pure reads, writes, or mixed workloads, Samsung’s 983 ZET SSDs both consume similar amounts of power, around 7.5-8W on average, which is half that of the Intel Optane 905P.
Get Tom's Hardware's best news and in-depth reviews, straight to your inbox.
In terms of power efficiency, the 983 ZET has very high marks in pure read workloads and even surpasses the Intel 905P with almost double the efficiency. During mixed and pure write workloads, however, Intel’s Optane SSD 905P can’t be matched.
Latency Distribution and Consistency
When comparing enterprise and data center class storage, it is always important to not only make sure the product delivers the rated performance, but also to ensure it will deliver an excellent quality of service, or in other words, consistent performance. There are multiple ways to measure consistency, but we display it on a scale from 0-100% by taking the lowest IOPS result and dividing it by the average. We used results at a QD of 4 from 100% write, 70/30% read/write, and 100% read tests.
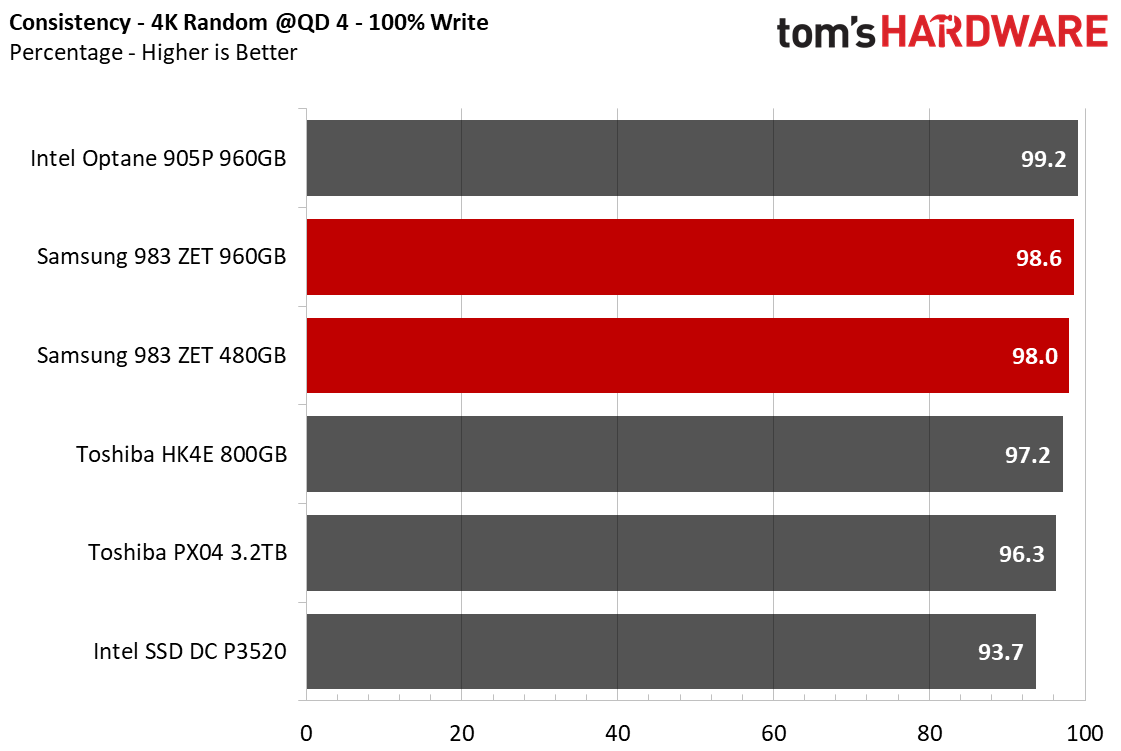
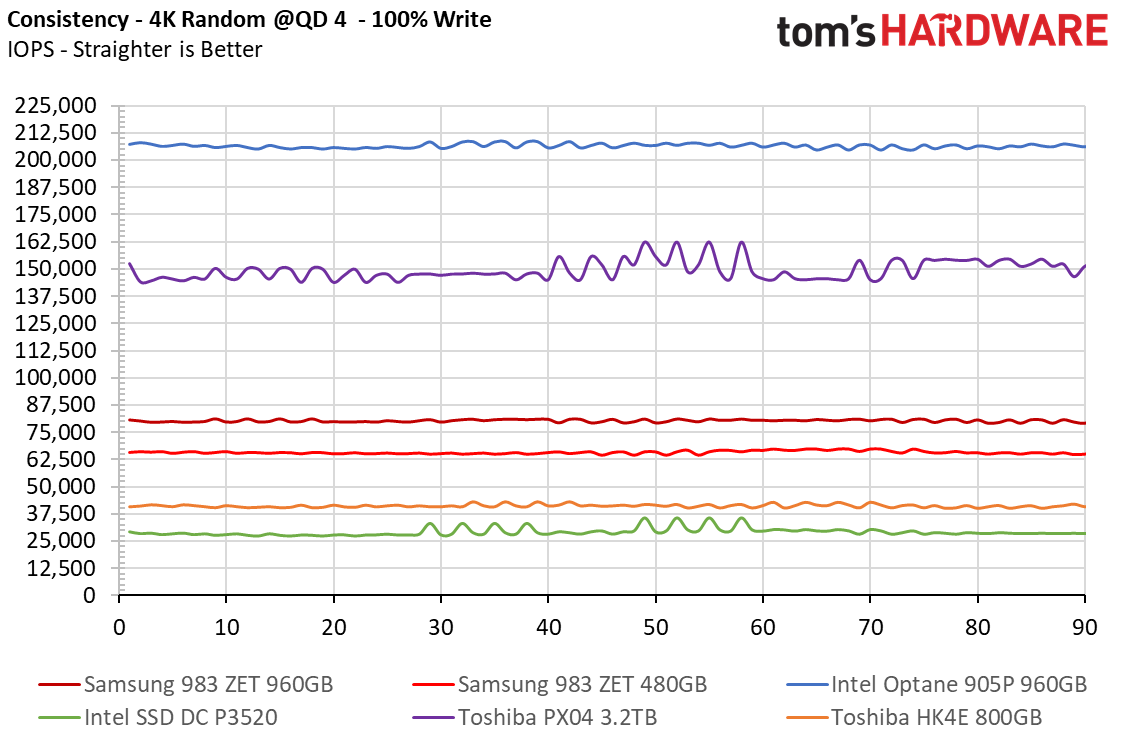
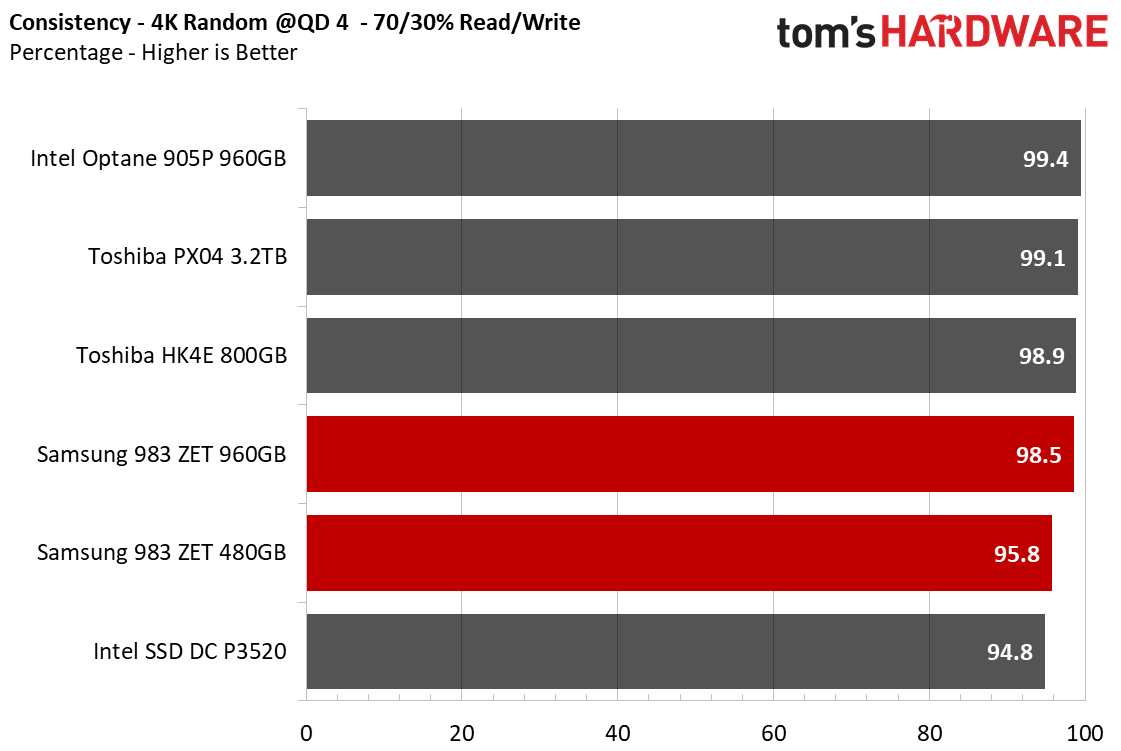
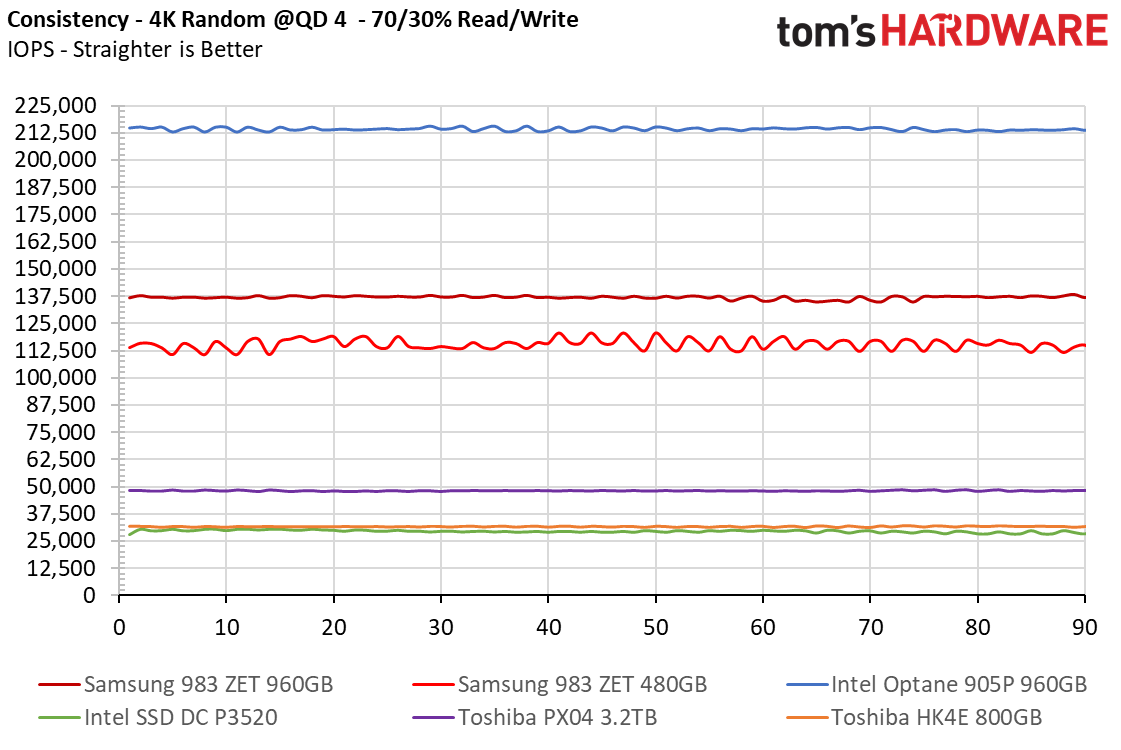
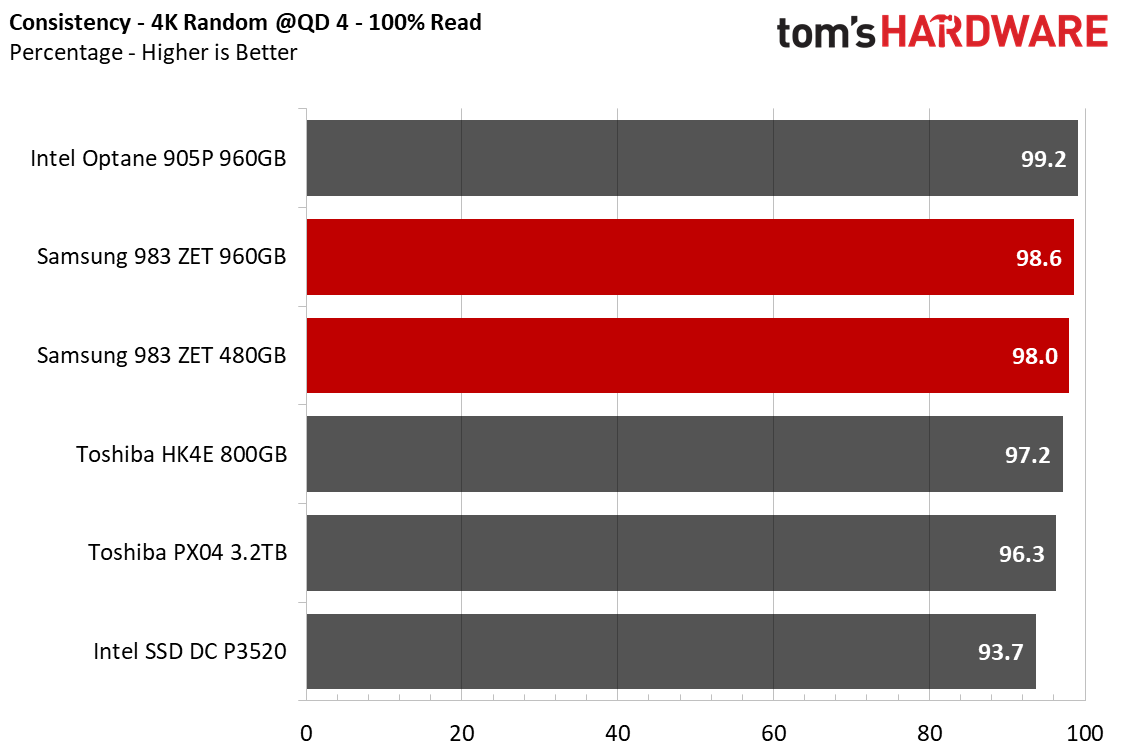
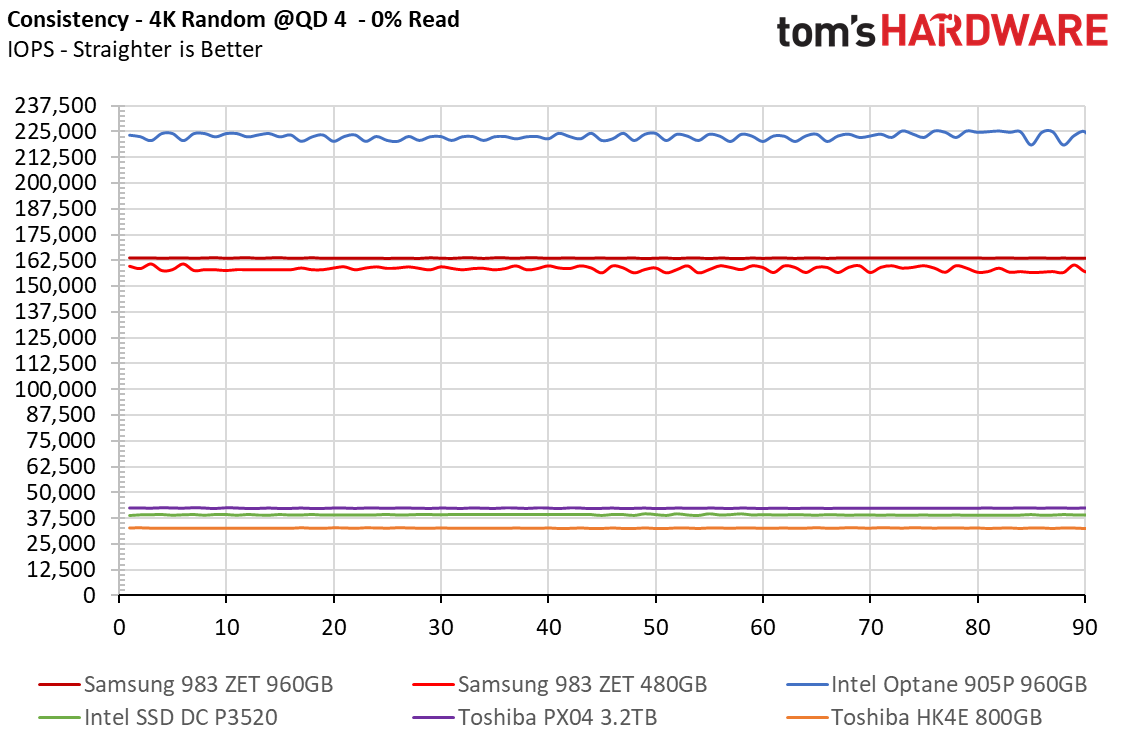
In both random read and write workloads, Samsung’s 983 ZET delivers very consistent performance, with results ranging from 98-98.6%. During mixed workloads, the 480GB 983 ZET proves to be a bit more inconsistent with a result of 95.8% while the 960GB model maintains 98.5% consistency.
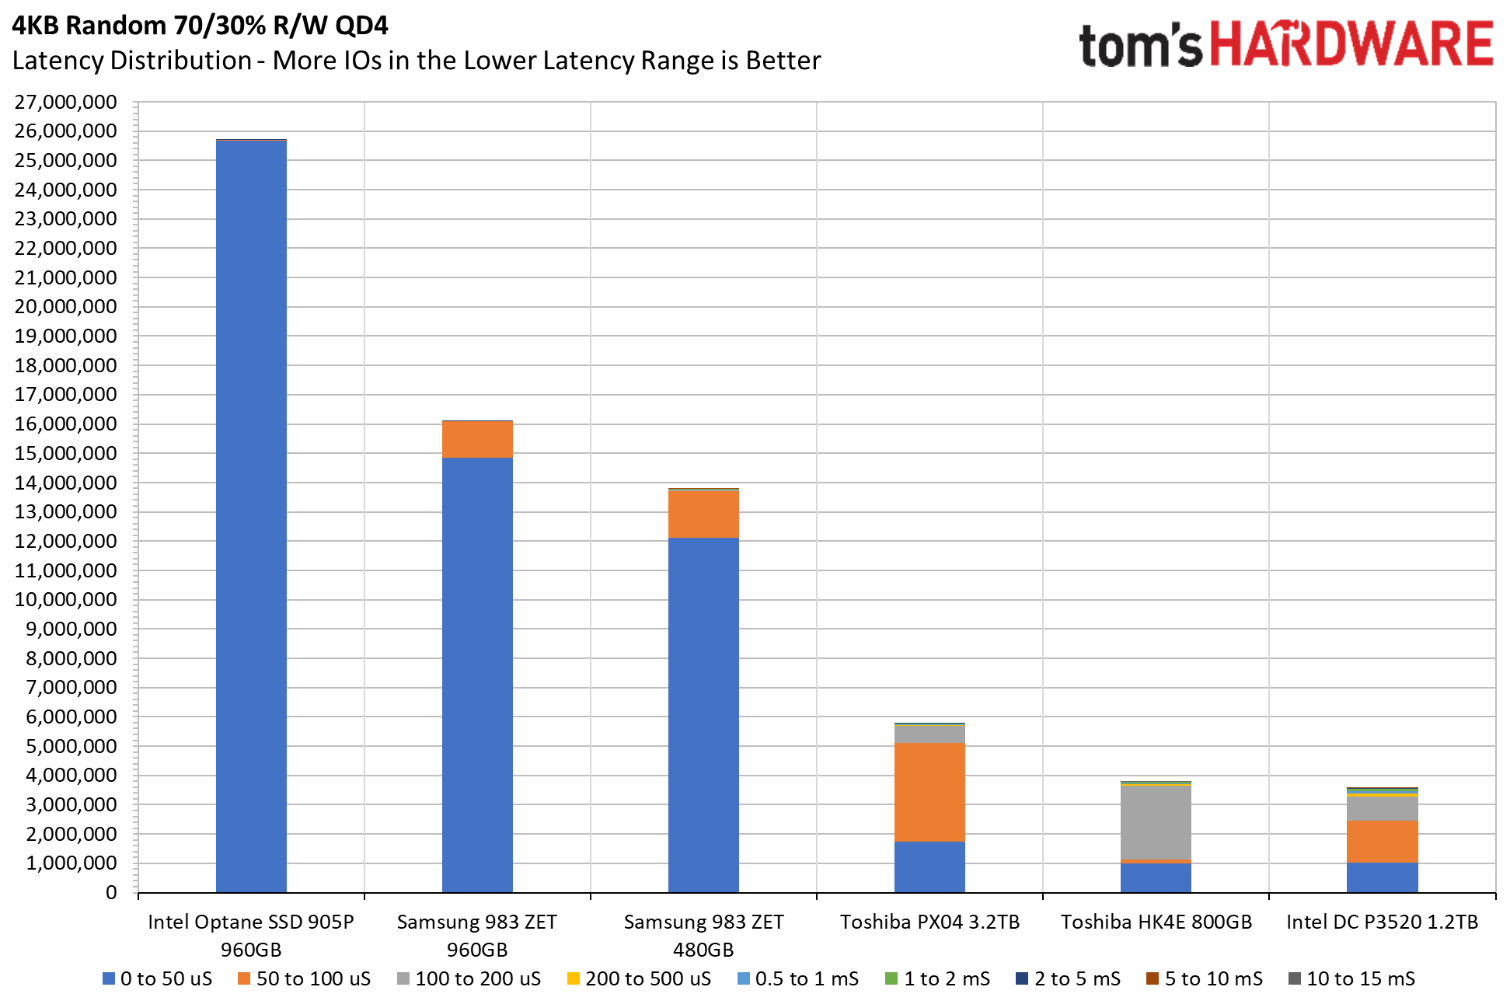
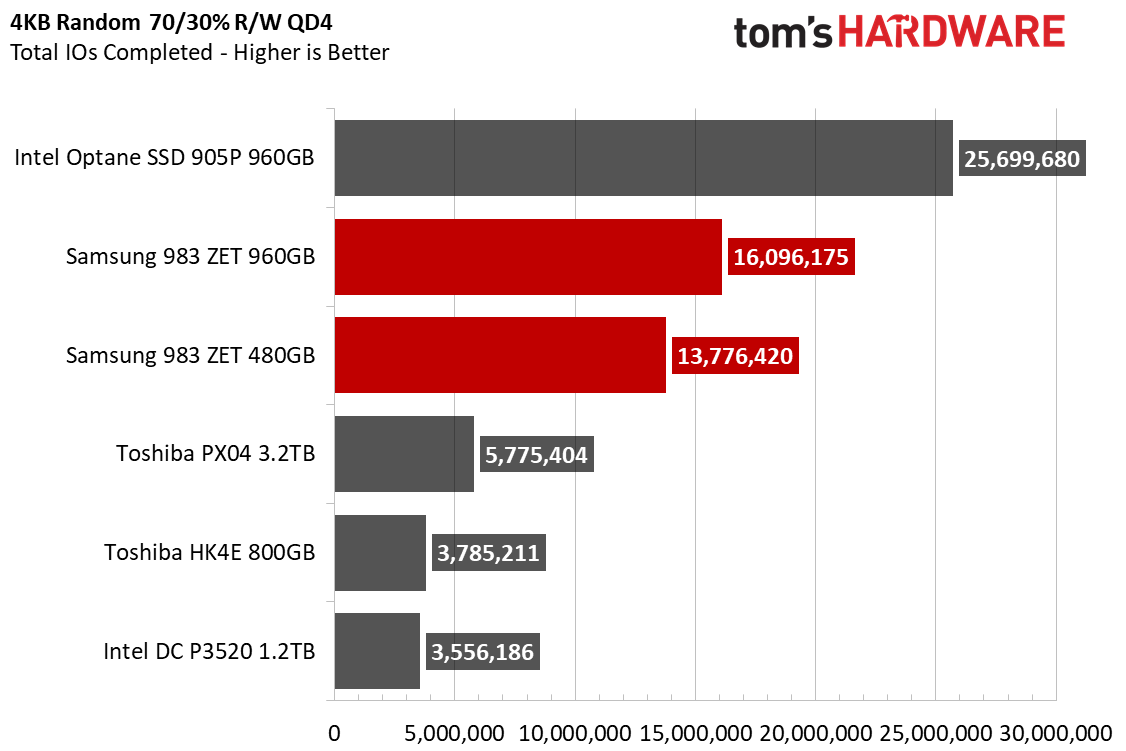
This is also an appropriate time to examine the latency distribution of the multiple SSDs and interfaces we have in our comparison pool. Ideally, the fastest drives will have most of their latency results fall into lower brackets and will have completed more IOs overall.
The Intel 905P just can’t be touched. Out of nearly 26 million IOs, most of them landed in the 0-50us range. The Samsung 983 ZETs are no slouch, though. Even during a mixed workload, which has proved tough for them in the past, the 480GB model completed nearly 14 million IOs while the 960GB model churned out just over 16 million. These results show how much faster the drives are than conventional MLC or TLC SSDs. Most of their latency distribution lands in the 0-50ms range, while the other SSDs mostly land in the 50-200ms range and have many more outliers.
MORE: Best SSDs
MORE: How We Test HDDs And SSDs
MORE: All SSD Content

Sean is a Contributing Editor at Tom’s Hardware US, covering storage hardware.
