Supermicro C7X99-OCE ATX Motherboard Review
Can Supermicro deliver its legendary server-component reliability with the overclocking features we’ve grown to love? We gauge the company’s progress in its third generation of enthusiast-oriented motherboards.
Why you can trust Tom's Hardware
Results: Benchmarks, Efficiency And Overclocking
Hardware and software settings carried over from our initial round-up allow me to compare the performance of every tested X99 motherboard to the most recent products. Charts include the three most similarly-priced competitors.
3DMark And PCMark
We haven’t seen significant attempts to game the review system in recent years, which would be indicated by noticeable increases in basic benchmark performance. That’s good, since those types of events previously triggered lengthy investigations into clock speed manipulation. Everyone can overclock, and overclockers prefer to use their own settings.
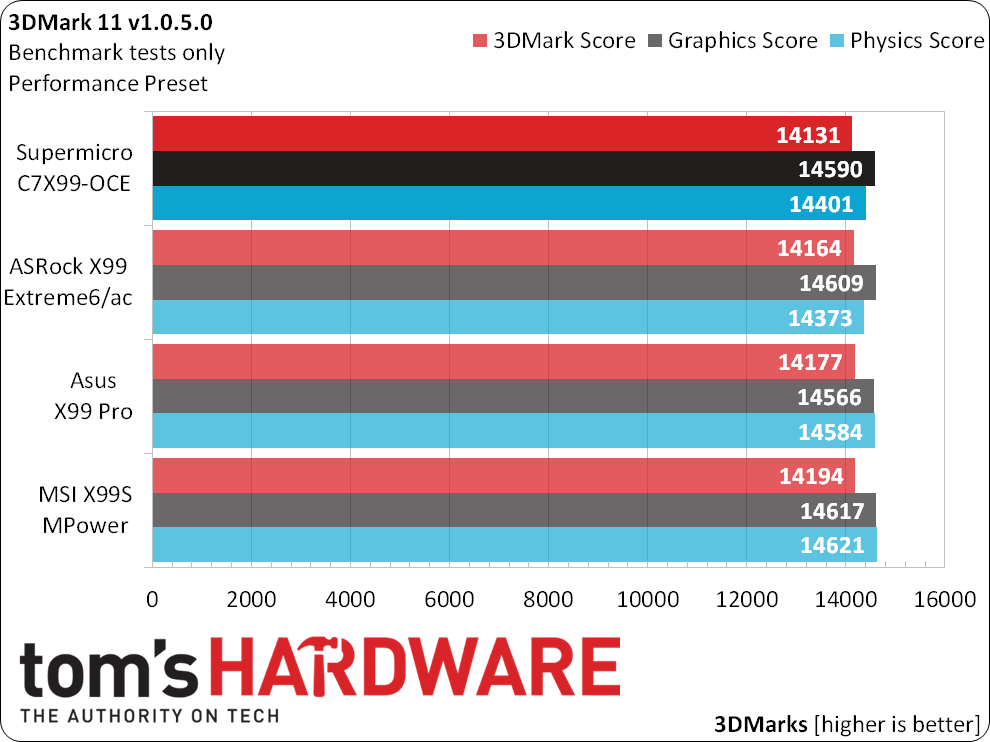
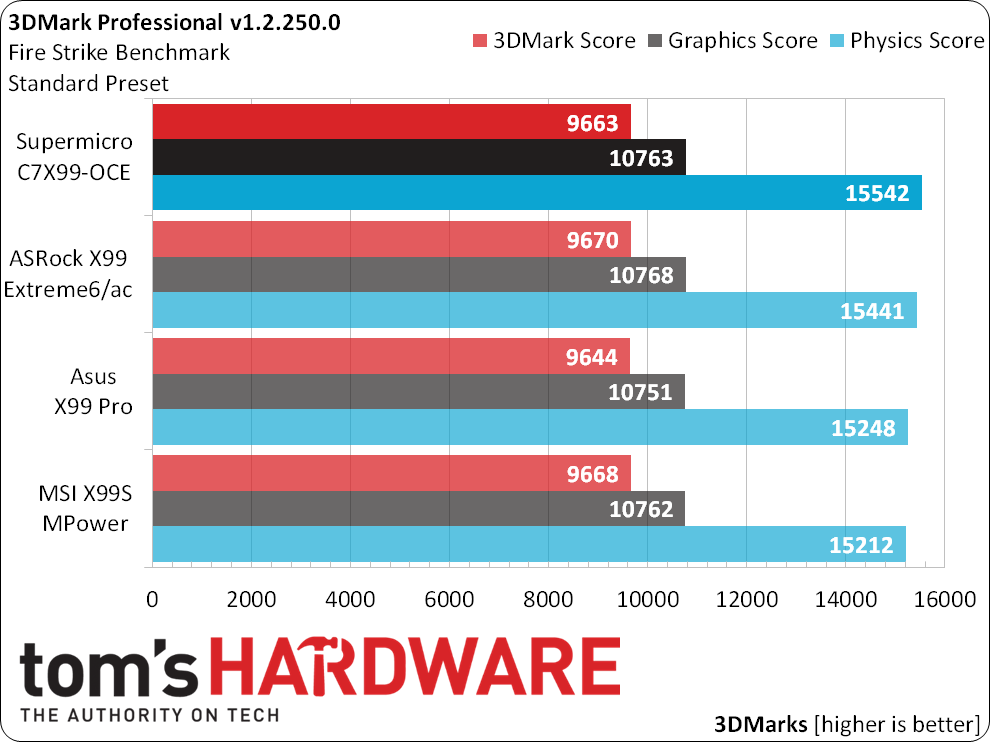
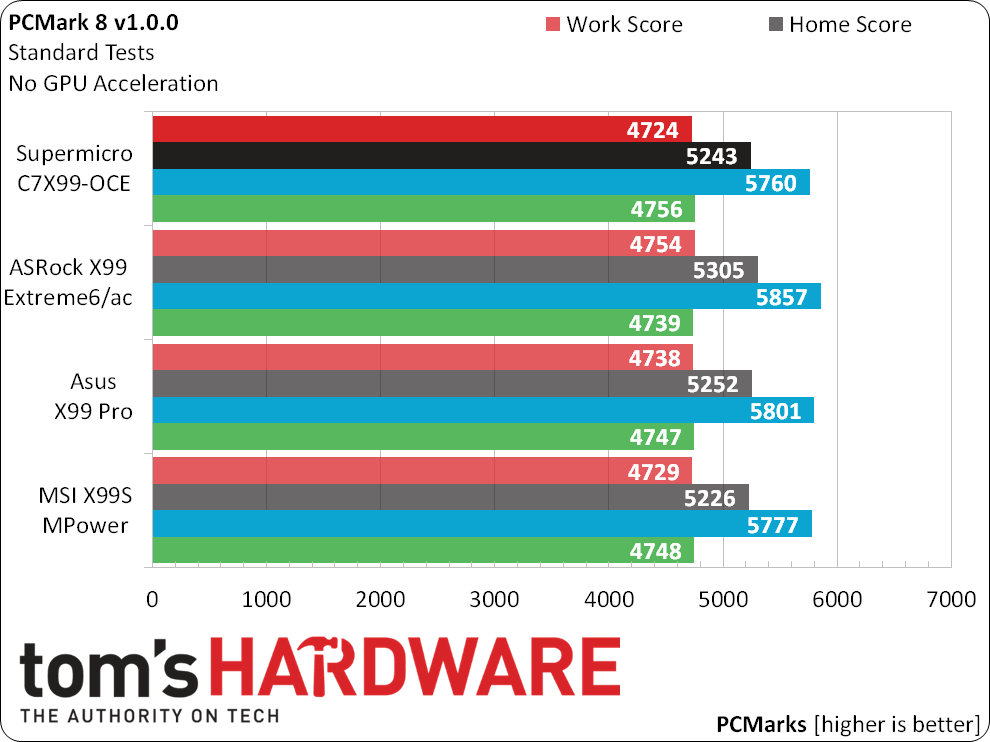
3DMark and PCMark show all four boards producing similar performance. No cheating here.
SiSoftware Sandra
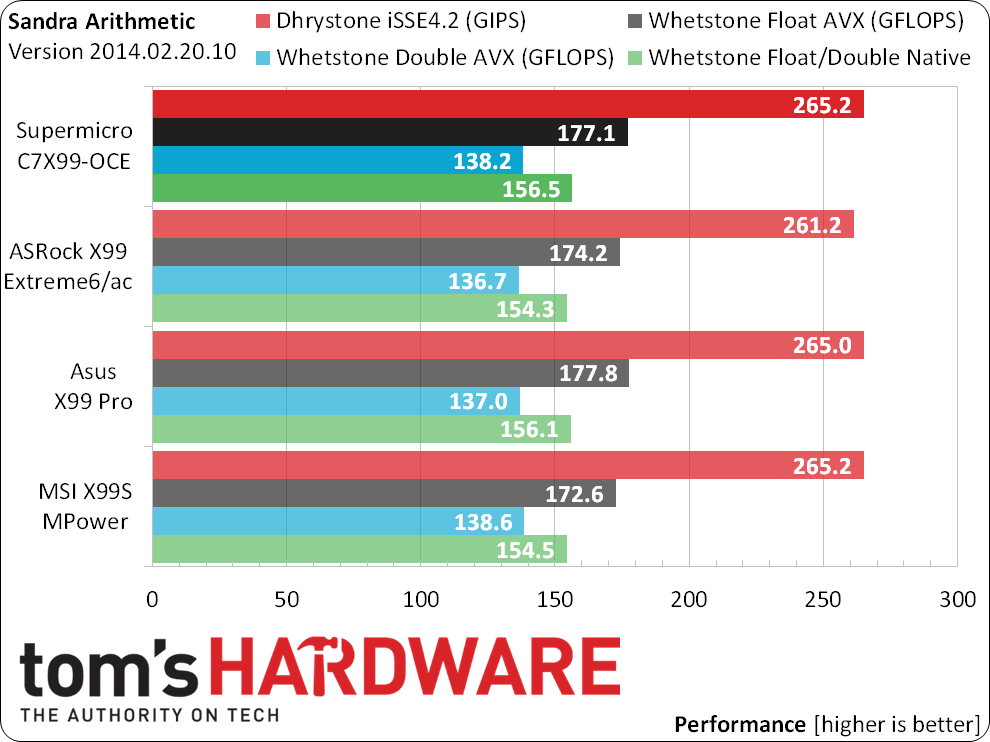
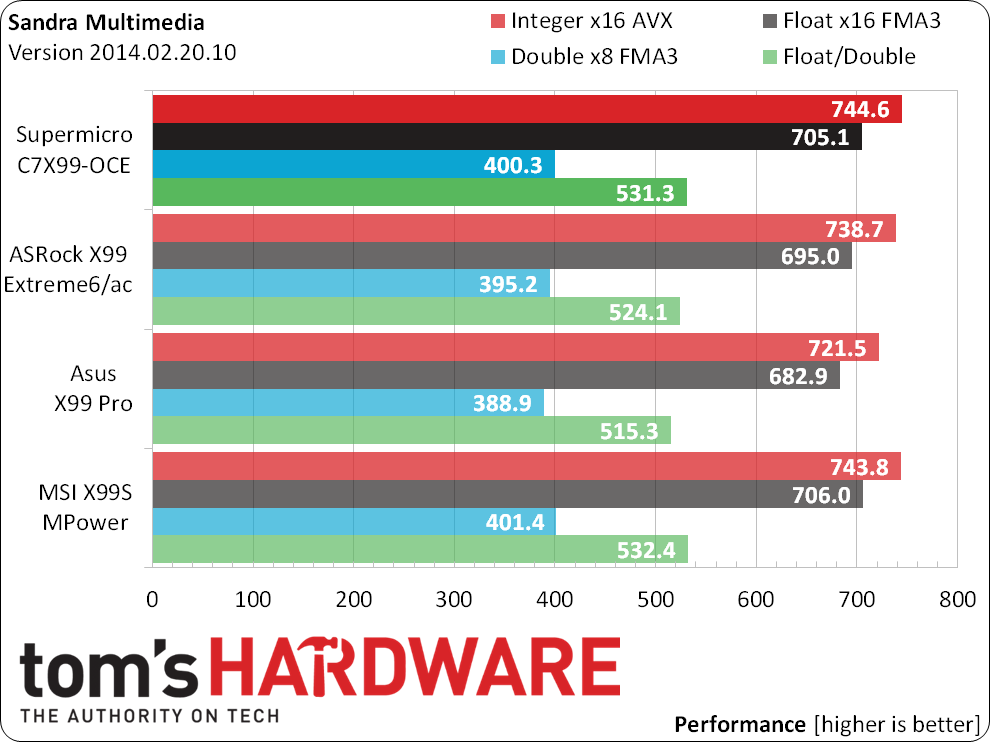
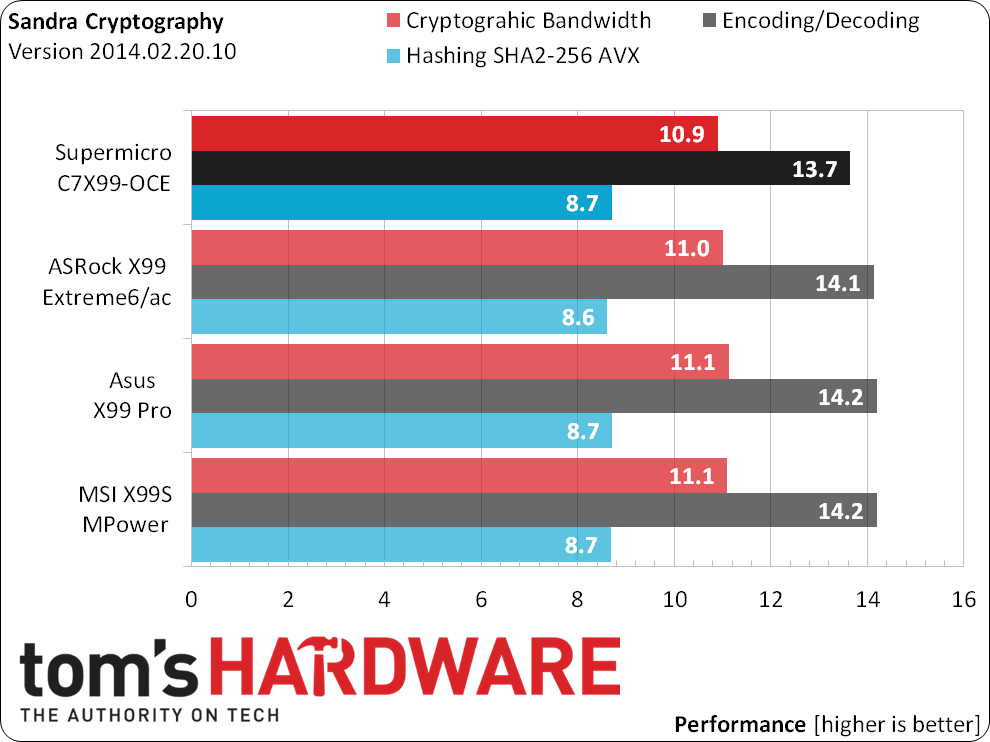
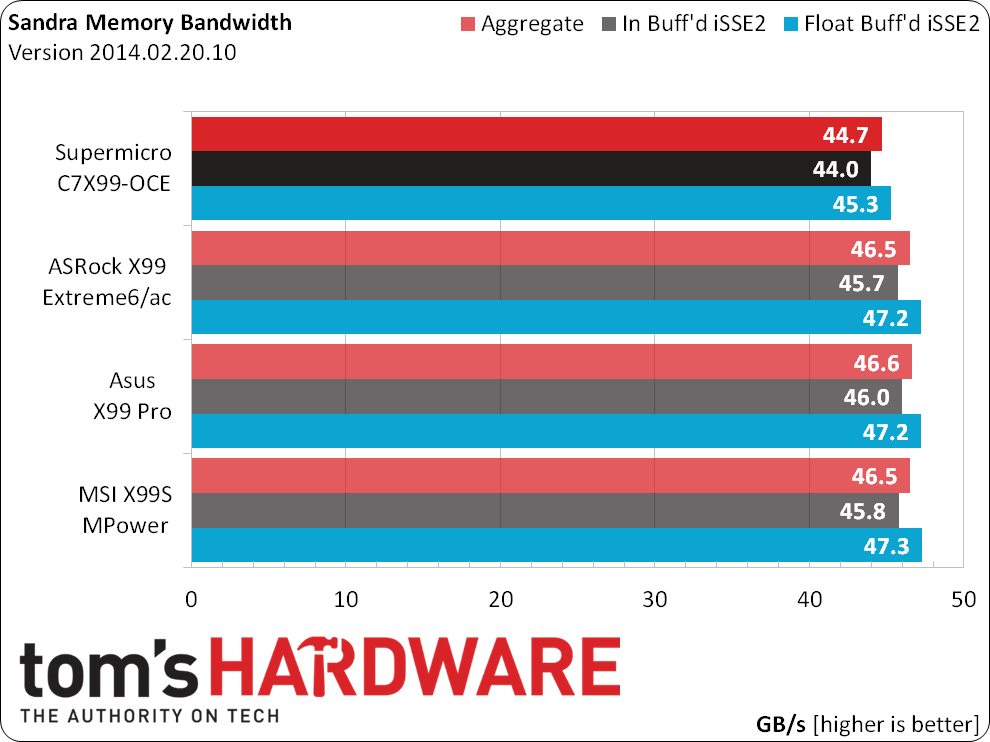
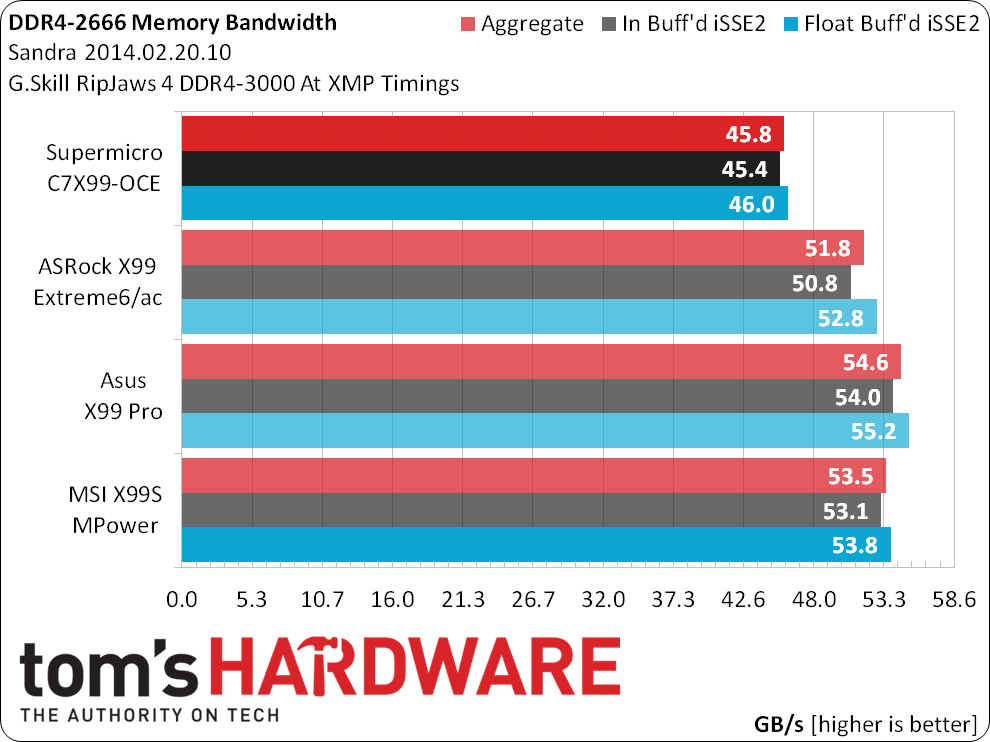
Memory performance is one place motherboard manufacturers can still affect performance a little without overtly cheating, since certain advanced timings are based on other memory/motherboard factors and not programmed onto the module. Tighter timings tend to produce higher bandwidth scores, while looser timings lend themselves to additional stability. Supermicro appears to choose stability, as inferred by its slightly lower Sandra Bandwidth and Encoding/Decoding scores.
3D Games
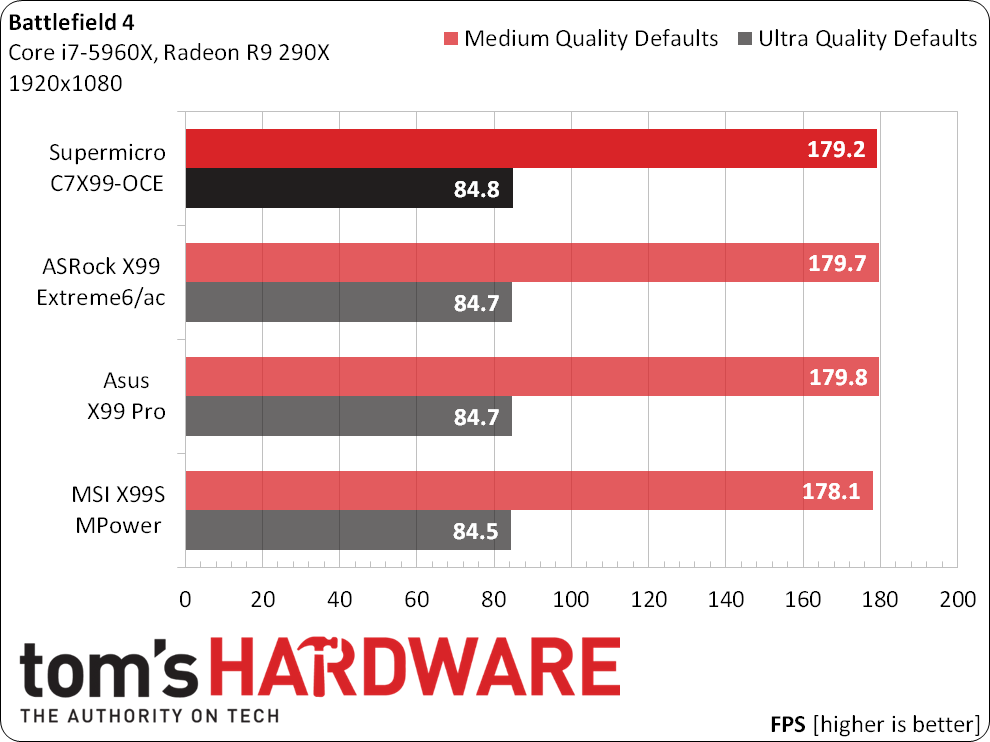
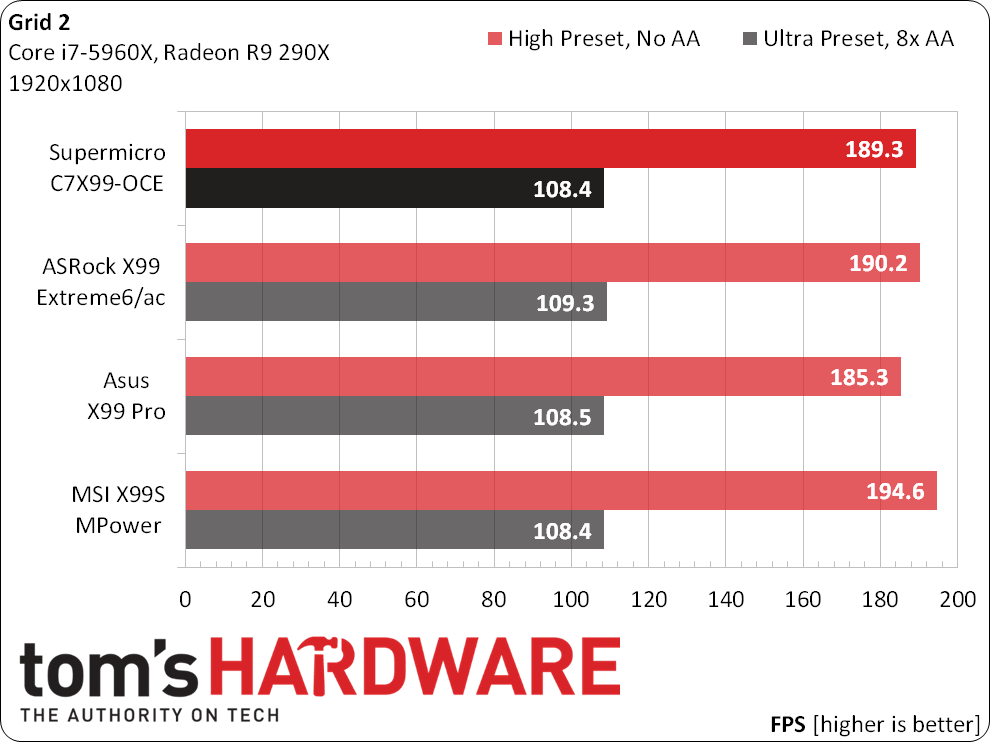
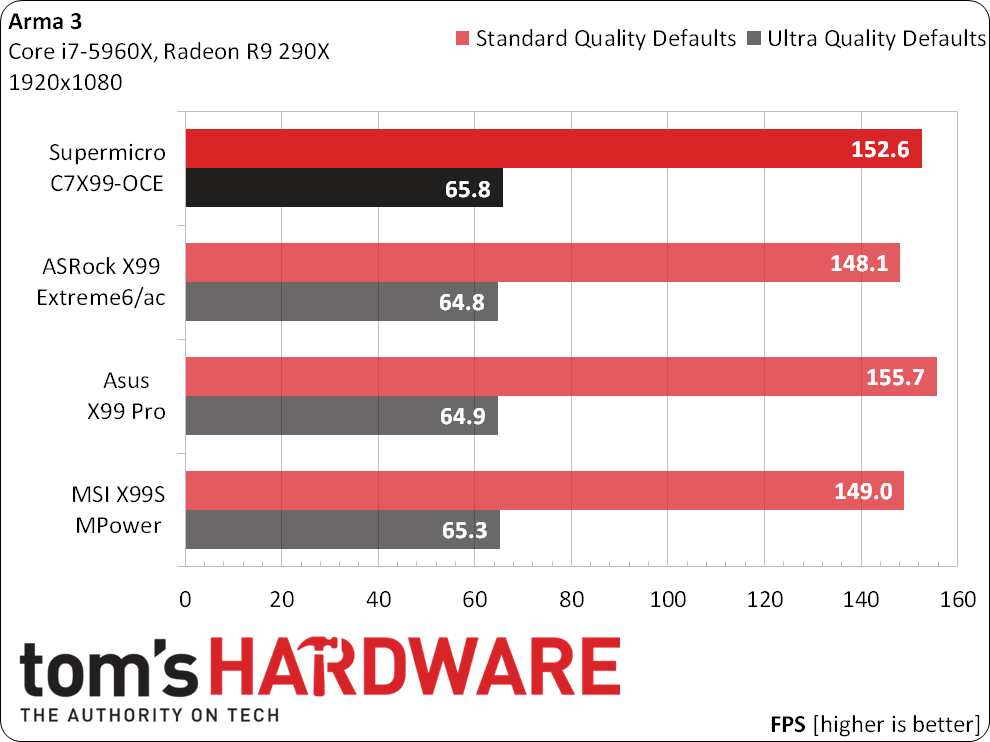
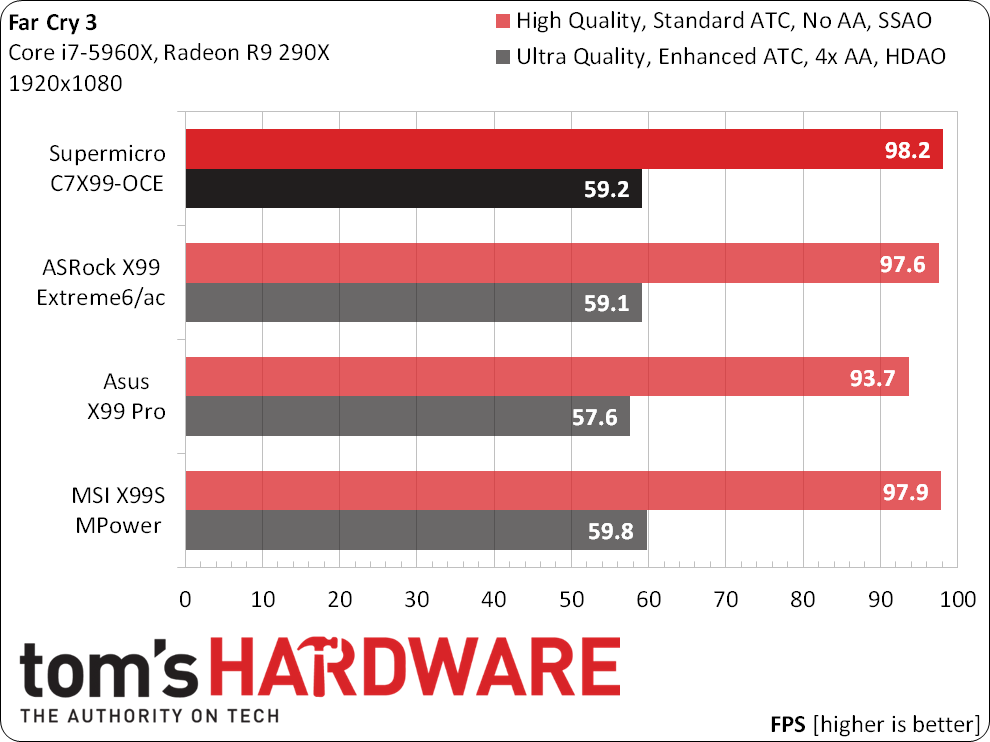
The C7X99-OCE is also found near the middle of a tightly-grouped pack of gaming performance scores.
Encoding, Creativity, Productivity And File Compression
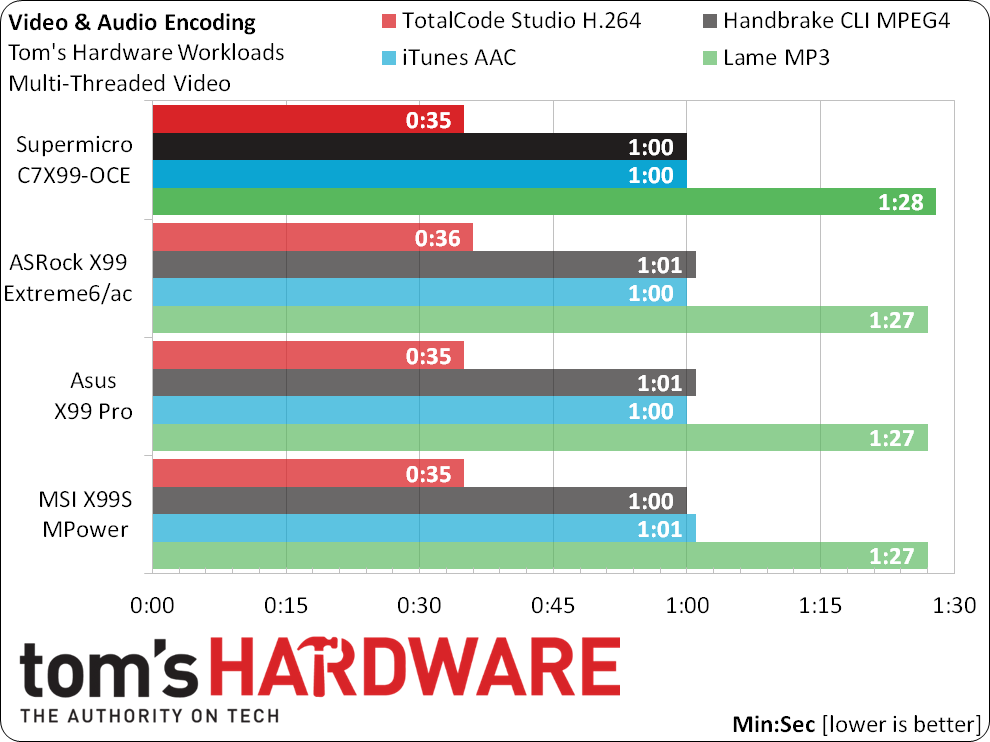
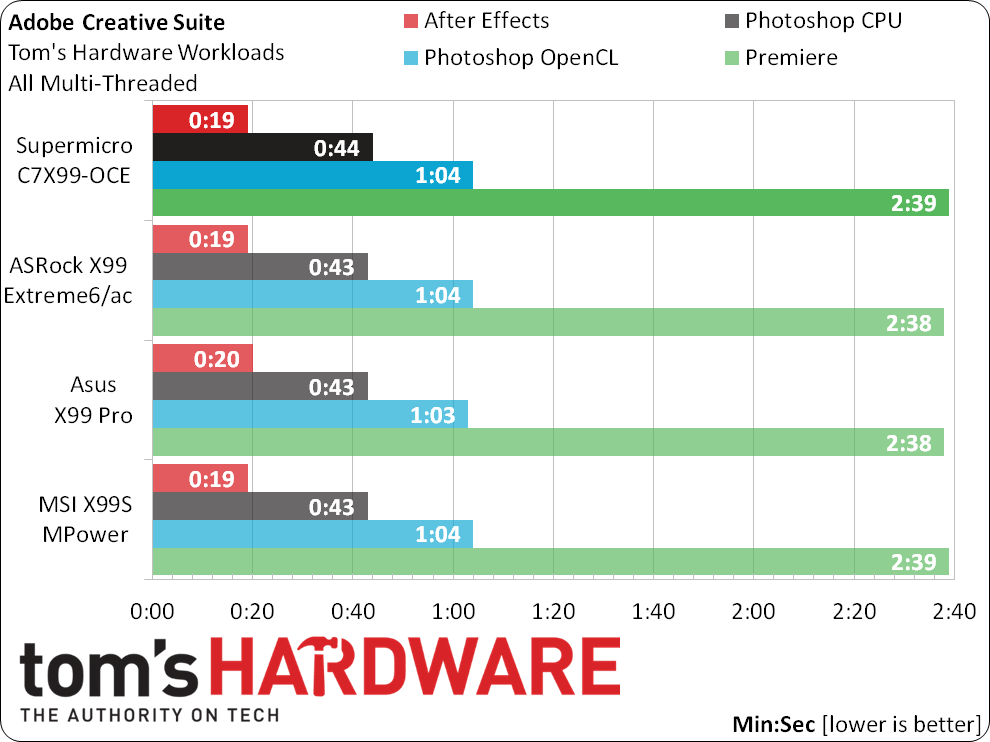
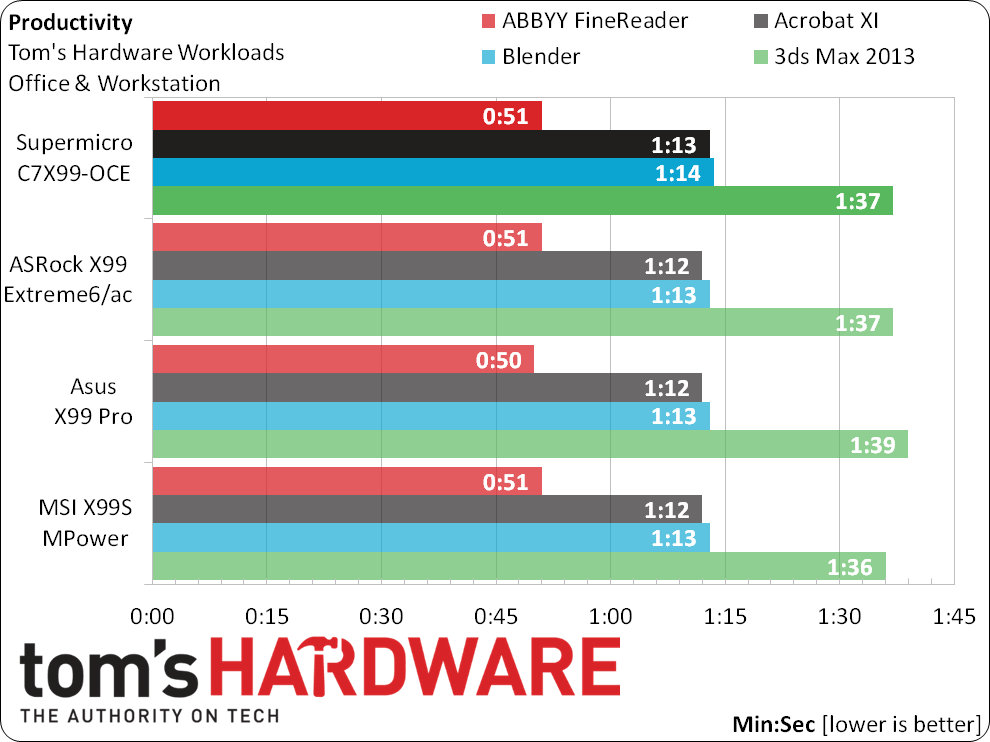
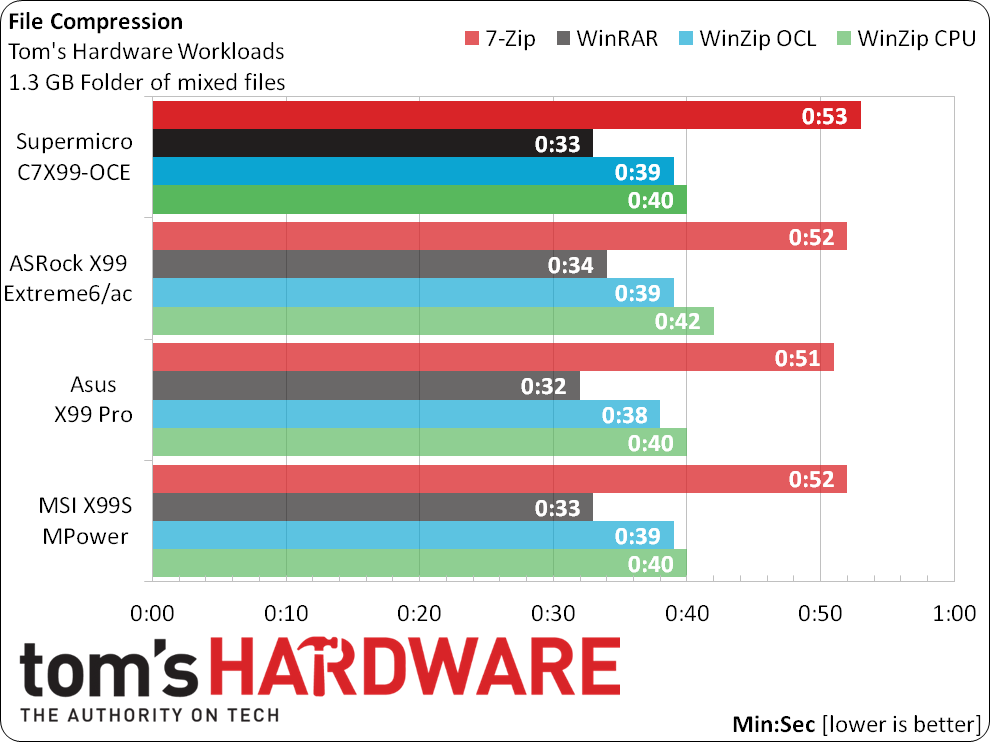
The C7X99-OCE retains mid-pack performance consistency throughout our application suites.
Encoding, Creativity, Productivity And File Compression
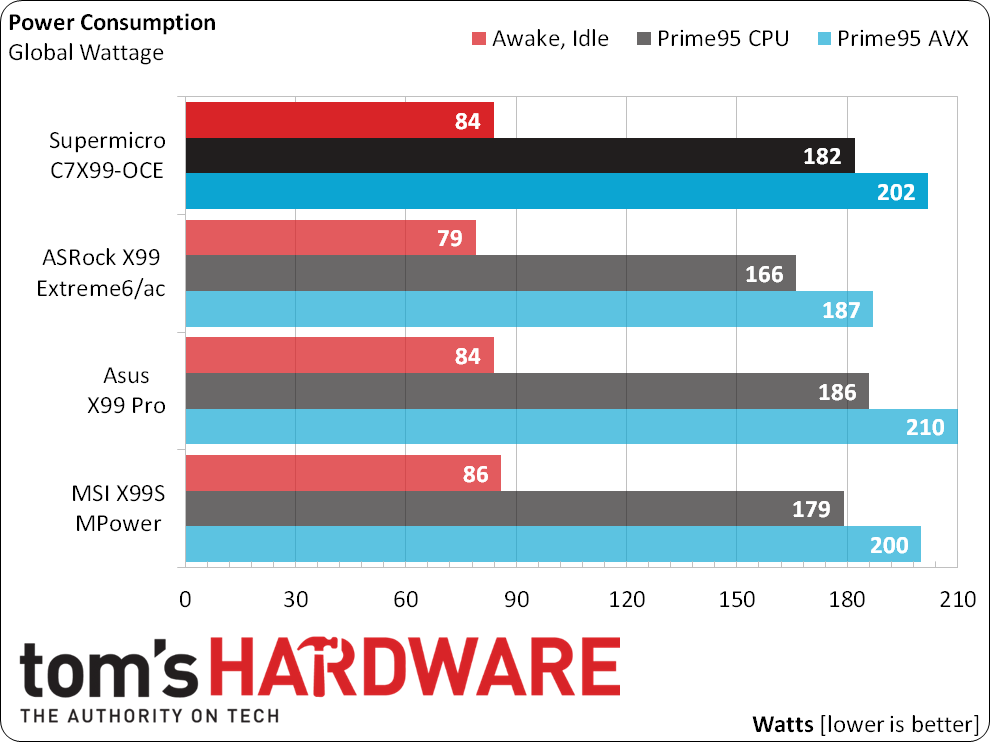
The C7X99-OCE consumes about as much power as its competitors, falling between the feature-packed Asus and feature-light MSI boards under full load. Temperatures are a little high, which could account for average power consumption on a board with fewer added-on controllers.
Get Tom's Hardware's best news and in-depth reviews, straight to your inbox.
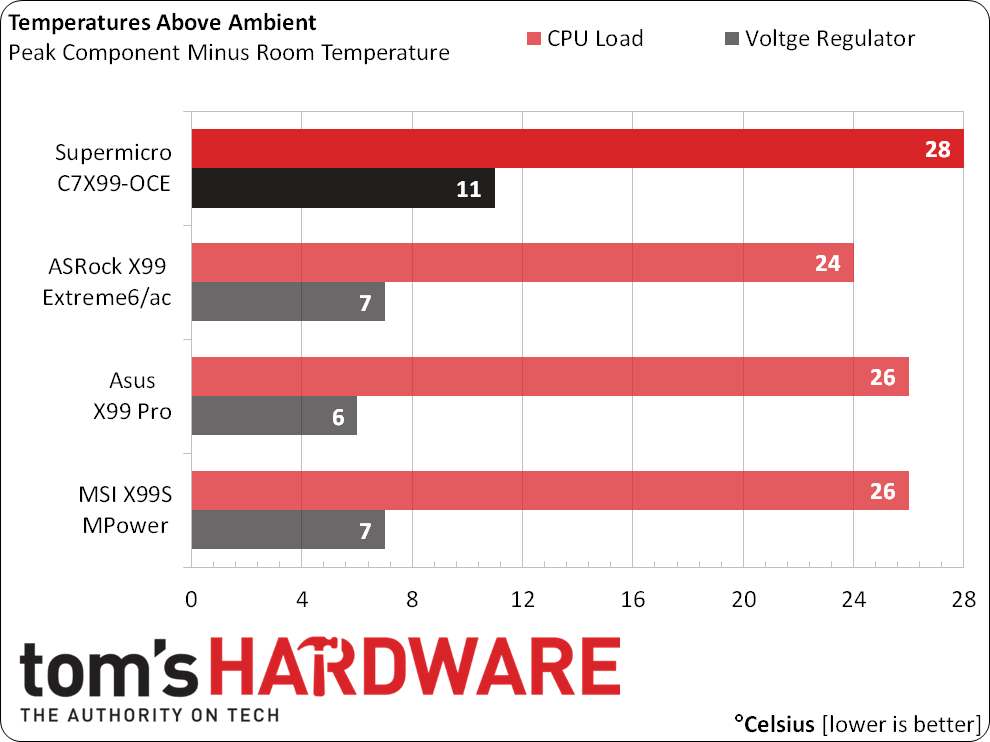
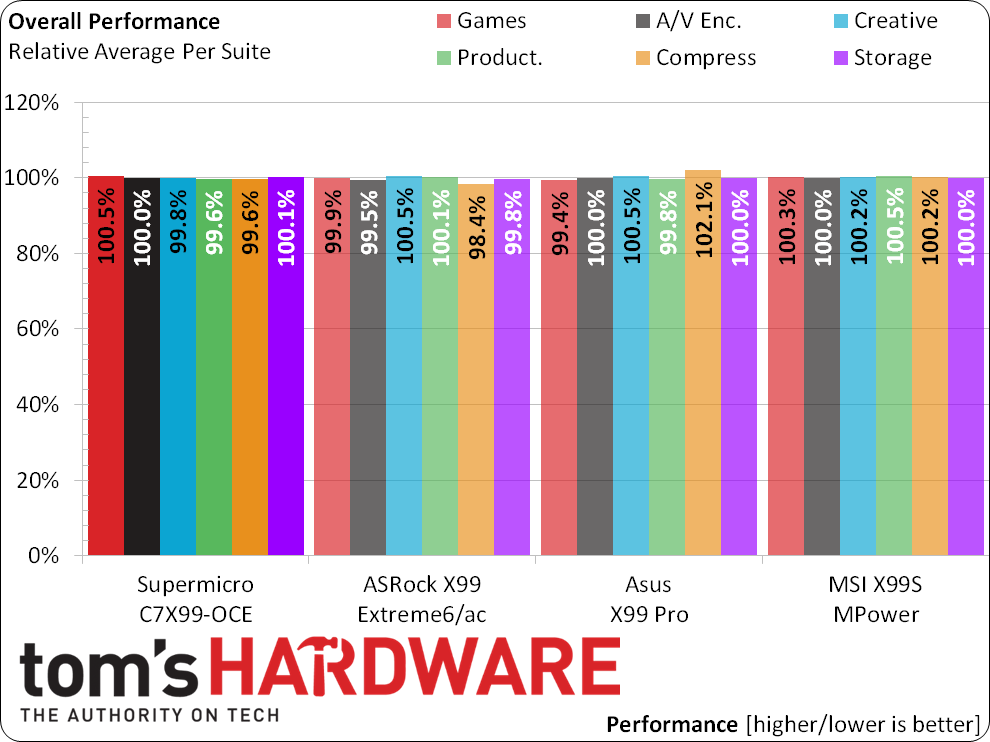
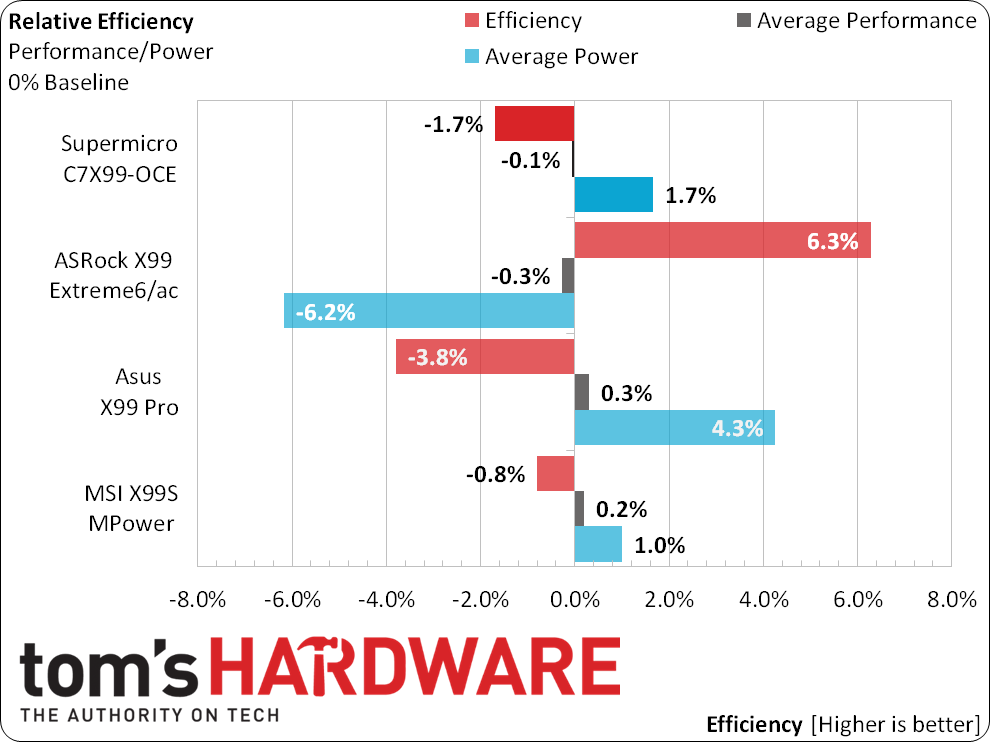
Our efficiency chart averages all nine previously-tested X99 motherboards, including microATX and low-cost models. The C7X99-OCE’s efficiency looks a little worse, even though the lower-cost boards it’s competing against have a similar feature count.
Overclocking
| BIOS Frequency and Voltage settings (for overclocking) | ||||
|---|---|---|---|---|
| Row 0 - Cell 0 | Supermicro C7X99-OCE | MSI X99S MPower | ASRock X99 Extreme6/ac | Asus X99 Pro |
| BIOS | 1.0a (12/11/2014) | V22.3 (11/25/2014) | 1.40 (11/11/2014) | 1004 (10/16/2014) |
| Base Clock | 43-540MHz (0.01MHz) | 91-300MHz (0.05MHz) | 96-300MHz (0.1MHz) | 80-300MHz (0.1MHz) |
| CPU Multiplier | 12-80x (1x) | 12-80x (1x) | 12-120x (1x) | 12-80x (1x) |
| DRAM Data Rates | 800-4000 | 1333-2666 | 800-2666 | 1200-4000 |
| CPU Vcore | 0-2.00V (1mV) | 0.80-2.10V (1mV) | 0.80-2.00V (1mV) | 0.001-1.92V (1mV) |
| VCCIN | 1.81-2.50V (50mV) | 1.20-3.04V (1mV) | 1.20-2.30V (10mV) | 0.80-2.70V (1mV) |
| PCH Voltage | N/A | 0.70-2.32V (10mV) | 0.90-1.50V (25mV) | 0.70-1.80V (6.25mV) |
| DRAM Voltage | 1.20-1.60V (50mV) | 0.60-2.00V (10mV) | 1.00-1.80V (10mV) | 0.80-1.90V (10mV) |
| CAS Latency | 7-24 Cycles | 4-31 Cycles | 4-31 Cycles | 1-31 Cycles |
| tRCD | 4-32 Cycles | 4-31 Cycles | 5-31 Cycles | 1-31 Cycles |
| tRP | 4-32 Cycles | 4-31 Cycles | 5-31 Cycles | 1-31 Cycles |
| tRAS | 10-40 Cycles | 9-63 Cycles | 10-63 Cycles | 1-63 Cycles |
Supermicro endows the C7X99-OCE with a competitive range of clock settings, and even includes the non-validated memory ratios familiar primarily to owners of Asus motherboards.
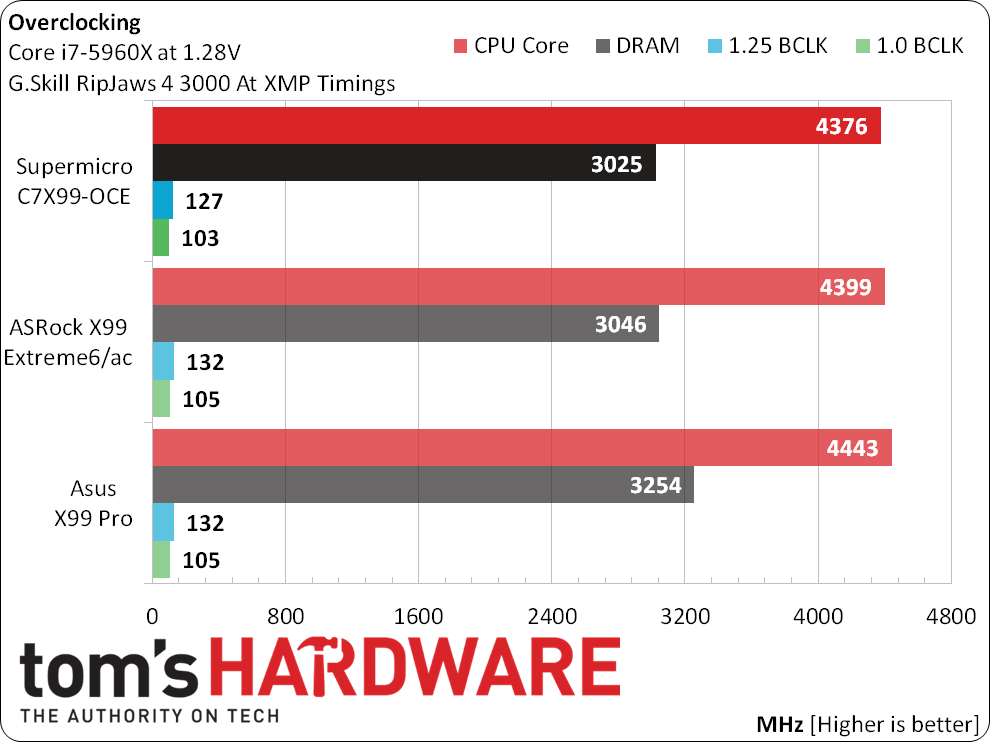
My test CPU unfortunately didn’t reach the expected 4 to 4.4GHz, coming up just shy of target at 4376MHz using a 102MHz BCLK setting and 43x multiplier. A slight shortfall in DRAM overclocking occurred when attempts to lower the CPU multiplier were either ineffective or caused a boot failure, though users of slower RAM should experience a greater variety of workarounds. Higher memory multipliers didn’t work either, though manual timing configuration might have eventually solved the issue. After five days of trying various firmware configurations, the 0.025GHz shortfall in frequency and data rate seemed even less important.
Choosing DDR4-2666 rather than the default XMP-3000 setting might be an option, but it barely outperforms DDR4-2133 SPD values on the C7X99-OCE. This chart is primarily a test of how aggressively each board auto-configures secondary and tertiary timings in response to multiplier manipulation, and it appears Supermicro favors overclocking stability over performance superiority.
Current page: Results: Benchmarks, Efficiency And Overclocking
Prev Page C7X99-OCE Firmware Next Page Final Analysis-
InvalidError Reply
Tons of consumer electronics in North America only have a one-year manufacturer warranty regardless of price range.15434696 said:Is it only me or does 3 year warranty on $300 components seem a little low?
Personally, I think three years should be the minimum legal warranty: reduce the amount of e-waste generated by device manufacturers engineering their products to barely outlive the warranty. Making retailers accountable for part of the warranty repair costs would also give them incentive to avoid stocking dodgy products.
(Except on batteries which people can ruin within months by abusing the heck out of them, one more reason to make batteries user-replaceable again.) -
wolverine96 It seems like a good motherboard for most users' needs. Supermicro followed the old saying, Keep It Simple, Stupid!I kind of like the complete absence of USB 2.0. Who really needs USB 2.0, when USB 3.0 is backward-compatible? The only slight problem I can think of is the front USB 2.0 ports on your case will be useless, but there are other case options out there.Reply -
firefoxx04 Does Win8 / Win10 have native usb 3.0 support? I imagine they do. I know I have a hard time installing windows 7 when my USB key / keyboard / mouse are plugged into a usb 3.0 port.Reply
I like seeing that USB 3 is becoming prevalent but it worries me a bit for 100% backwards comparability. I guess installing a driver during install is not too trivial but it is annoying. -
Crashman Reply
Blame the motherboard manufacturer, probably, as most of those old systems relied on third-party controllers not supported by native drivers. Remember that USB 3.0 is a 2-in-1 interface, the USB 2.0 connection is still there (chipset-based ports should be supported in USB 2.0 mode prior to updating the drivers).15438455 said:Does Win8 / Win10 have native usb 3.0 support? I imagine they do. I know I have a hard time installing windows 7 when my USB key / keyboard / mouse are plugged into a usb 3.0 port.
I like seeing that USB 3 is becoming prevalent but it worries me a bit for 100% backwards comparability. I guess installing a driver during install is not too trivial but it is annoying.
-
bit_user Reply
I have one of their older Socket 2011 workstation boards.15434487 said:Can Supermicro deliver its legendary server-component reliability
I've been happy with it, so far (no overclocking or multi-GPU, though). My only complaint is a significant hissing on the line-out port, forcing me to use a separate sound card. But when I viewed the Newegg reviews a year later, it sounded like they had some serious quality problems starting shortly after I bought mine.
So, maybe they've already lost that "legendary reliability"? It wasn't a cheap board, either.
I just bought an ASRock mini-ITX server board, though it was the only option with all the features I wanted. We'll see how that works out...
-
Bolts Romano why do motherboard maker still provide ps2 connector on the motherboard?Reply
Is there people still use ps 2 keyboard today?
Is there people who can afford to buy 300 dollars motherboard and still use 1998 keyboard and mouse?
-
Crashman Reply
2 markets. Some people love their old mouse, others love their old mechanical keyboards. That's 2 markets, 1 port, roll the dice and hope the crossover doesn't hurt your marketing :)15448545 said:why do motherboard maker still provide ps2 connector on the motherboard?
Is there people still use ps 2 keyboard today?
Is there people who can afford to buy 300 dollars motherboard and still use 1998 keyboard and mouse?
-
bit_user Replywhy do motherboard maker still provide ps2 connector on the motherboard?
heard of BadUSB? Some people are disabling USB HID on their PCs. Granted, that's pretty uncommon.
Is there people still use ps 2 keyboard today?
Is there people who can afford to buy 300 dollars motherboard and still use 1998 keyboard and mouse?
I still use a PS/2 keyboard I paid $300 for, years ago. I do have a USB adapter for it, but I think it increases the number of missed key presses/releases.
