Why you can trust Tom's Hardware
Protection Features
Check out our PSUs 101 article to learn more about PSU protection features.
Protection Features | Row 0 - Cell 1 |
OCP | 12V: 84.6A (136.45%), 12.070V |
OPP | 1024.34W (136.58%) |
OTP | ✓ (100°C @ secondary side) |
SCP |
12V to Earth: ✓ |
PWR_OK | Accurate (but <1ms delay) |
NLO | ✓ |
SIP | Surge: - |
OCP is high at +12V and 5V, but it doesn't create any problems to the respective rails. The 3.3V rail can also handle the high OCP triggering point, but it is insane to allow for so high amperage on this rail, which is only lightly used.
The PSU shuts down at a relatively low temperature, on the secondary heat sink, but we didn't encounter any issues during our test sessions. Finally, it is a shame that there is no surge protection.
DC Power Sequencing
According to Intel’s most recent Power Supply Design Guide (revision 1.4), the +12V and 5V outputs must be equal to or greater than the 3.3V rail at all times. Unfortunately, Intel doesn't mention why it is so important to always keep the 3.3V rail's voltage lower than the levels of the other two outputs.
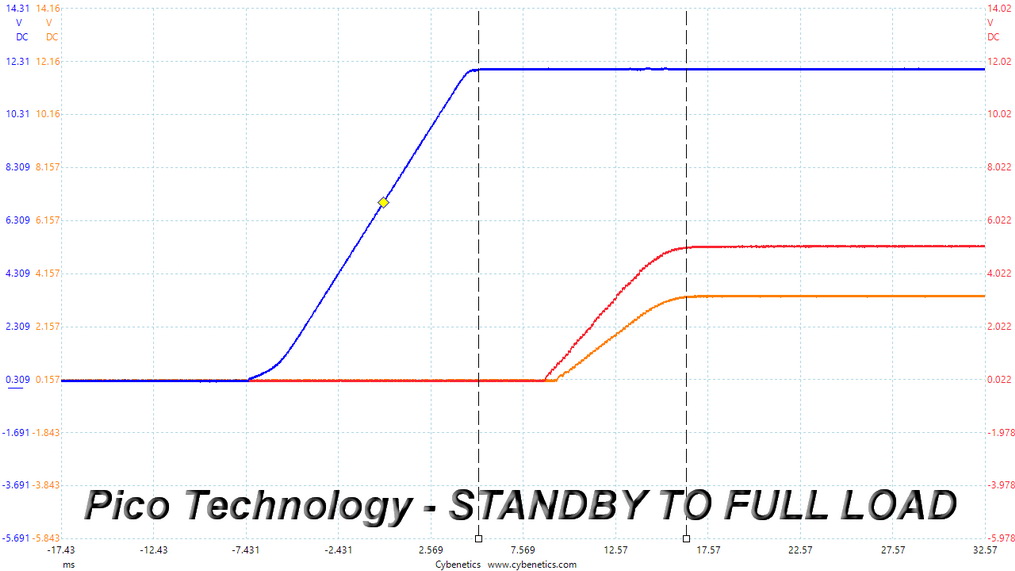
DC Power Sequencing Scope Shots
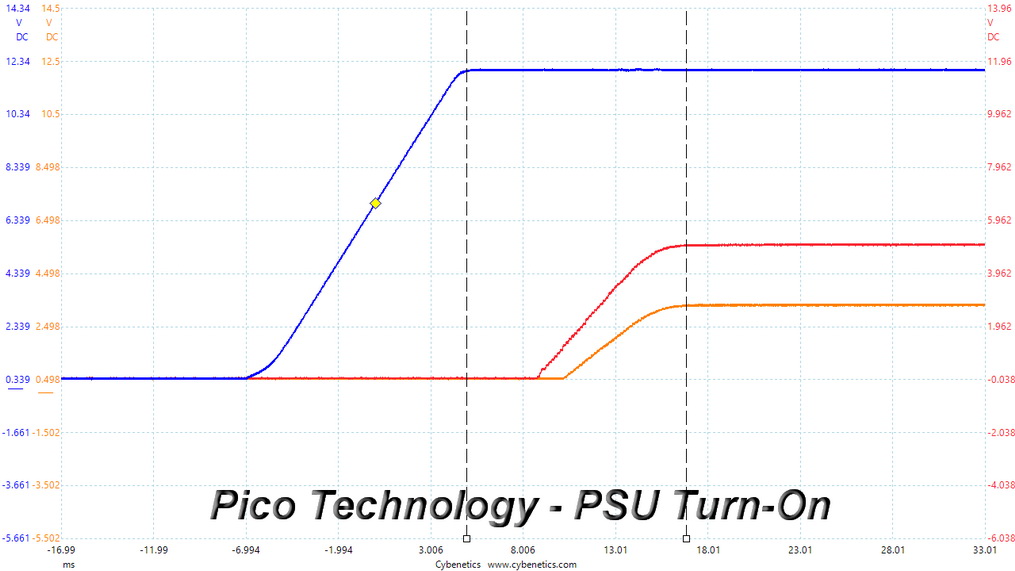
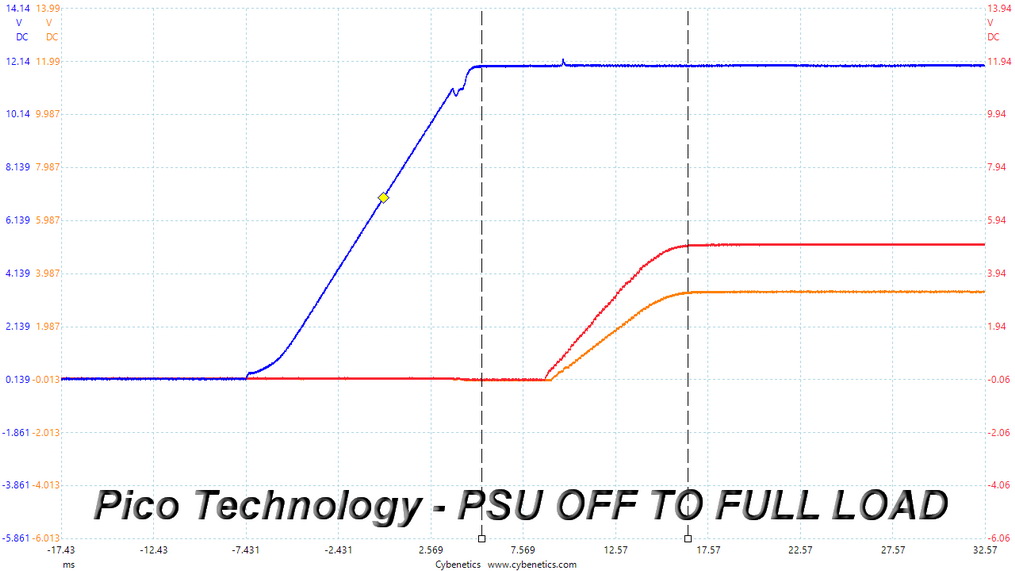
The 3.3V rail is lower than the other two in all cases, as the ATX spec requires.
Cross Load Tests
To generate the following charts, we set our loaders to auto mode through custom-made software before trying more than 25,000 possible load combinations with the +12V, 5V, and 3.3V rails. The deviations in each of the charts below are calculated by taking the nominal values of the rails (12V, 5V, and 3.3V) as point zero. The ambient temperature during testing was between 30 to 32 degrees Celsius (86 to 89.6 degrees Fahrenheit).
Load Regulation Charts
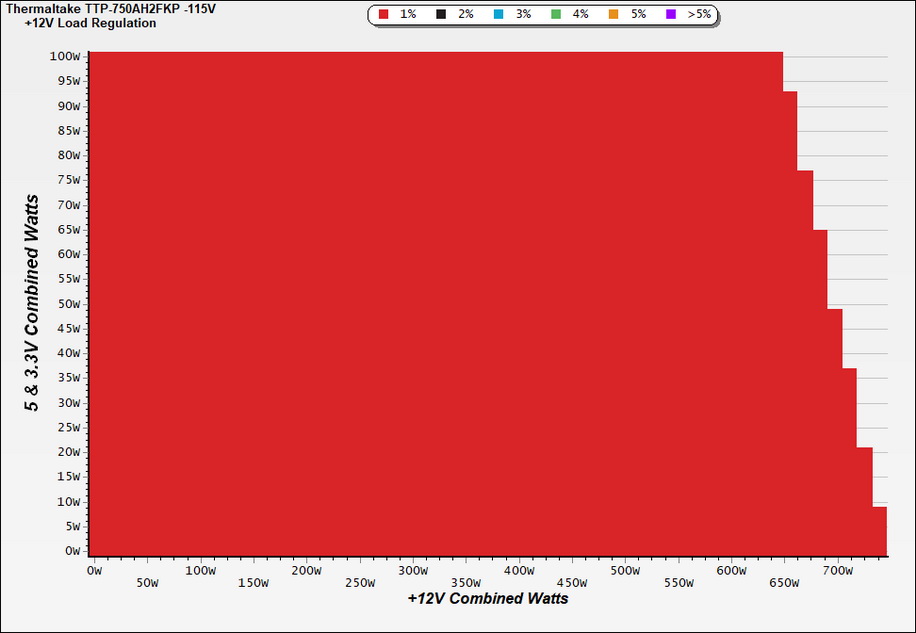
Load Regulation Charts
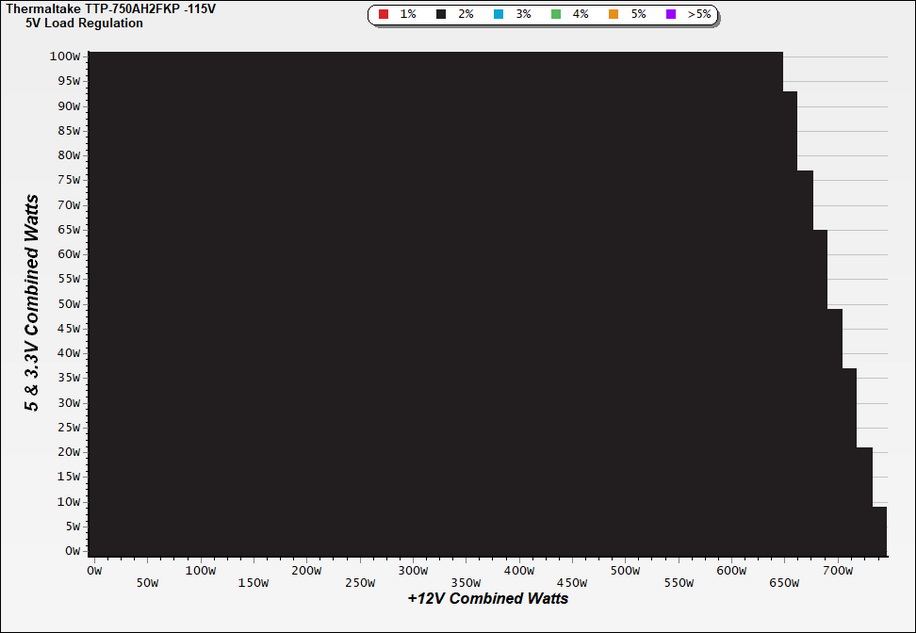
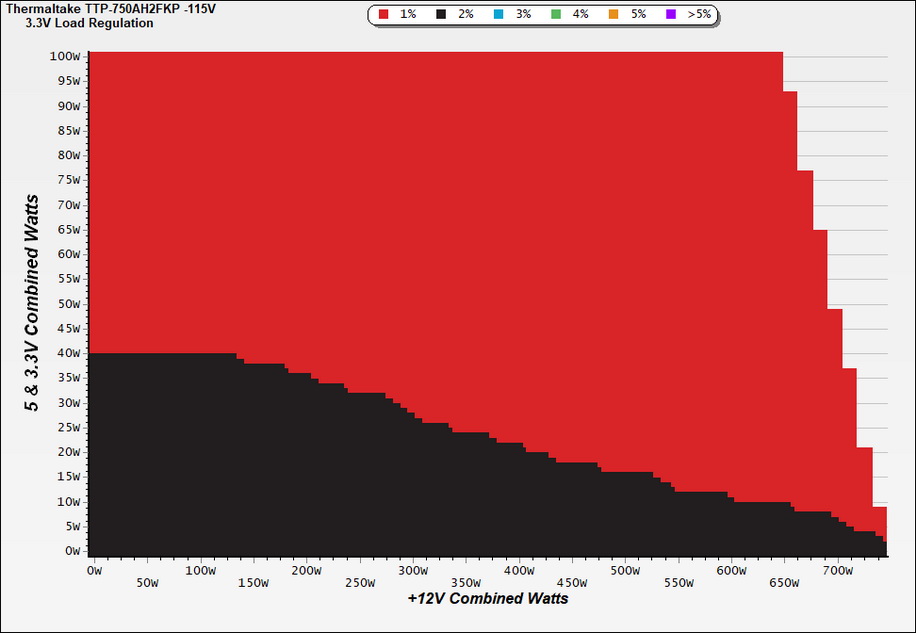
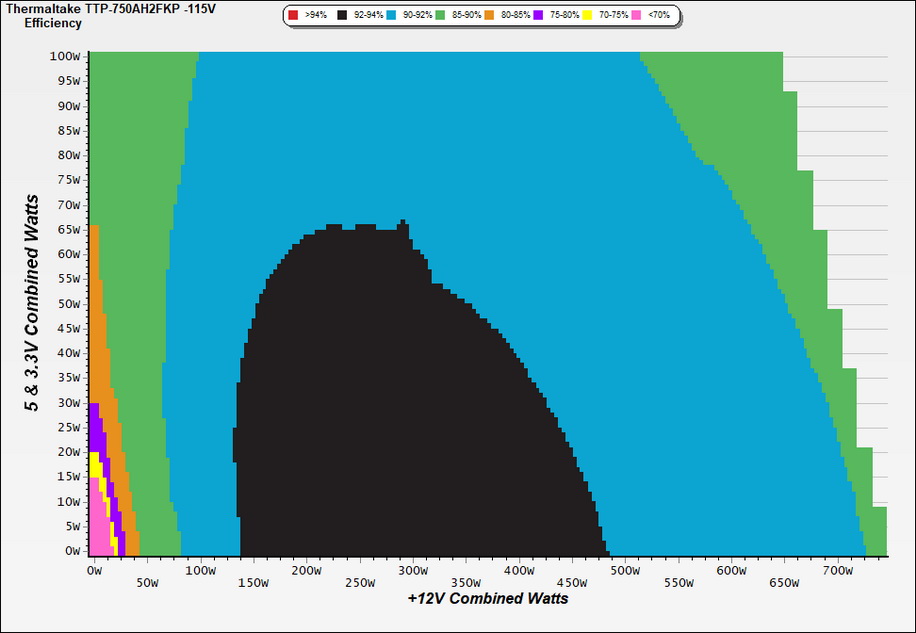
Efficiency Chart
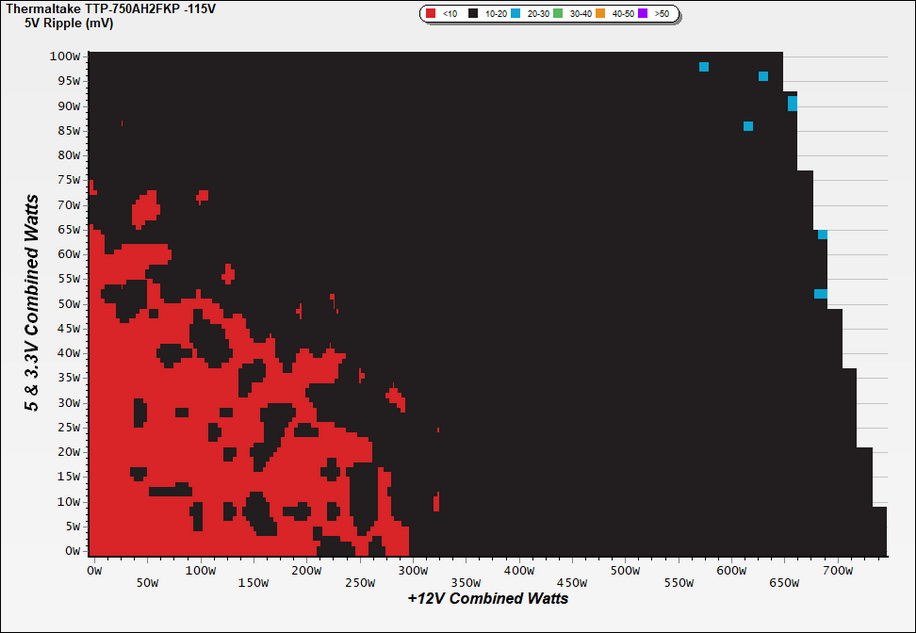
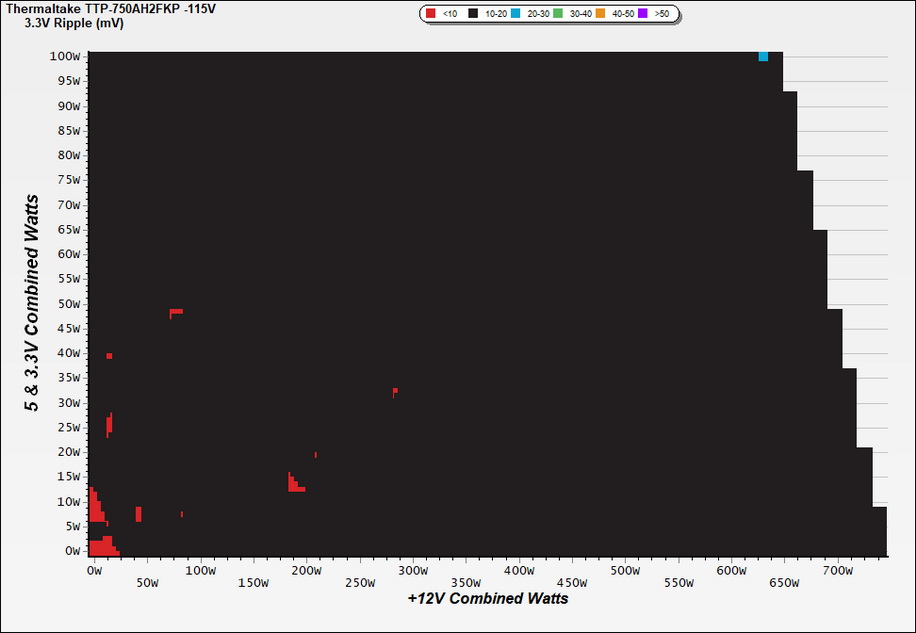
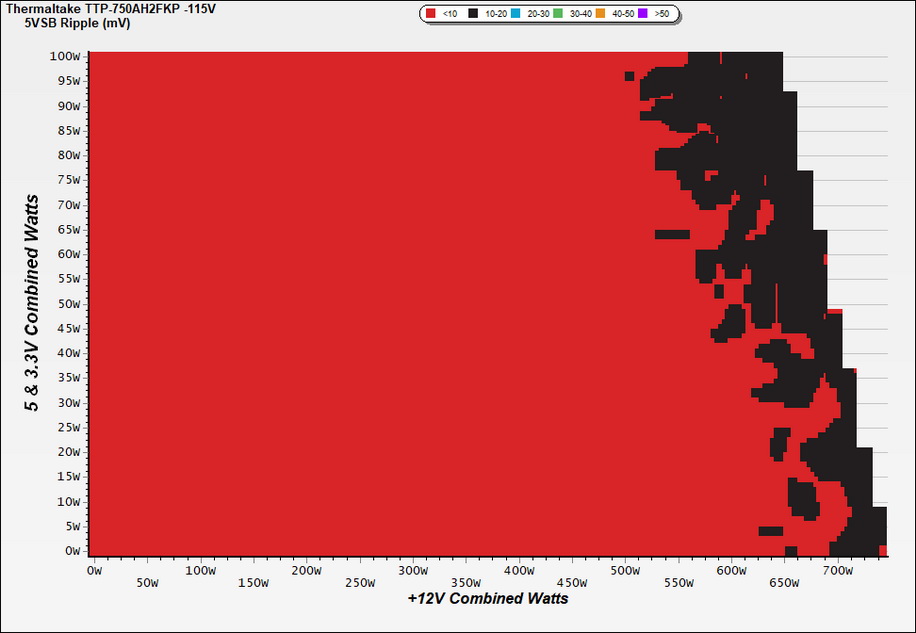
Ripple Charts
The lower the power supply's ripple, the more stable the system will be and less stress will also be applied to its components.
Get Tom's Hardware's best news and in-depth reviews, straight to your inbox.
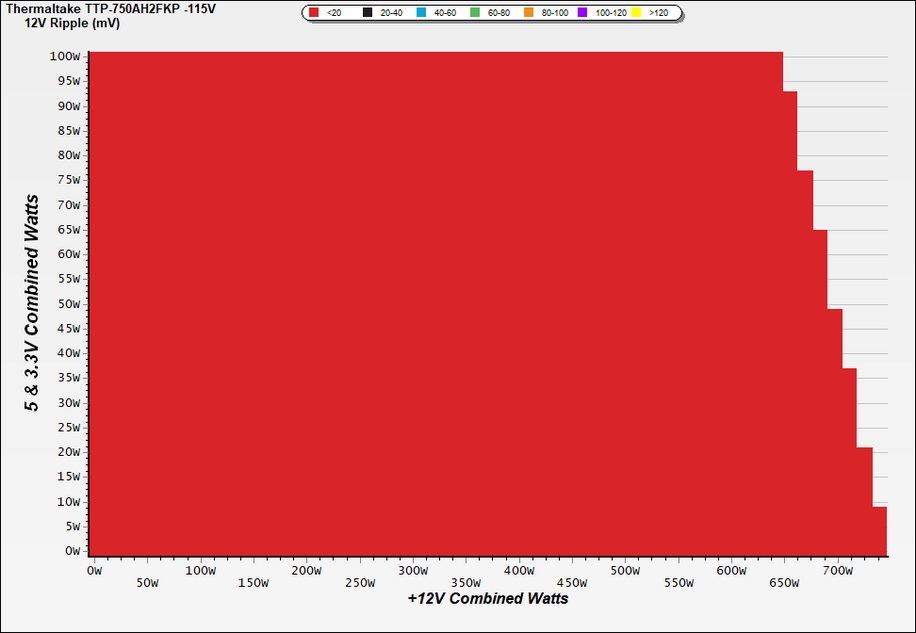
Ripple Suppression Charts
Infrared Images
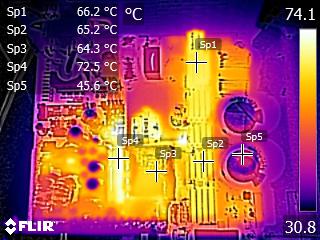
We apply a half-load for 10 minutes with the PSU's top cover and cooling fan removed before taking photos with a modified FLIR E4 camera able to deliver an IR resolution of 320x240 (76,800 pixels).
IR Images
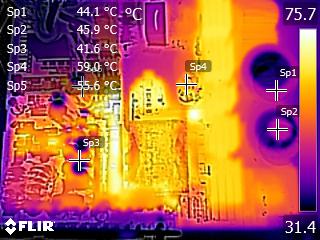
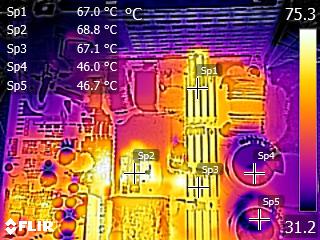
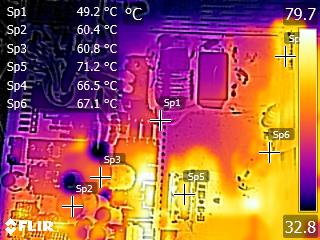
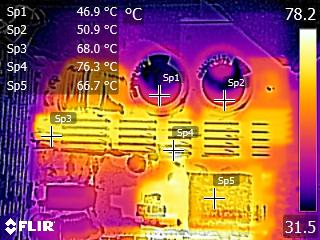
The hottest part is the vertical metallic bar right next to the +12V FETs, which is dead close to the filtering capacitors on the secondary side. This won't be a significant issue, though, because the airflow in this area is unobstructed.
MORE: Best Power Supplies
MORE: How We Test Power Supplies
MORE: All Power Supply Content
Current page: Protection Features, DC Power Sequencing, Cross-Load Tests and Infrared Images
Prev Page Load Regulation, Hold-Up Time, Inrush & Leakage Current, Efficiency and Noise Next Page Transient Response Tests, Timing Tests, Ripple Measurements and EMC Pre-Compliance Testing
Aris Mpitziopoulos is a contributing editor at Tom's Hardware, covering PSUs.
-
bdcrlsn I know they're not actually made by Thermaltake, but I've had a Toughpower 650-watt for 7 years and had no issues whatsoever. They're good choices these days in a saturated market.Reply -
Braindead154 I bought two of these power supplies to use in my new rig. BOTH of them had a high pitched whine when my computer was off or sleeping (MSI MEG x570 Unify). As much as I appreciated the long warranty and build quality, I prefer not to have a dog whistle in my PC case. They were returned.Reply
