Why you can trust Tom's Hardware
To learn more about our PSU tests and methodology, please check out How We Test Power Supply Units.
Primary Rails And 5VSB Load Regulation
The following charts show the main rails' voltage values recorded between a range of 40W up to the PSU's maximum specified load, along with the deviation (in percent). Tight regulation is an important consideration every time we review a power supply because it facilitates constant voltage levels despite varying loads. Tight load regulation also, among other factors, improves the system’s stability, especially under overclocked conditions and, at the same time, it applies less stress to the DC-DC converters that many system components utilize.
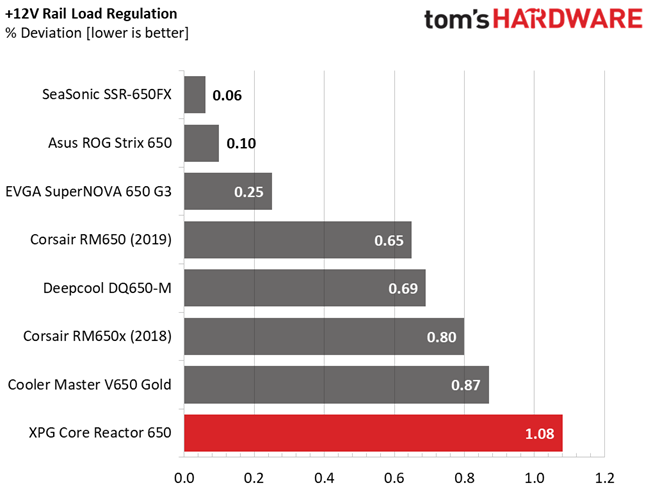
Results 1-8: Load Regulation
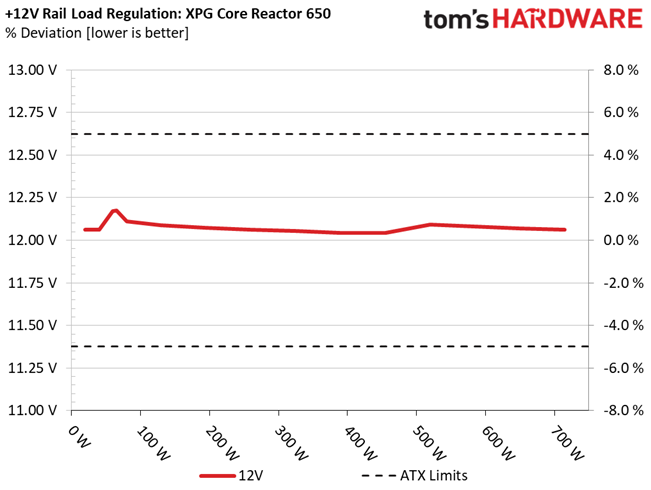
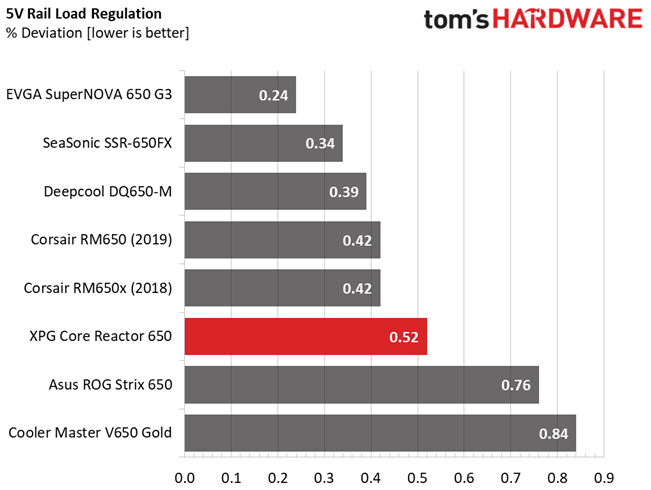
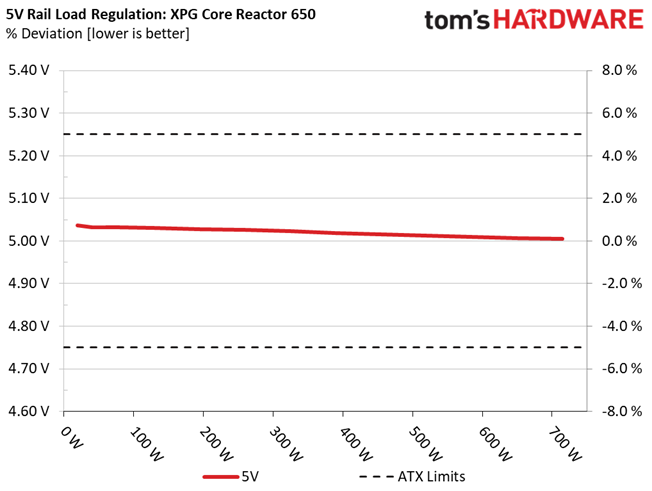
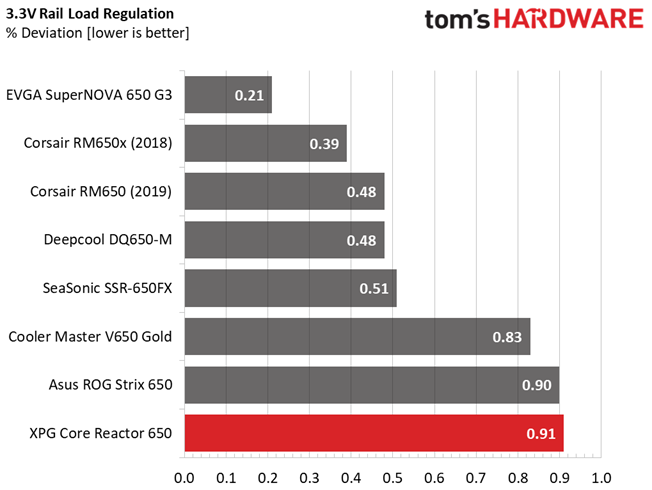
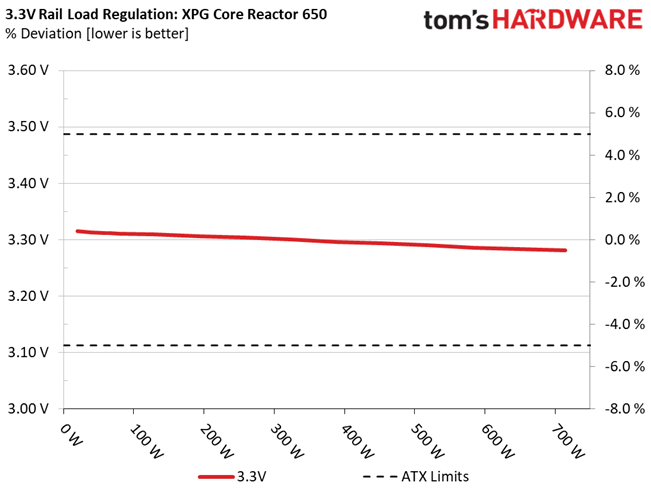
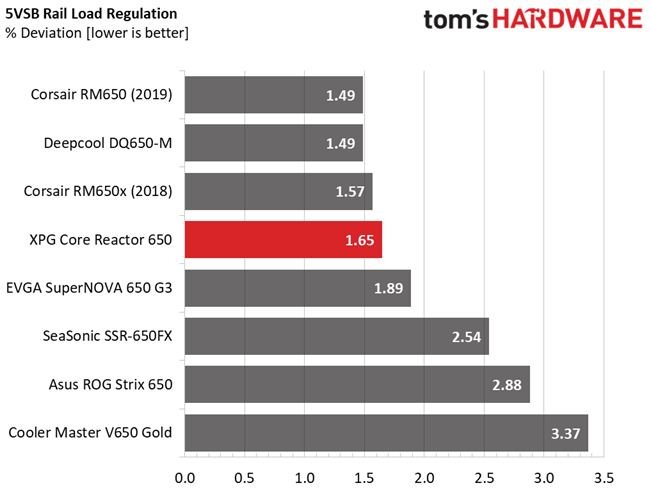
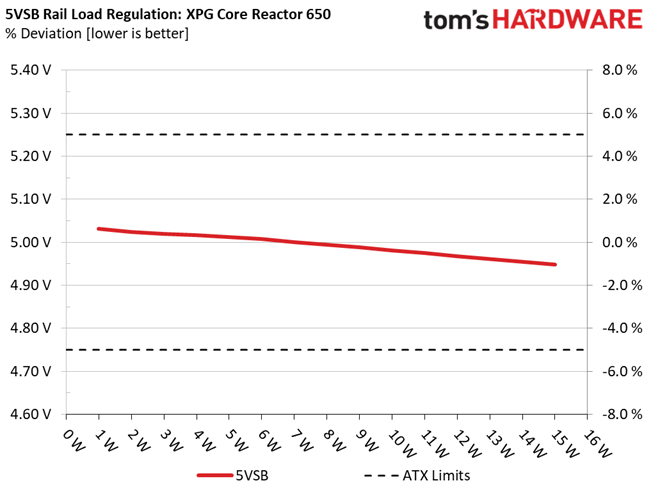
The load regulation at +12V is affected by a notable voltage spike at light loads. Throughout the normal load range, it is pretty tight, though. The minor rails remain within 1%, and the 5VSB rail also registers a low deviation.
Hold-Up Time
Put simply, hold-up time is the amount of time that the system can continue to run without shutting down or rebooting during a power interruption.
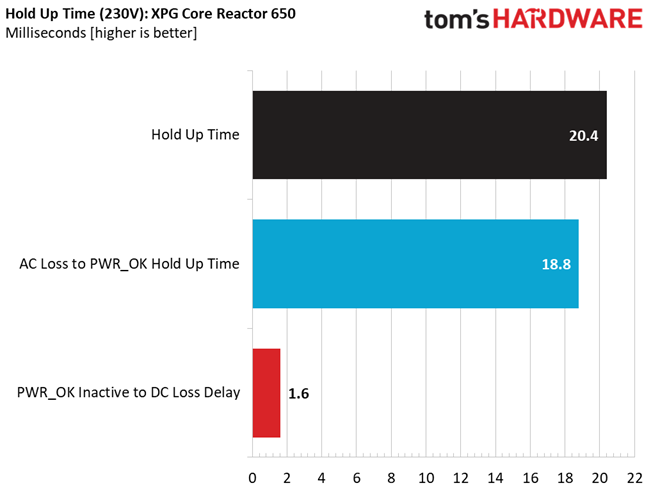
Results 9-12: Hold-Up Time
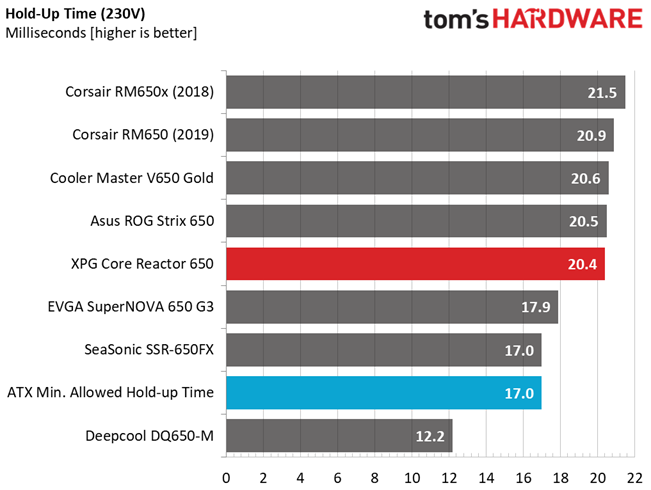
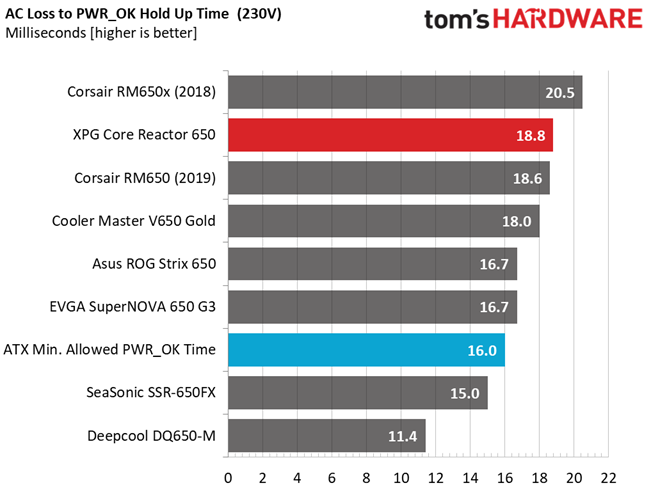
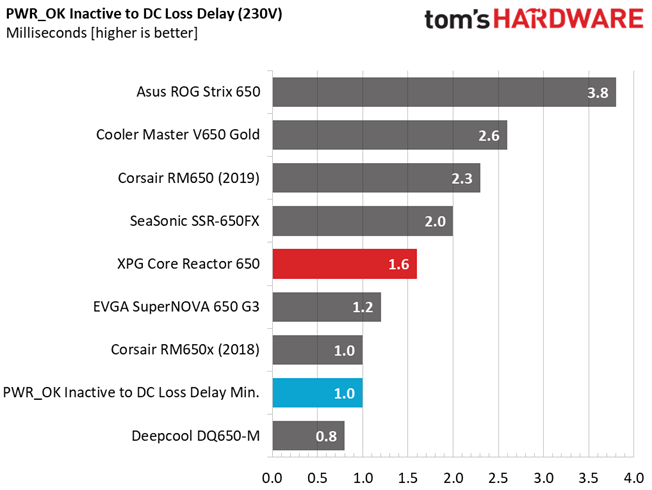
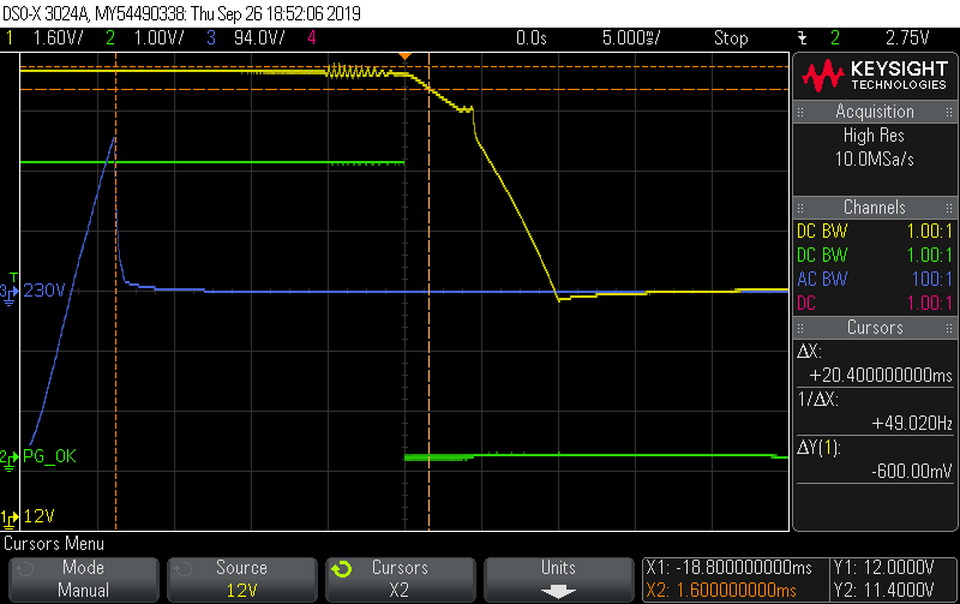
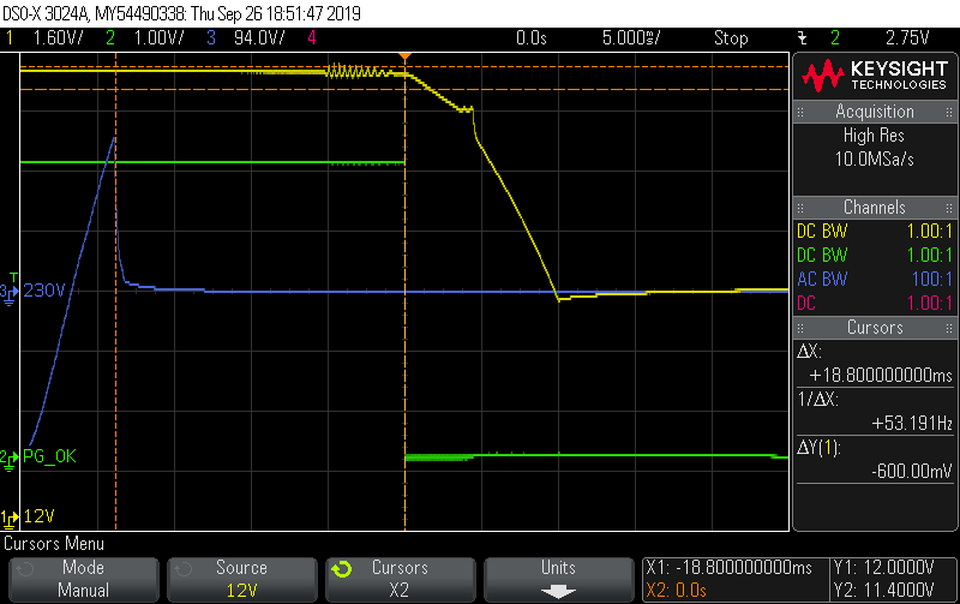
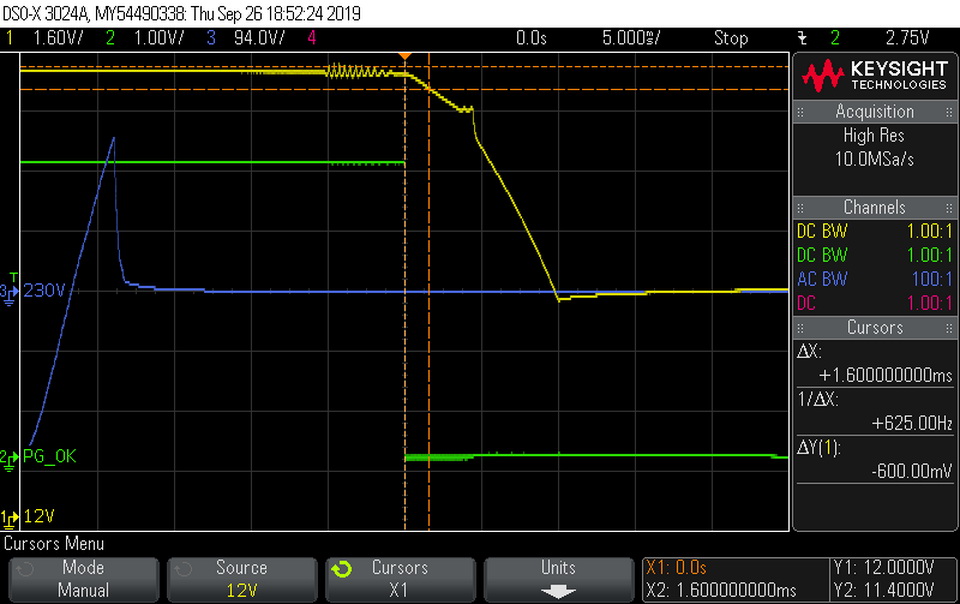
The hold-up time exceeds 20 ms and the power-ok signal is accurate.
Inrush Current
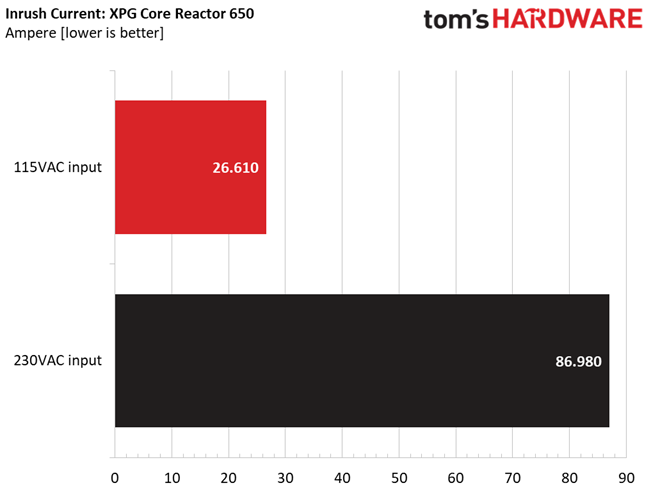
Inrush current, or switch-on surge, refers to the maximum, instantaneous input current drawn by an electrical device when it is first turned on. A large enough inrush current can cause circuit breakers and fuses to trip. It can also damage switches, relays, and bridge rectifiers. As a result, the lower the inrush current of a PSU right as it is turned on, the better.
Results 13-14: Inrush Current
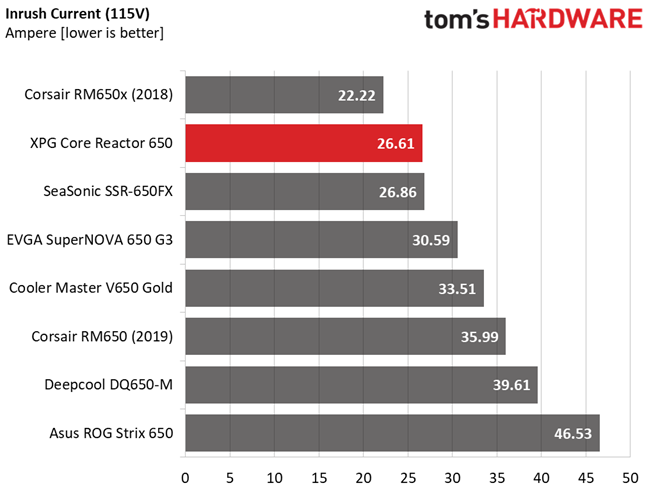
The inrush current is low with 115V input and below 100A with 230V, so there are no issues here.
Get Tom's Hardware's best news and in-depth reviews, straight to your inbox.
10-110% Load Tests
These tests reveal the PSU's load regulation and efficiency levels under high ambient temperatures. They also show how the fan speed profile behaves under increased operating temperatures.
| Test # | 12V | 5V | 3.3V | 5VSB | DC/AC (Watts) | Efficiency | Fan Speed (RPM) | PSU Noise (dB[A]) | Temps (In/Out) | PF/AC Volts |
| 1 | 3.561A | 1.988A | 1.991A | 0.998A | 64.949 | 86.256% | 658 | 10.0 | 40.02°C | 0.963 |
| 12.173V | 5.032V | 3.312V | 5.012V | 75.298 | 44.79°C | 115.13V | ||||
| 2 | 8.152A | 2.983A | 2.990A | 1.199A | 129.460 | 90.137% | 661 | 10.1 | 40.31°C | 0.987 |
| 12.090V | 5.030V | 3.309V | 5.007V | 143.626 | 45.52°C | 115.13V | ||||
| 3 | 13.133A | 3.482A | 3.477A | 1.400A | 194.559 | 91.484% | 663 | 10.2 | 41.03°C | 0.989 |
| 12.073V | 5.028V | 3.306V | 5.001V | 212.671 | 46.72°C | 115.13V | ||||
| 4 | 18.121A | 3.980A | 3.996A | 1.602A | 259.782 | 91.577% | 666 | 10.3 | 41.87°C | 0.991 |
| 12.062V | 5.026V | 3.304V | 4.994V | 283.676 | 48.30°C | 115.13V | ||||
| 5 | 22.777A | 4.980A | 4.999A | 1.805A | 325.069 | 91.154% | 948 | 19.3 | 42.13°C | 0.992 |
| 12.054V | 5.023V | 3.300V | 4.988V | 356.614 | 49.56°C | 115.13V | ||||
| 6 | 27.379A | 5.979A | 6.006A | 2.008A | 389.586 | 90.469% | 1177 | 26.4 | 42.65°C | 0.991 |
| 12.045V | 5.019V | 3.296V | 4.981V | 430.627 | 50.67°C | 115.13V | ||||
| 7 | 32.037A | 6.982A | 7.017A | 2.212A | 454.917 | 89.639% | 1439 | 32.2 | 43.03°C | 0.991 |
| 12.042V | 5.015V | 3.293V | 4.975V | 507.498 | 51.44°C | 115.12V | ||||
| 8 | 36.535A | 7.984A | 8.026A | 2.417A | 520.247 | 88.908% | 1816 | 38.8 | 43.64°C | 0.992 |
| 12.093V | 5.012V | 3.290V | 4.968V | 585.152 | 52.69°C | 115.12V | ||||
| 9 | 41.608A | 8.489A | 8.523A | 2.417A | 585.156 | 88.330% | 1953 | 41.1 | 44.64°C | 0.993 |
| 12.080V | 5.009V | 3.286V | 4.966V | 662.466 | 54.80°C | 115.12V | ||||
| 10 | 46.425A | 8.994A | 9.048A | 3.032A | 649.988 | 87.592% | 2088 | 42.5 | 45.38°C | 0.993 |
| 12.068V | 5.006V | 3.283V | 4.948V | 742.066 | 56.41°C | 115.12V | ||||
| 11 | 51.823A | 8.994A | 9.054A | 3.033A | 714.814 | 86.809% | 2312 | 46.0 | 46.52°C | 0.993 |
| 12.062V | 5.005V | 3.281V | 4.947V | 823.434 | 58.09°C | 115.12V | ||||
| CL1 | 0.152A | 13.004A | 13.001A | 0.000A | 109.974 | 84.493% | 1014 | 21.6 | 42.38°C | 0.984 |
| 12.118V | 5.019V | 3.297V | 5.051V | 130.158 | 49.46°C | 115.14V | ||||
| CL2 | 54.186A | 1.004A | 1.001A | 1.000A | 667.196 | 88.092% | 2155 | 43.3 | 45.66°C | 0.993 |
| 12.067V | 5.020V | 3.296V | 4.994V | 757.382 | 56.51°C | 115.12V |
The fan spins at very low RPM during the first four tests, despite the high ambient temperatures. The efficiency levels are high at light and moderate loads, and even with full load, at 45 degrees Celsius ambient temperature, the PSU's efficiency is close to 88%, which is what the 80 Plus Gold requires (at a much lower ambient, however).
20-80W Load Tests
In the following tests, we measure the PSU's efficiency at loads significantly lower than 10% of its maximum capacity (the lowest load the 80 Plus standard measures). This is important for representing when a PC is idle with power-saving features turned on.
| Test # | 12V | 5V | 3.3V | 5VSB | DC/AC (Watts) | Efficiency | Fan Speed (RPM) | PSU Noise (dB[A]) | PF/AC Volts |
| 1 | 1.205A | 0.497A | 0.483A | 0.199A | 19.641 | 77.947% | 649 | 9.6 | 0.835 |
| 12.064V | 5.036V | 3.315V | 5.031V | 25.198 | 115.13V | ||||
| 2 | 2.466A | 0.993A | 0.997A | 0.398A | 40.049 | 83.842% | 649 | 9.6 | 0.932 |
| 12.064V | 5.032V | 3.313V | 5.024V | 47.767 | 115.13V | ||||
| 3 | 3.627A | 1.492A | 1.480A | 0.598A | 59.552 | 85.579% | 653 | 9.8 | 0.961 |
| 12.170V | 5.032V | 3.312V | 5.020V | 69.587 | 115.13V | ||||
| 4 | 4.902A | 1.988A | 1.993A | 0.798A | 79.973 | 87.798% | 655 | 9.9 | 0.976 |
| 12.111V | 5.032V | 3.311V | 5.016V | 91.088 | 115.13V |
The efficiency levels at light loads are high, while the fan speed is so low that you won't be able to hear and noise from the fan.
2% or 10W Load Test
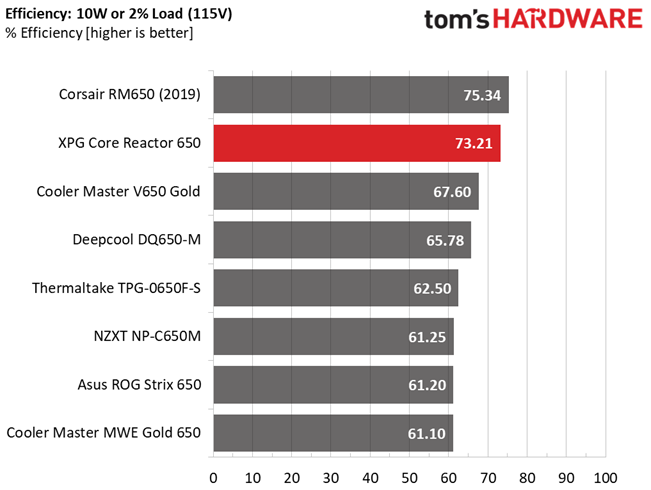
Intel plans on raising the ante at efficiency levels under ultra-light loads. So from July 2020, the ATX spec will require 70% and higher efficiency with 115V input. The applied load is only 10W for PSUs with 500W and lower capacities, while for stronger units we dial 2% of their max-rated-capacity.
| Test # | 12V | 5V | 3.3V | 5VSB | DC/AC (Watts) | Efficiency | Fan Speed (RPM) | PSU Noise (dB[A]) | PF/AC Volts |
| 1 | 0.924A | 0.224A | 0.222A | 0.050A | 13.242 | 73.209% | 606 | 8.5 | 0.746 |
| 12.043V | 5.030V | 3.313V | 5.029V | 18.088 | 115.14V |
The efficiency with a 2% load exceeds 70%, so the PSU meets the corresponding requirement of the ATX v2.52 spec.
Efficiency
Next, we plotted a chart showing the PSU’s efficiency at low loads, and loads from 10 to 110% of its maximum-rated capacity. The higher a PSU’s efficiency, the less energy goes wasted, leading to a reduced carbon footprint and lower electricity bills.
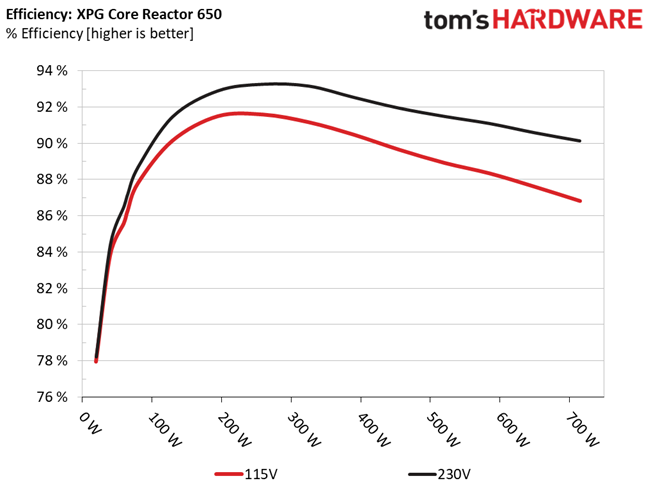
Results 15-18: Efficiency
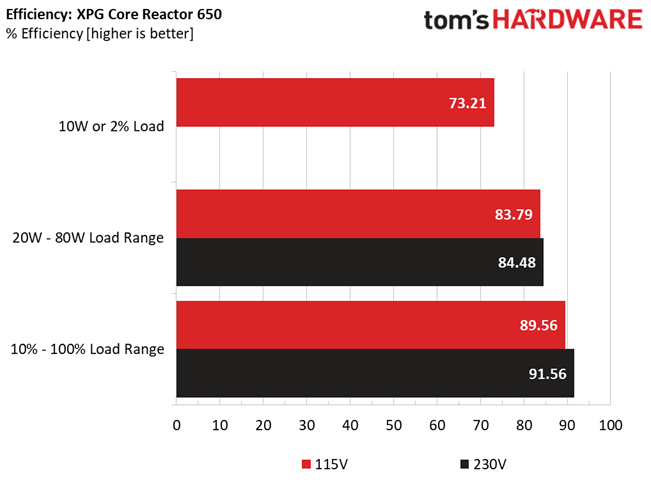
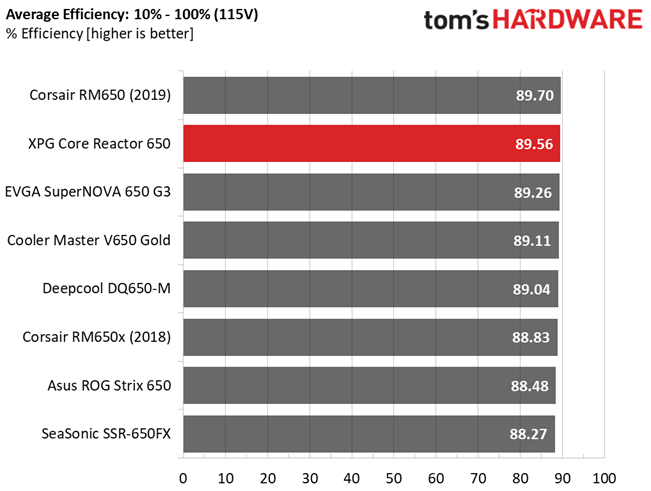
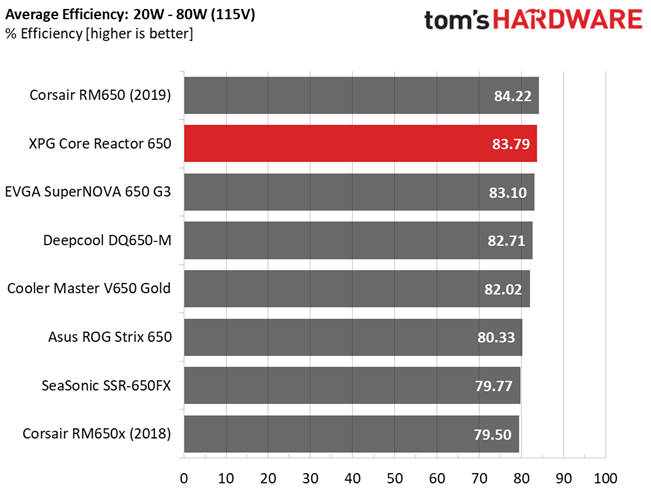
The efficiency levels are high at all load ranges. With 230V input and with higher than 300W loads, the efficiency difference with 115V input is notable.
5VSB Efficiency
| Test # | 5VSB | DC/AC (Watts) | Efficiency | PF/AC Volts |
| 1 | 0.100A | 0.506 | 77.017% | 0.065 |
| 5.052V | 0.657 | 115.13V | ||
| 2 | 0.250A | 1.263 | 79.284% | 0.145 |
| 5.048V | 1.593 | 115.13V | ||
| 3 | 0.550A | 2.773 | 80.284% | 0.255 |
| 5.040V | 3.454 | 115.13V | ||
| 4 | 1.000A | 5.029 | 79.990% | 0.341 |
| 5.028V | 6.287 | 115.13V | ||
| 5 | 1.500A | 7.522 | 79.970% | 0.389 |
| 5.014V | 9.406 | 115.13V | ||
| 6 | 3.000A | 14.917 | 78.809% | 0.452 |
| 4.972V | 18.928 | 115.13V |
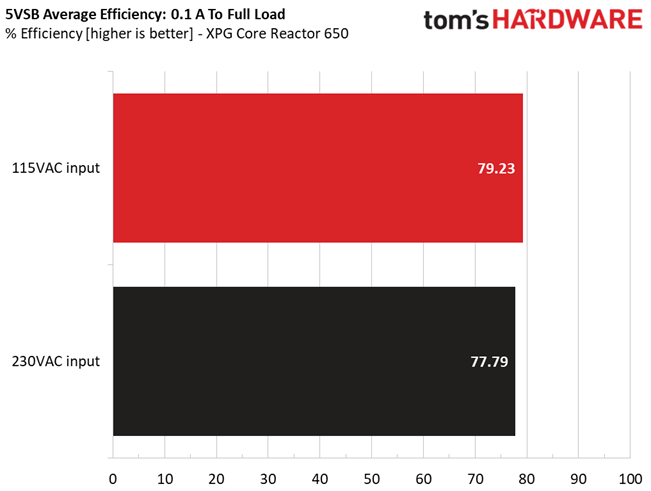
Results 19-20: 5VSB Efficiency
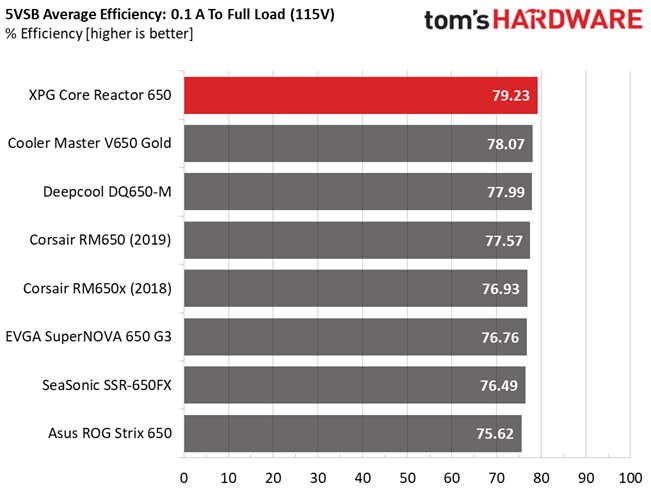
The 5VSB rail is highly efficient.
Power Consumption In Idle And Standby
| Mode | 12V | 5V | 3.3V | 5VSB | Watts | PF/AC Volts |
| Idle | 12.053V | 5.029V | 3.313V | 5.028V | 3.403 | 0.257 |
| 115.1V | ||||||
| Standby | 0.036 | 0.004 | ||||
| 115.1V |
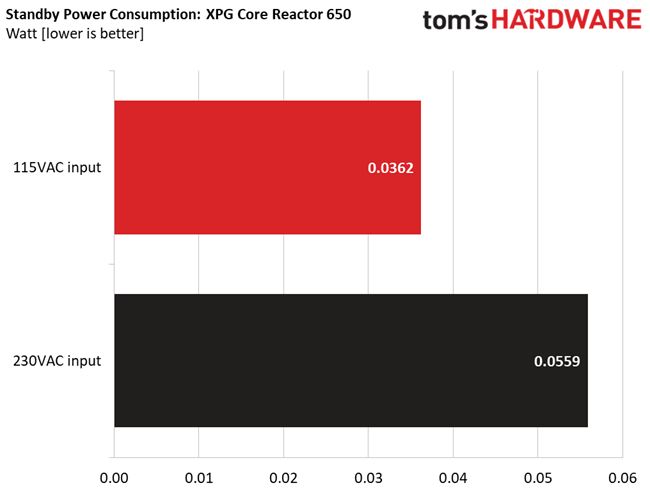
Results 21-22: Vampire Power
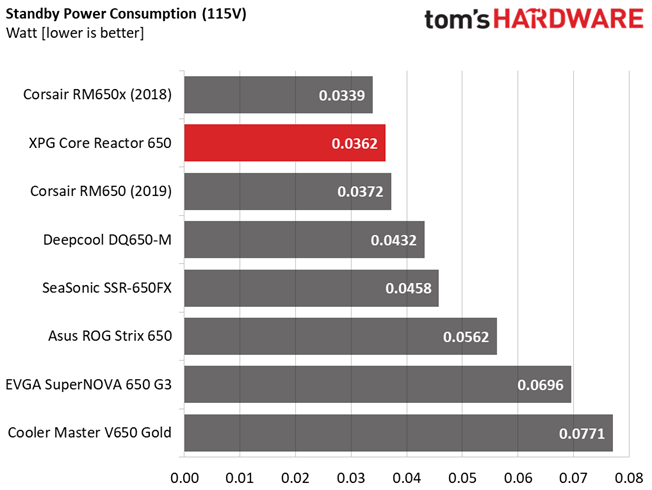
The vampire power levels are kept super low.
Fan RPM, Delta Temperature, And Output Noise
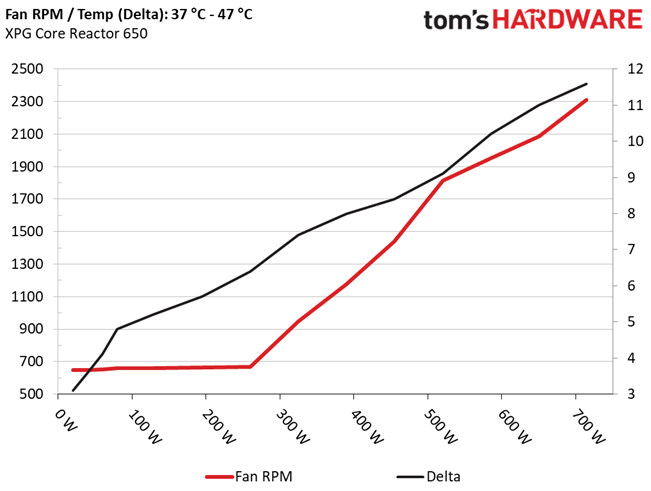
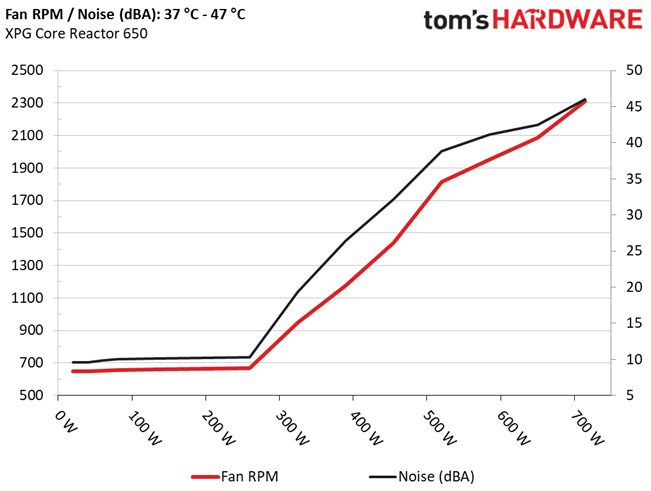
All results are obtained between an ambient temperature of 37 to 47 degrees Celsius (98.6 to 116.6 degrees Fahrenheit).
The fan profile is anything but aggressive.
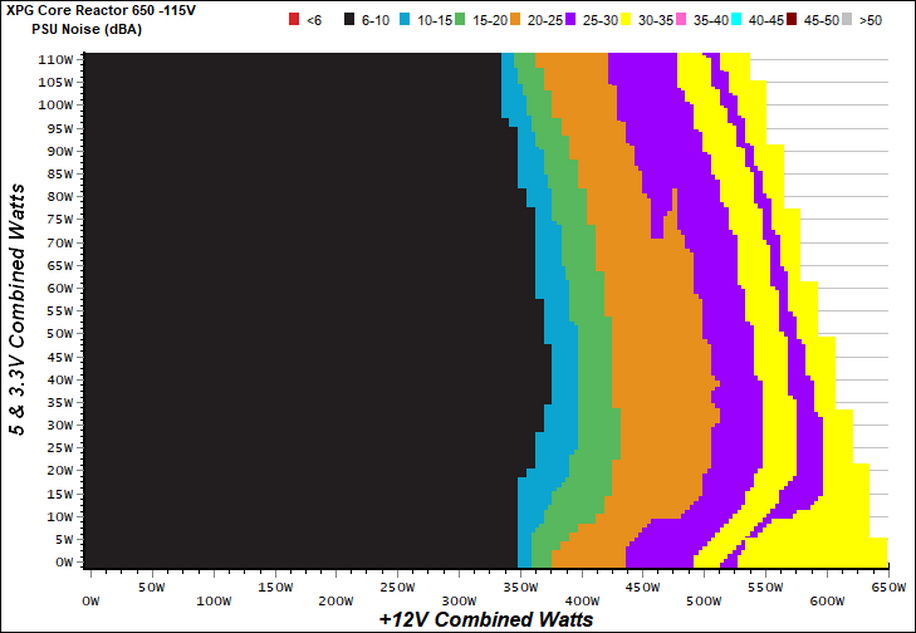
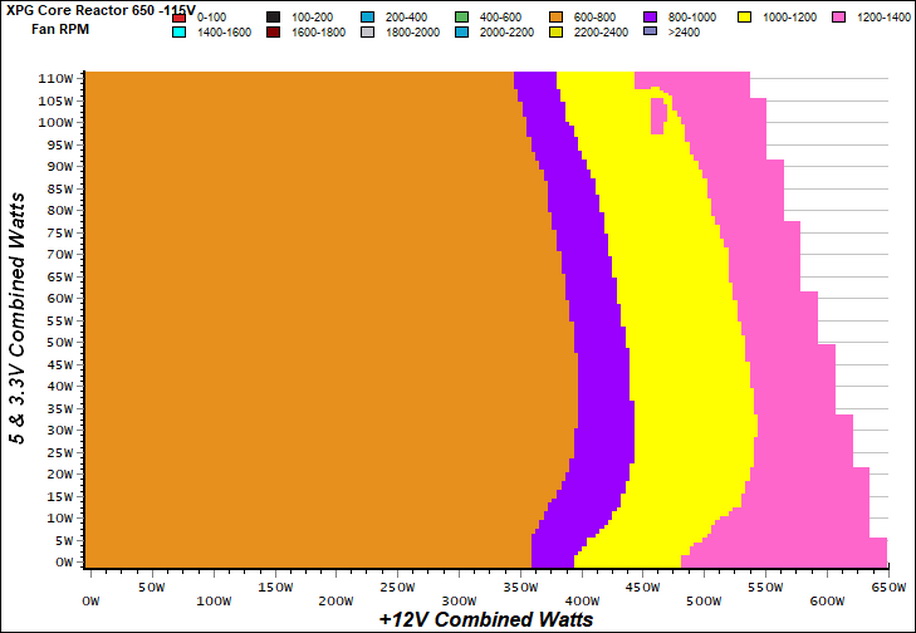
The following results were obtained at 30 to 32 degrees Celsius (86 to 89.6 degrees Fahrenheit) ambient temperature.
The fan speed profile is super relaxed, at normal operating temperatures. You will only hear the fan spinning with higher than 500W loads.
MORE: Best Power Supplies
MORE: How We Test Power Supplies
MORE: All Power Supply Content
Current page: Load Regulation, Hold-Up Time, Inrush Current, Efficiency and Noise
Prev Page Specifications and Part Analysis Next Page Protection Features, DC Power Sequencing, Cross-Load Tests and Infrared Images
Aris Mpitziopoulos is a contributing editor at Tom's Hardware, covering PSUs.
