Adata Ultimate SU800 SSD Review
Why you can trust Tom's Hardware
Comparisons And Benchmarks
Comparison Products
We usually write a page for each capacity, but for this review, we include multiple SSD capacities in each chart. Adata set the tone with the Ultimate SU800 naming scheme and product placement, so we included a handful of high-performance SATA SSDs in the test pool. The mainstream 850 EVO and Corsair Neutron XTi join the Adata products in the tests. The Crucial MX300 represents the entry-level market and gives us a direct comparison between the Marvell and SMI controllers operating with the same 3D NAND.
Sequential Read Performance
To read about our storage tests in-depth, please check out How We Test HDDs And SSDs. We cover four-corner testing on page six of our How We Test guide.
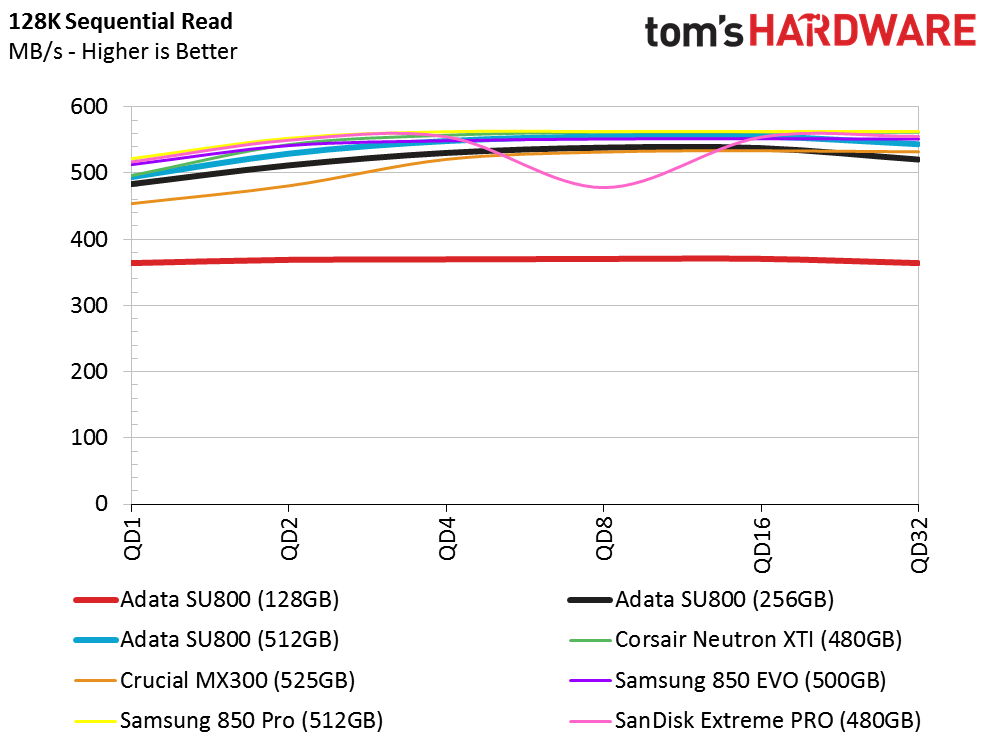
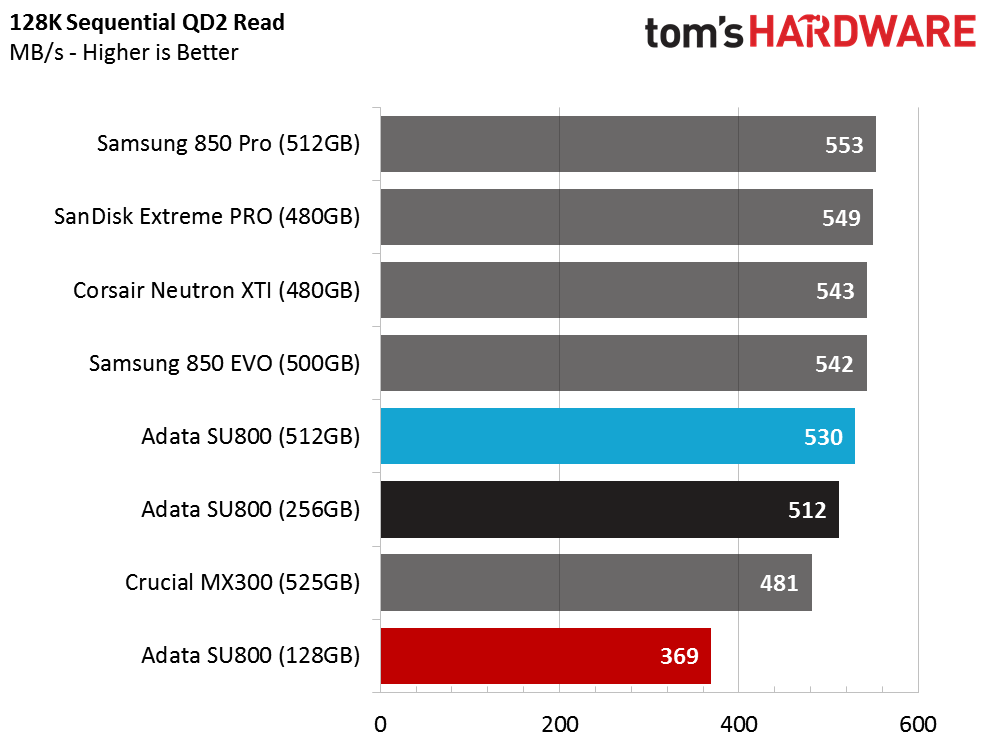
Even though Adata rated all three of the models for 560 MB/s sequential performance, the chart makes it clear that is not the case. The 128GB Ultimate SU800 delivers much less performance than the two larger drives.
Sequential Write Performance
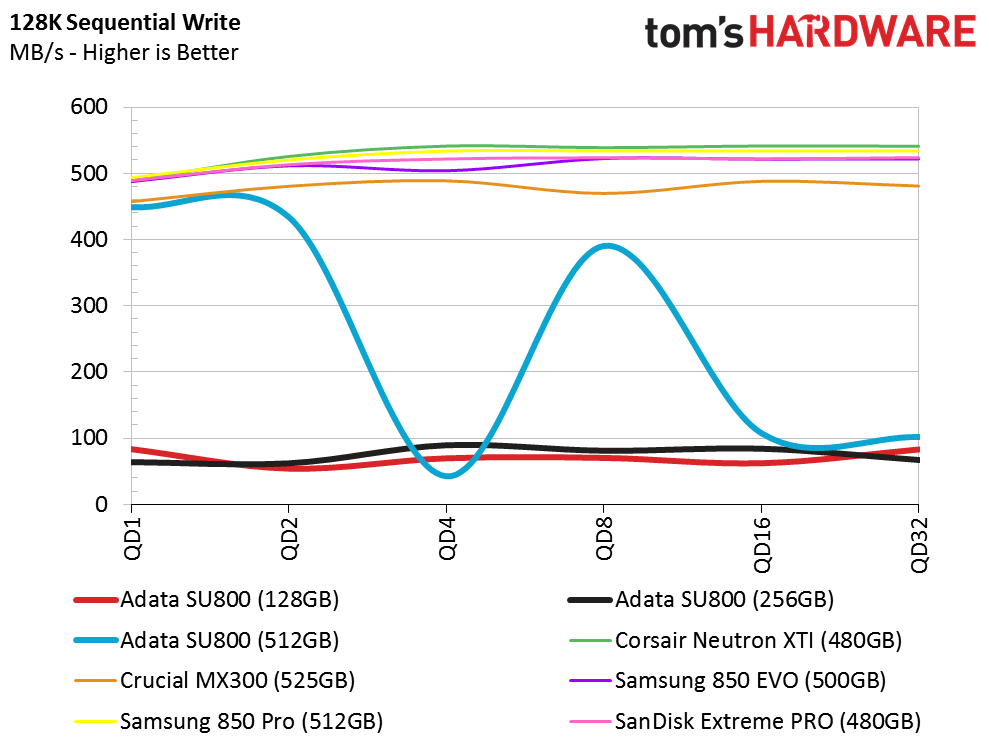
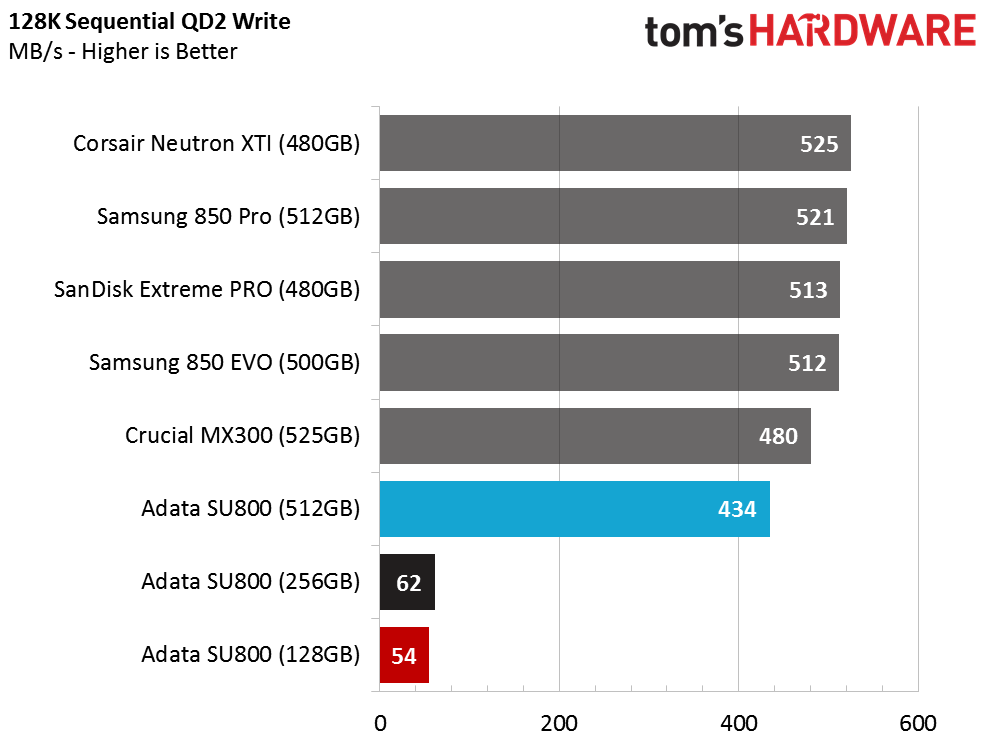
It's déjà vu all over again. These performance results are reminiscent of the Intel 600p with the SMI SM2260. Even though the Ultimate SU800 has a massive SLC buffer, it takes quite a while to flush the data to the slower TLC area of the flash. The SU800's performance drops significantly when the buffer is full on the smaller Adata SSDs. Even though we designed this test primarily for MLC flash, it still doesn't write enough data to fill the large buffer on the 512GB model.
Sustained Sequential Write
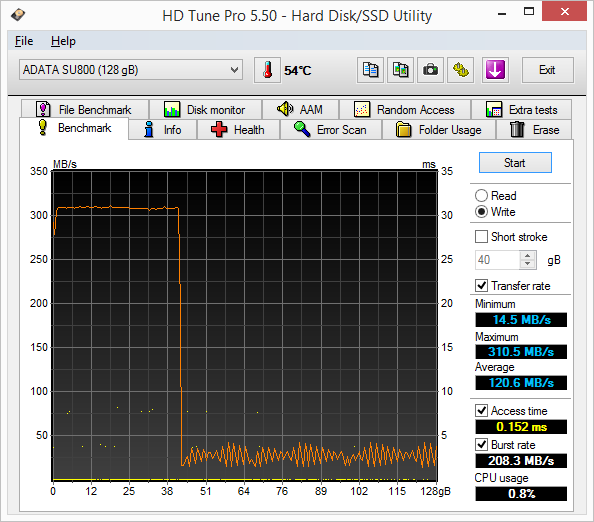
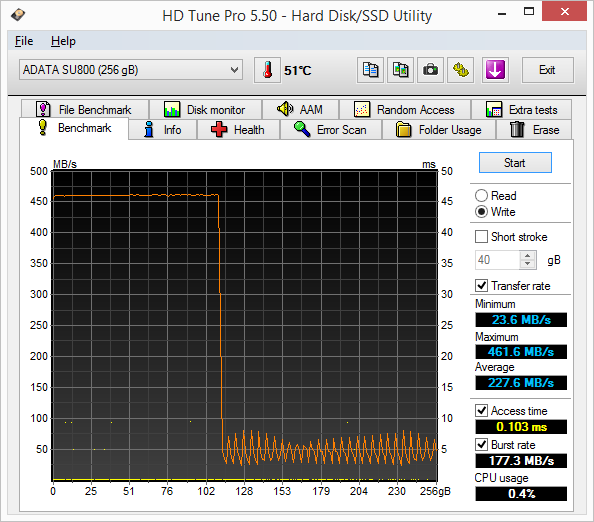
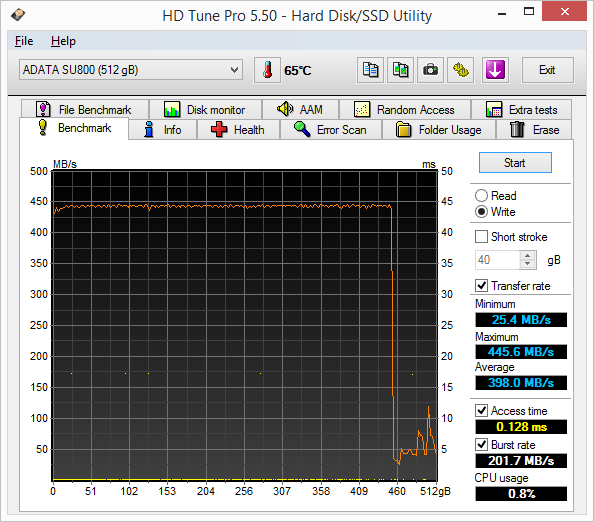
Like the 600p, if we subject the SU800 to a workload that saturates the buffer it results in abysmal sequential write performance. The HD Tune Pro write test is the first we perform on any drive. We use this test to check the initial SLC buffer size, and also to begin the wear processes that bring the SSD into a used state.
Random Read Performance
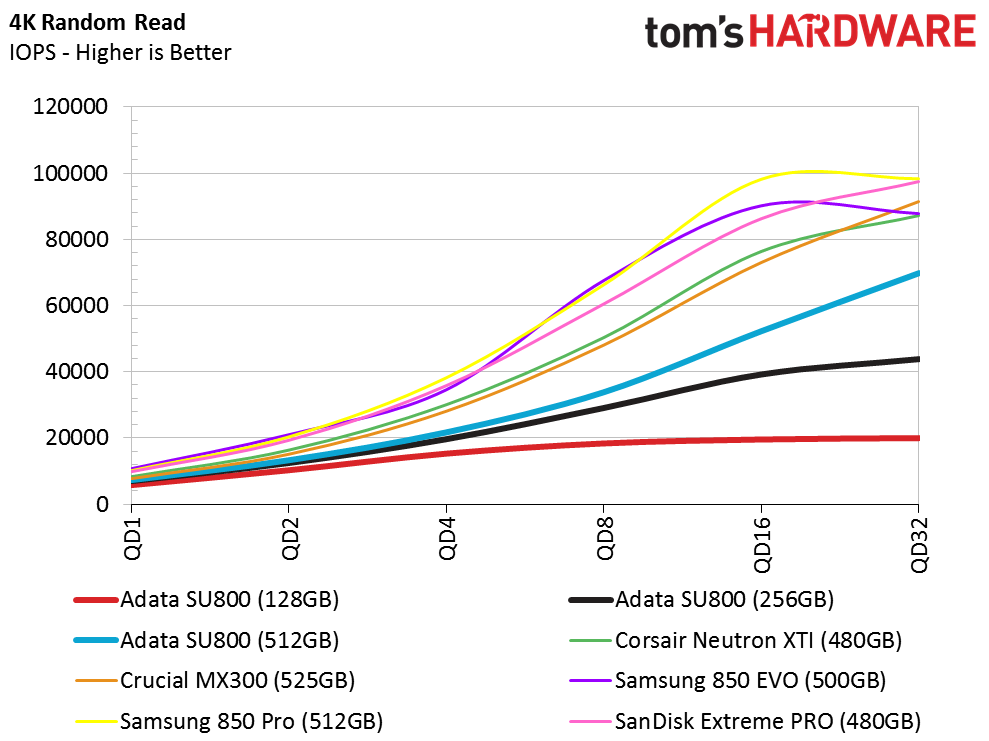
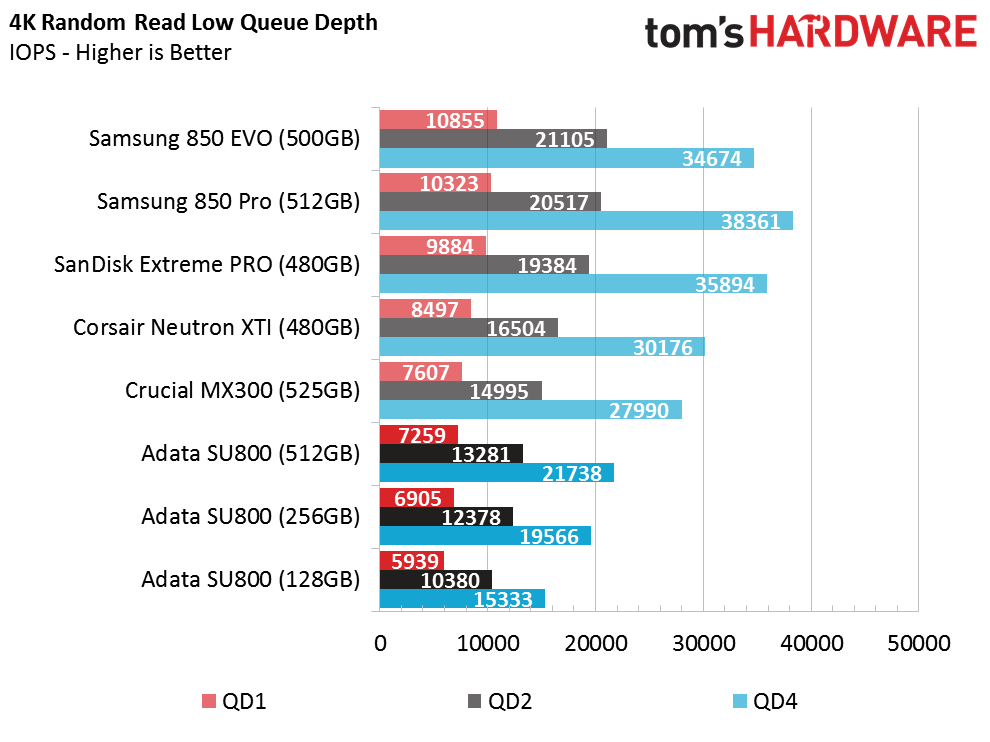
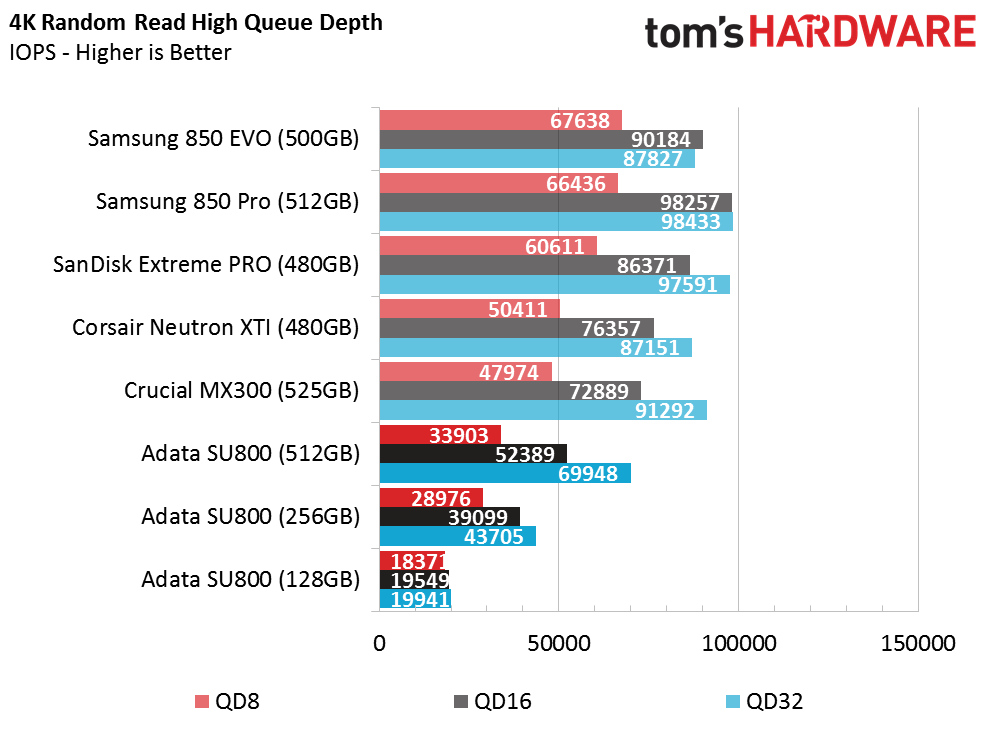
The random read performance isn't much better. Adata used one of the many one-click test applications to measure 4-corner performance. Unfortunately, programs like ATTO and Crystal Disk Mark only report the highest recorded measurement during the test period. That means the drive may deliver an 80,000 IOPS burst for a split second. Performance will appear great even if the rest of the test occurred at a much lower speed.
The random read performance from the SU800 SSDs is underwhelming.
Get Tom's Hardware's best news and in-depth reviews, straight to your inbox.
Random Write Performance


I'm almost at a loss for words when it comes to the random write performance. The Ultimate SU800 is faster than a hard disk drive, but this shouldn't be advertised as "Ultimate," a flagship, or anything special, for that matter. The drive uses 3D NAND, but that no longer means high performance is a sure thing.
80 Percent Sequential Mixed Workload
We describe our mixed workload testing in detail here and describe our steady state tests here.
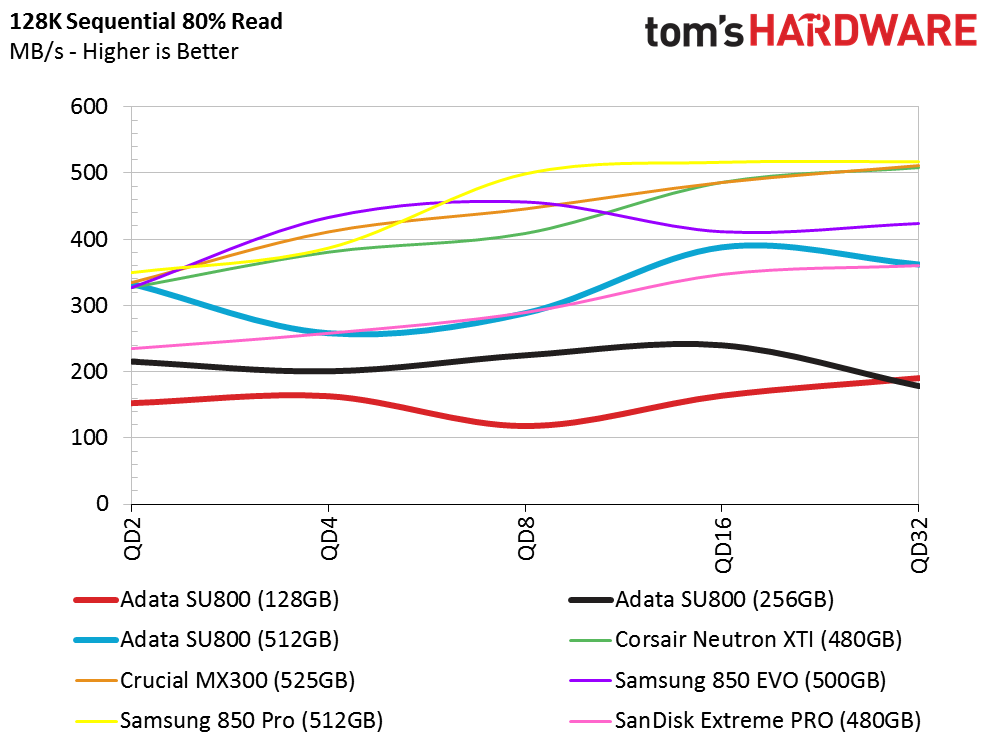
Surprisingly, the sequential mixed workload with 80% reads doesn't look too bad for the SU800 512GB. The performance isn't consistent, but it's much higher than we expected. The SLC buffer works better with mixed bursts. Bursty workloads are more representative of the way we use our computers, except for the brief times we transfer large files.
80 Percent Random Mixed Workload
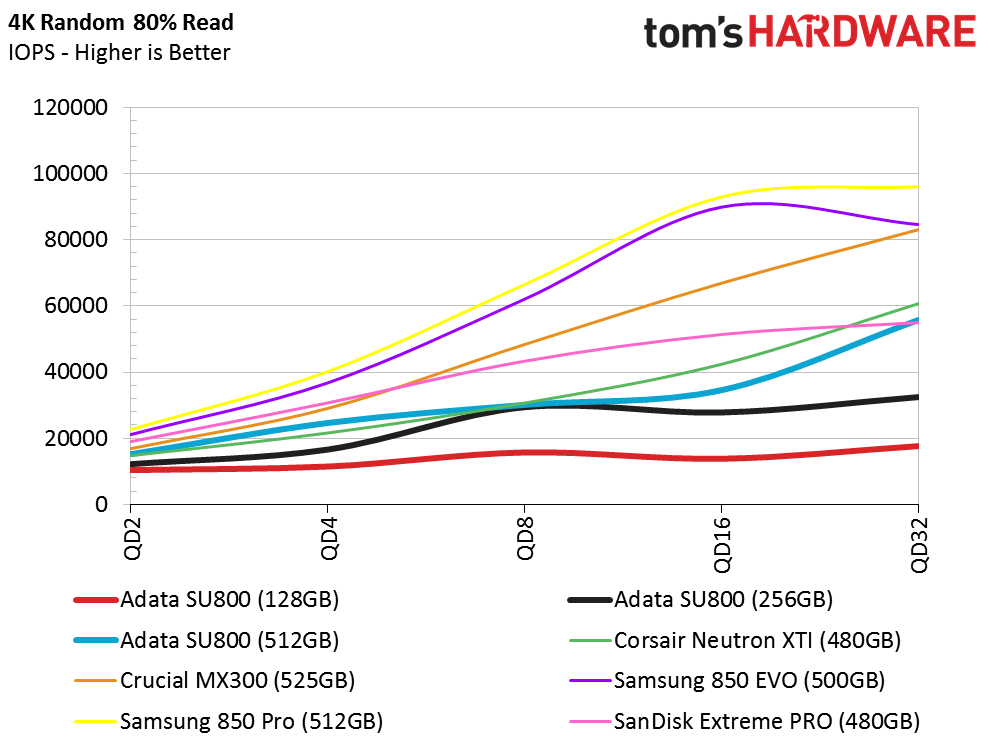
The SU800 512GB also performs better with mixed random data than the four-corner tests (random read/write, sequential read/write) led us to believe. The two smaller capacities have much lower performance. This won't be a surprise if you read our SSD reviews on a regular basis; it's an industry-wide issue. The manufacturers conveniently omit performance with mixed workloads in four-corner specifications.
Sequential Steady-State
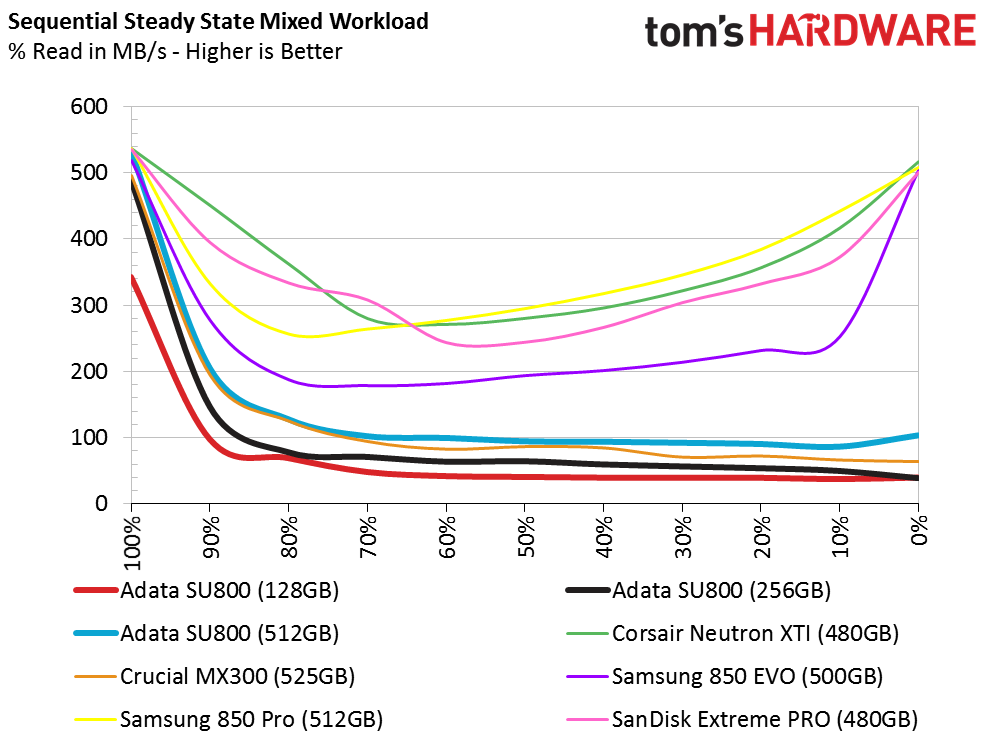
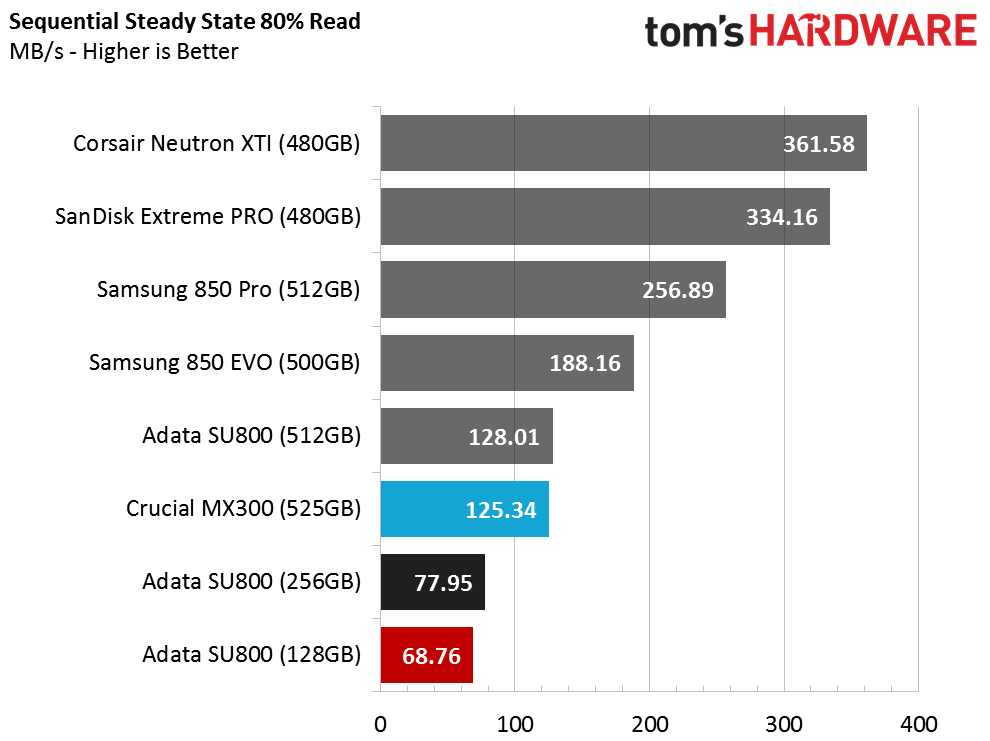
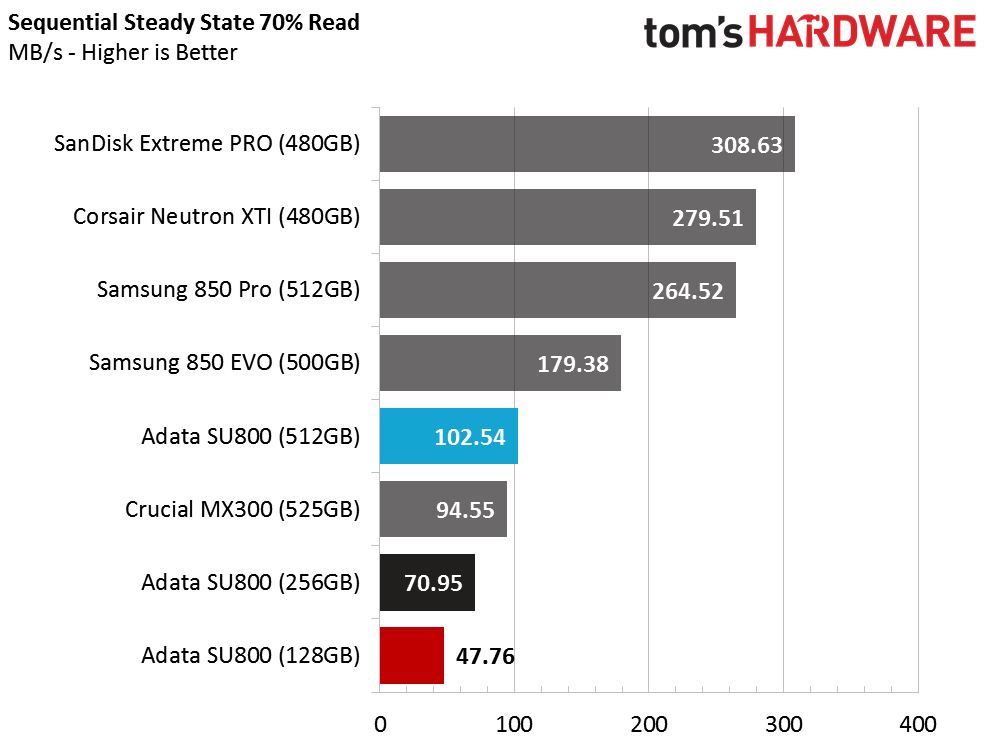
The sequential steady state test reveals several interesting characteristics. Every SSD on the chart with Micron 384Gbit TLC NAND drops into steady state and doesn't recover during the write portion of the chart. Our mixed workload test actually occurs in reverse, with the write-centric portion of the workload occurring before we mix in more random read data. The Micron 3D drives reach a steady-state condition and fail to recover until the test progresses into a heavy read environment.
The difference in performance between the Samsung 850 EVO, also with 3D TLC, and the Micron 3D products is also interesting. The 850 EVO has been the mainstream SSD standard for more than two years now, and it's easy to see why.
Random Steady-State
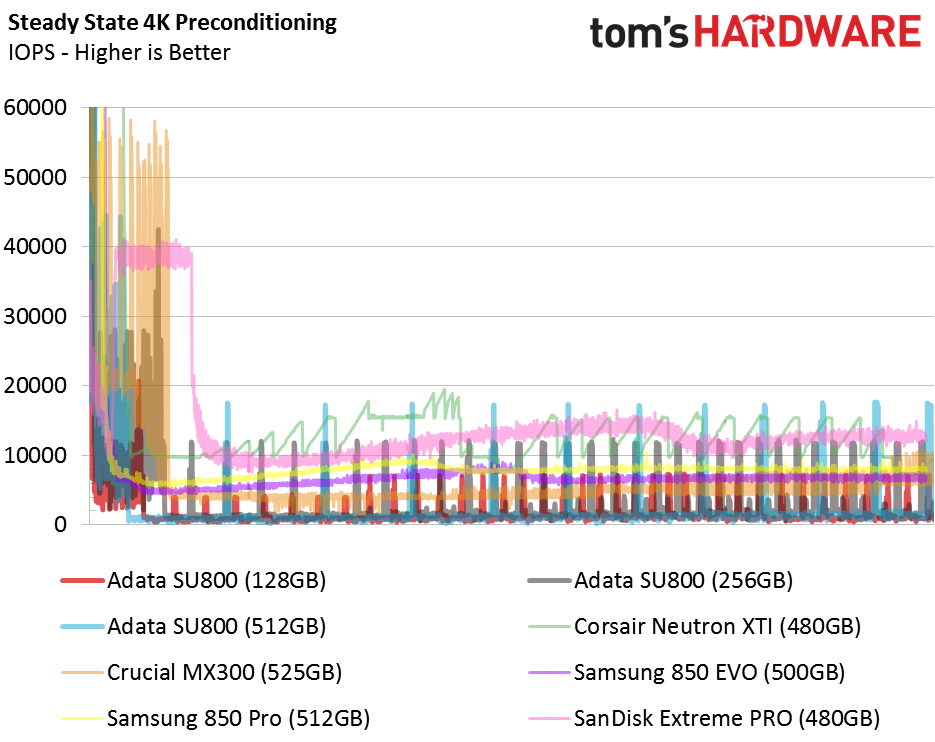
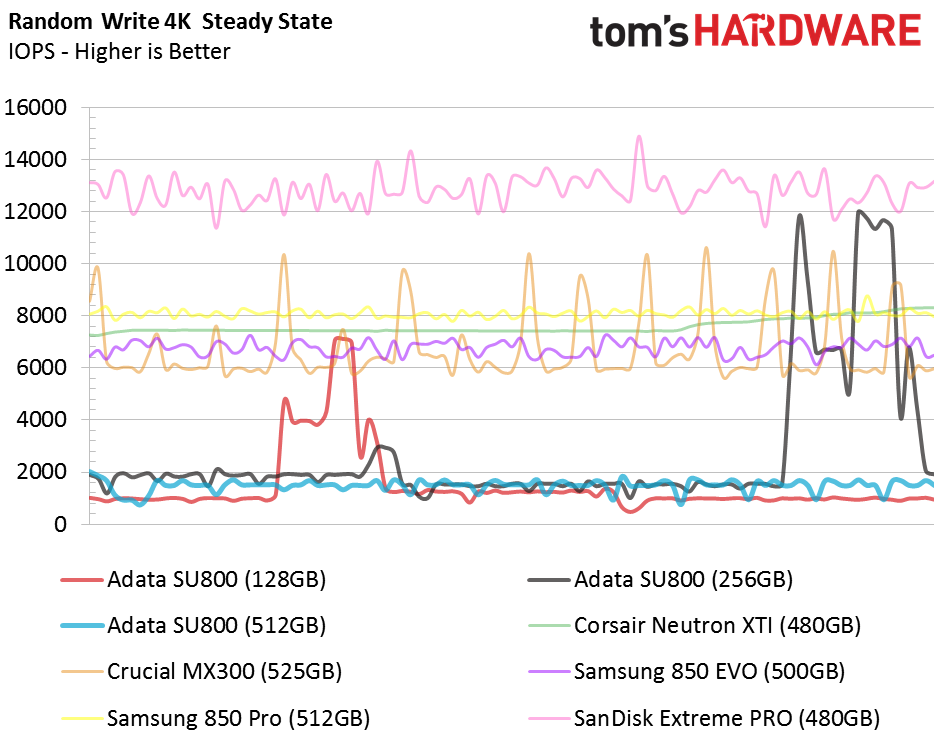
For what it is worth, the Ultimate SU800 SSDs are fairly consistent in steady-state during a random write workload when the SSD is writing to a full buffer. The performance is consistently low, though. We measured around 2,000 random write IOPS for the 256GB and 512GB models. The 128GB model delivered roughly 1,500 IOPS.
PCMark 8 Real-World Software Performance
For details on our real-world software performance testing, please click here.
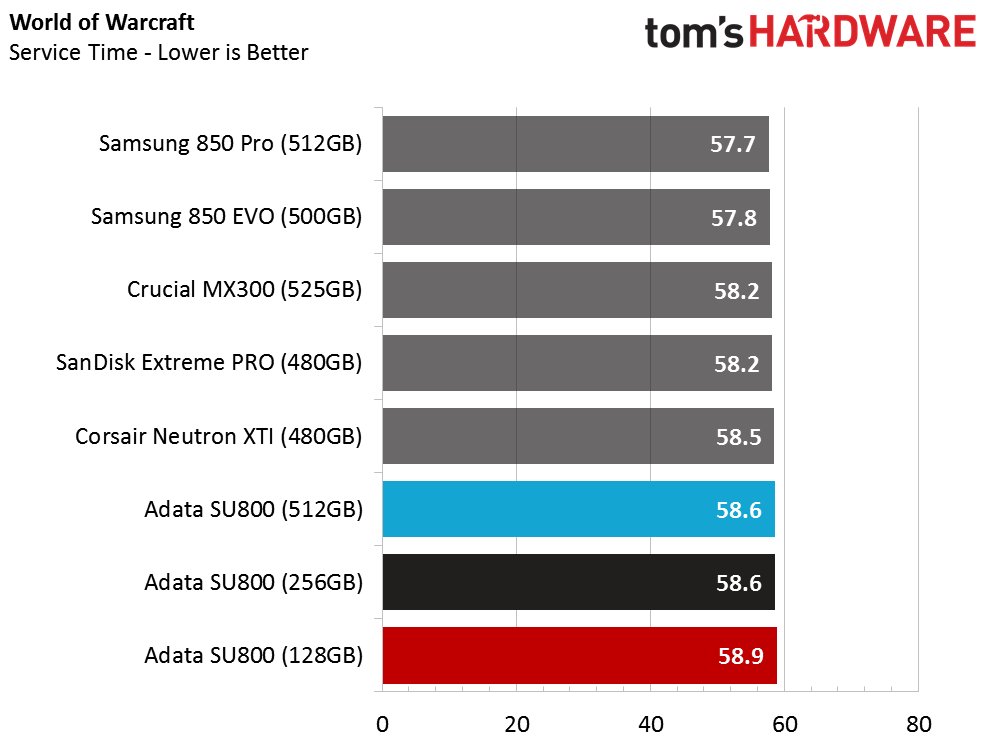
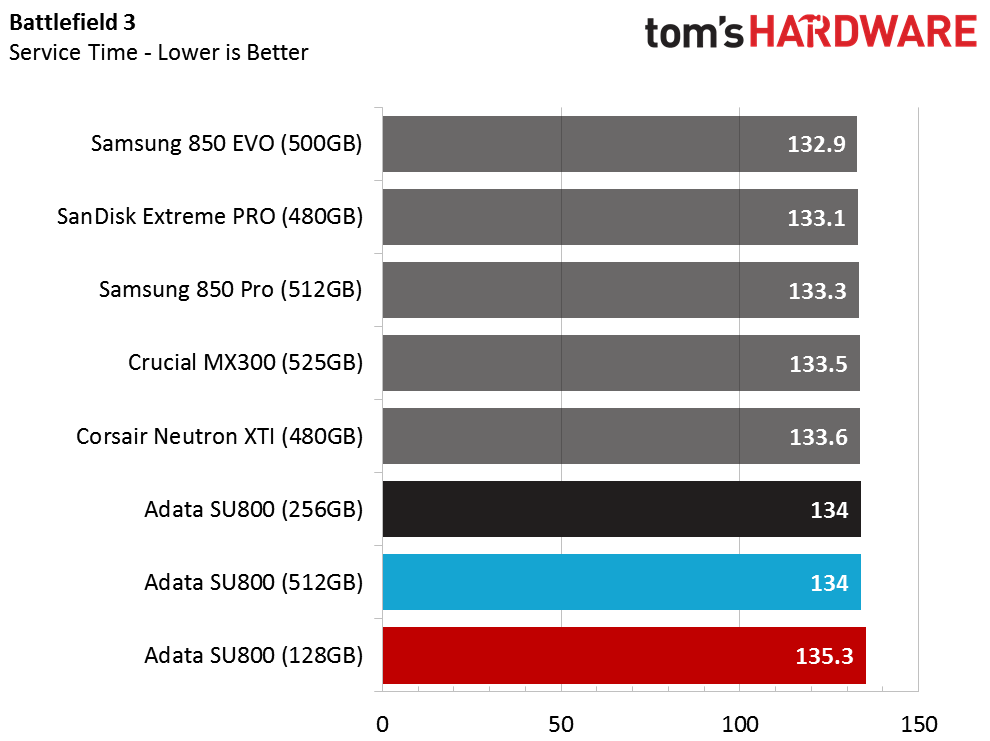
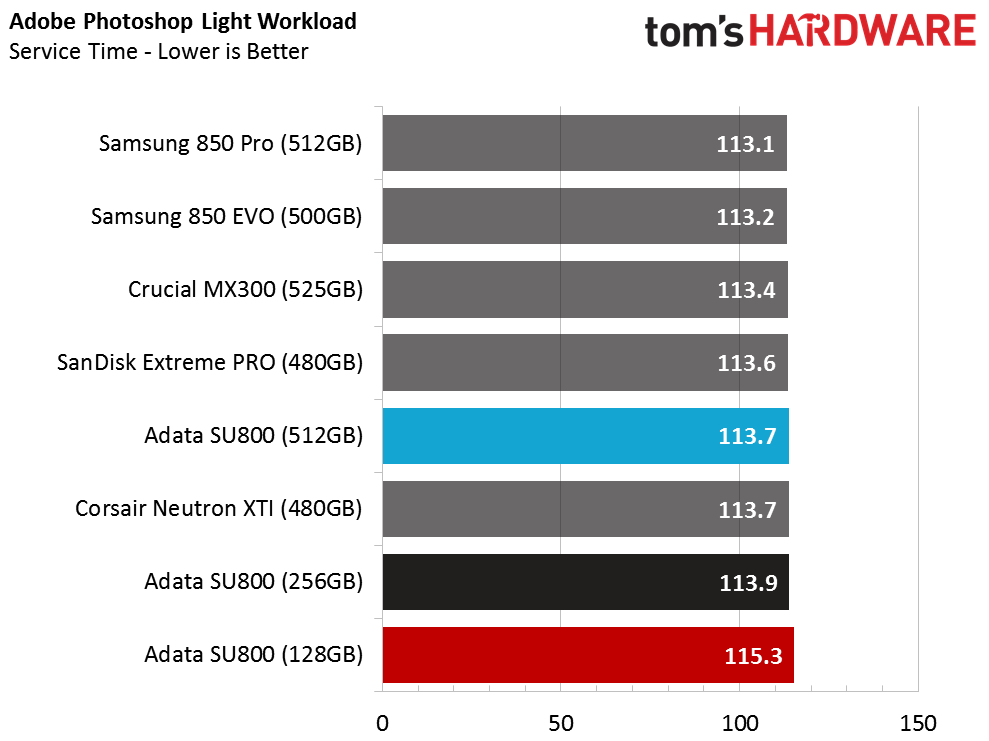
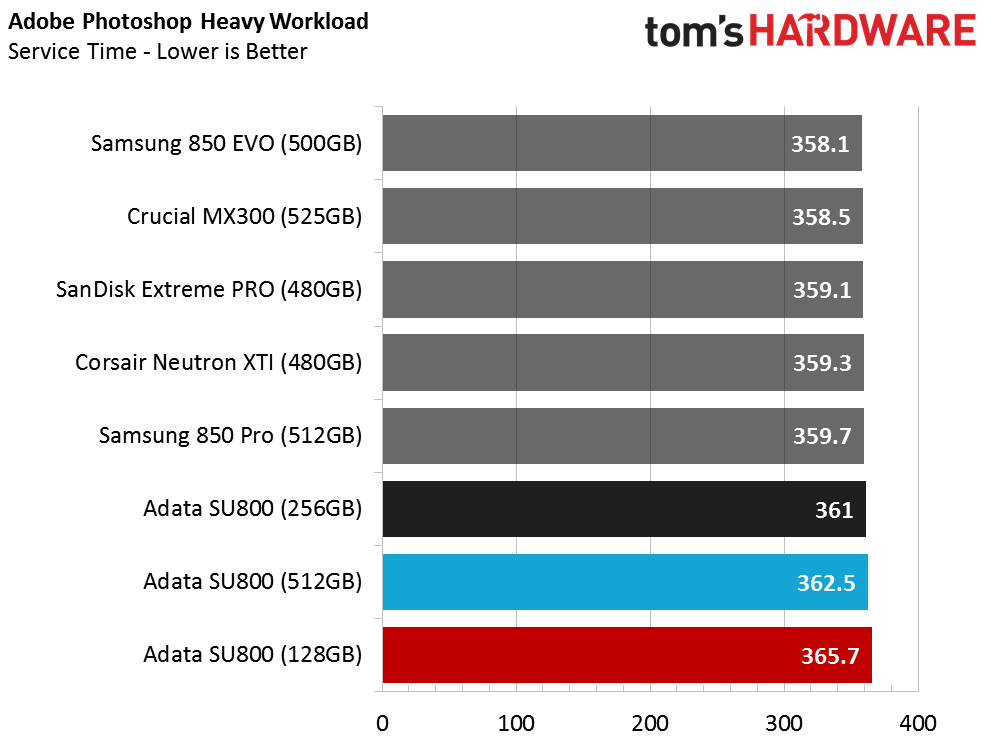
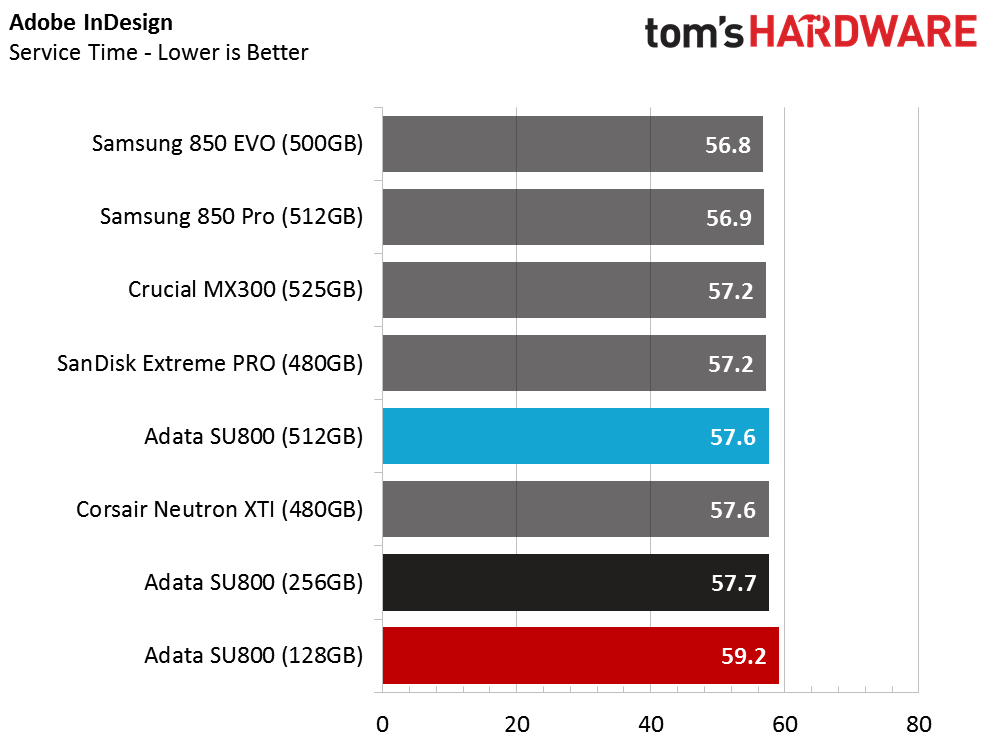
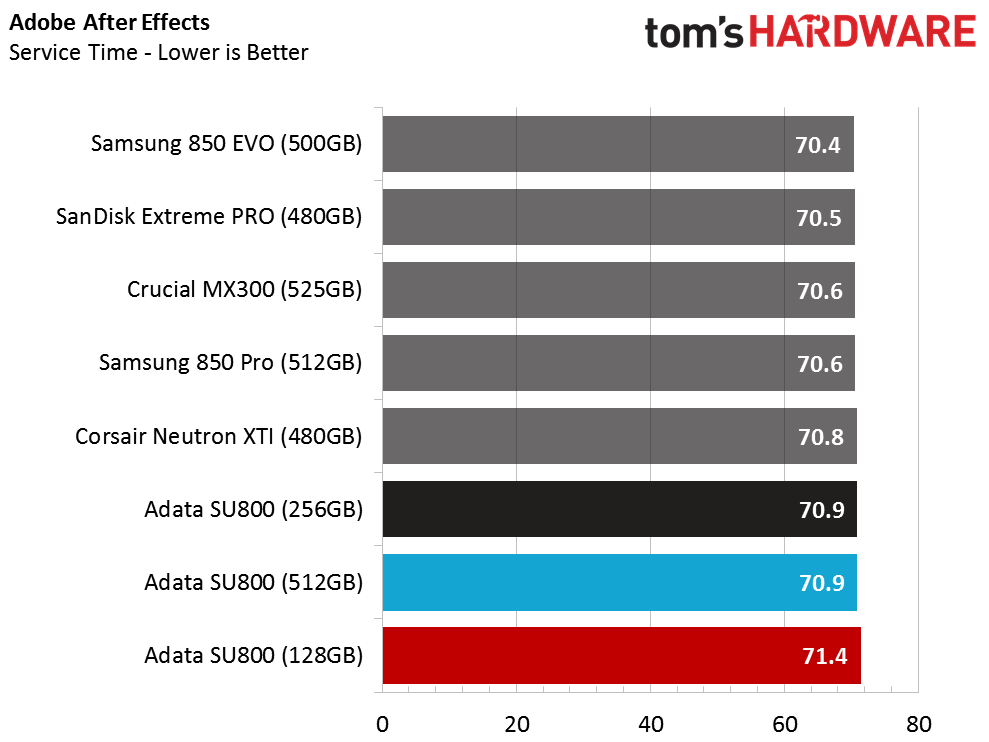
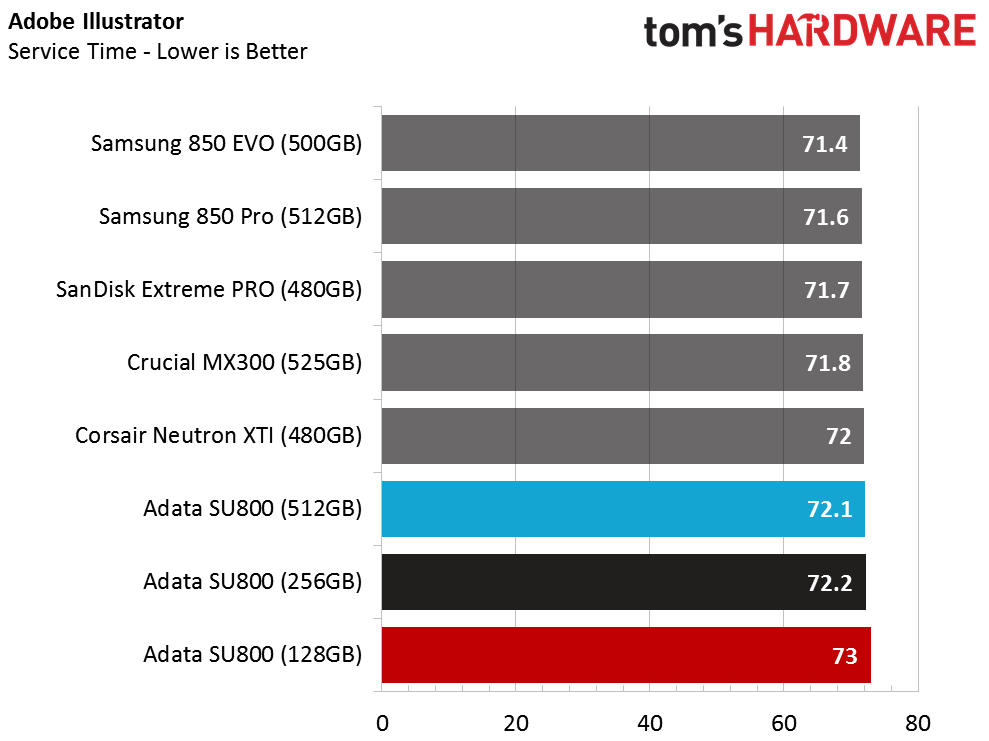
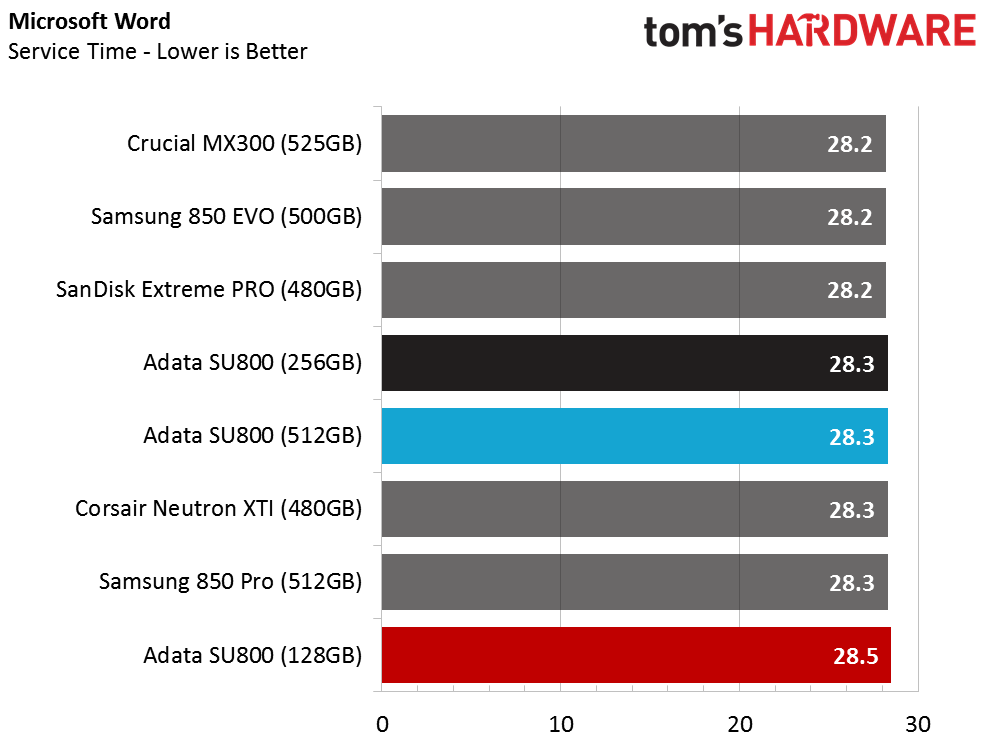
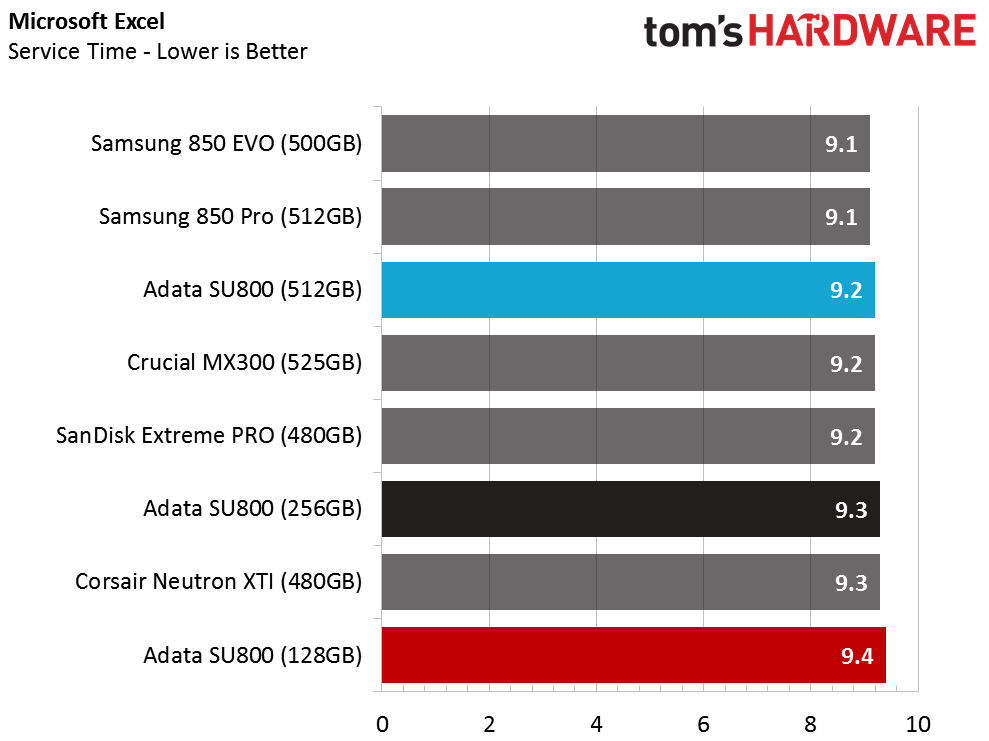
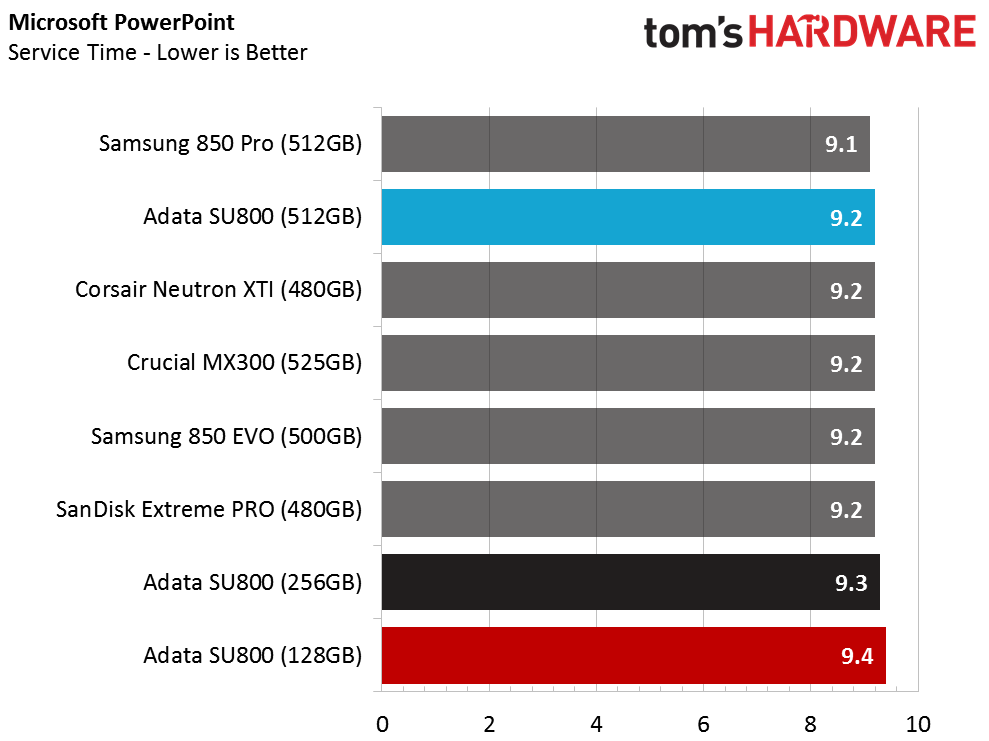
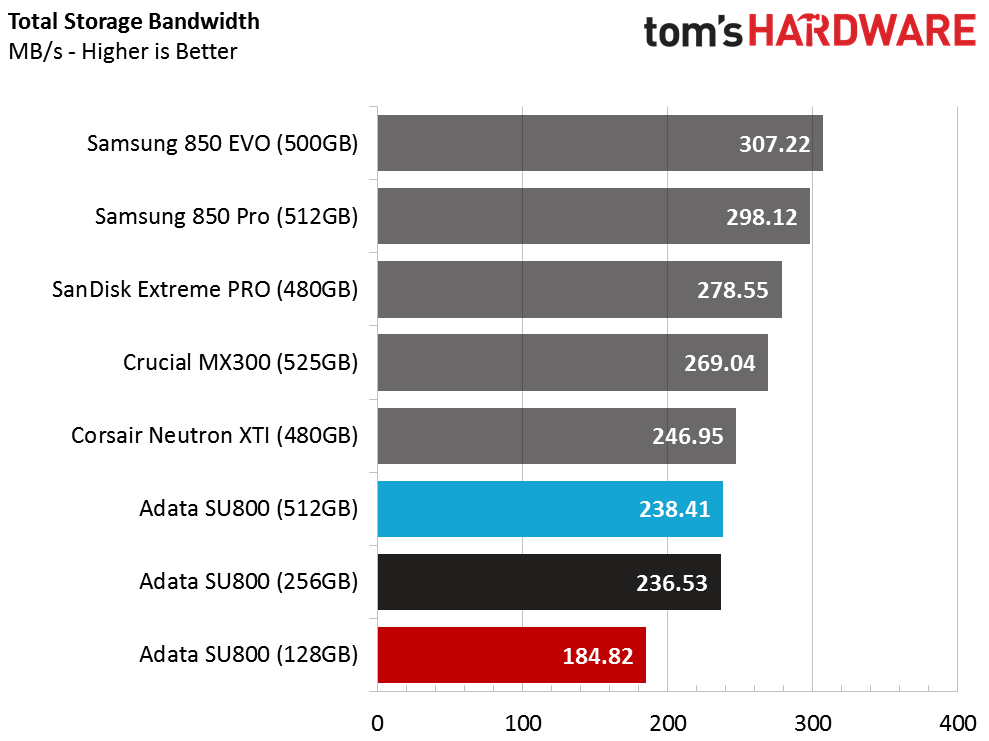
If you still had any doubts about the Adata Ultimate SU800's performance, the real-world application tests should clear them up. We found the SU800's at the slower end of many tests.
Application Storage Bandwidth
Even the Crucial MX300 525GB outperformed the Ultimate SU800 512GB, which is a problem. The reference design we tested with the same controller performed better than the retail Adata SSDs. At some point, Adata changed the firmware in a way that degraded performance.
PCMark 8 Advanced Workload Performance
To learn how we test advanced workload performance, please click here.
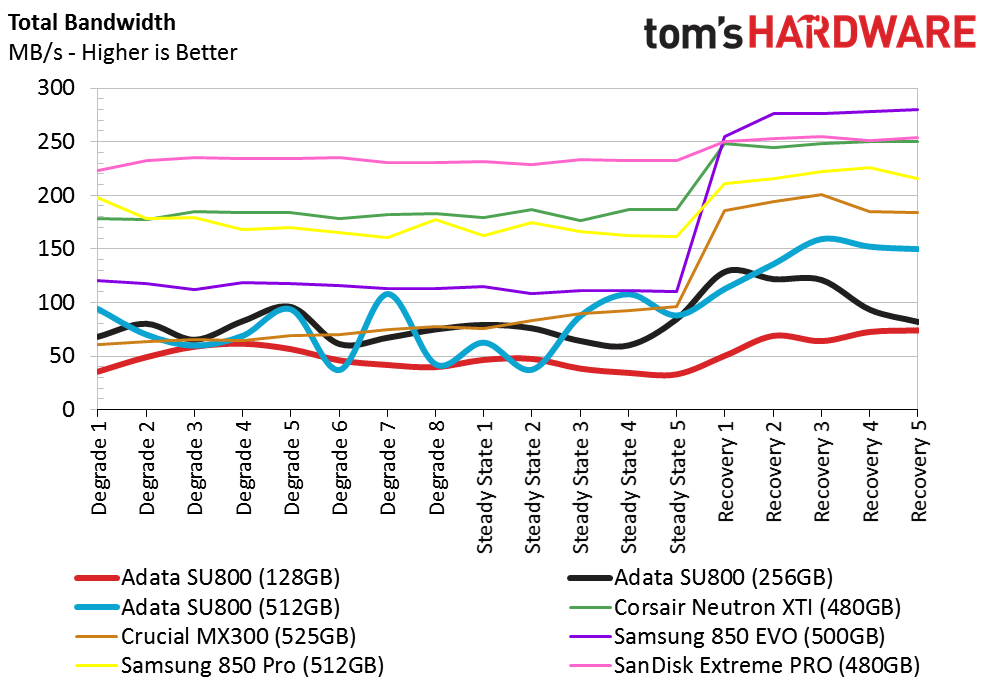
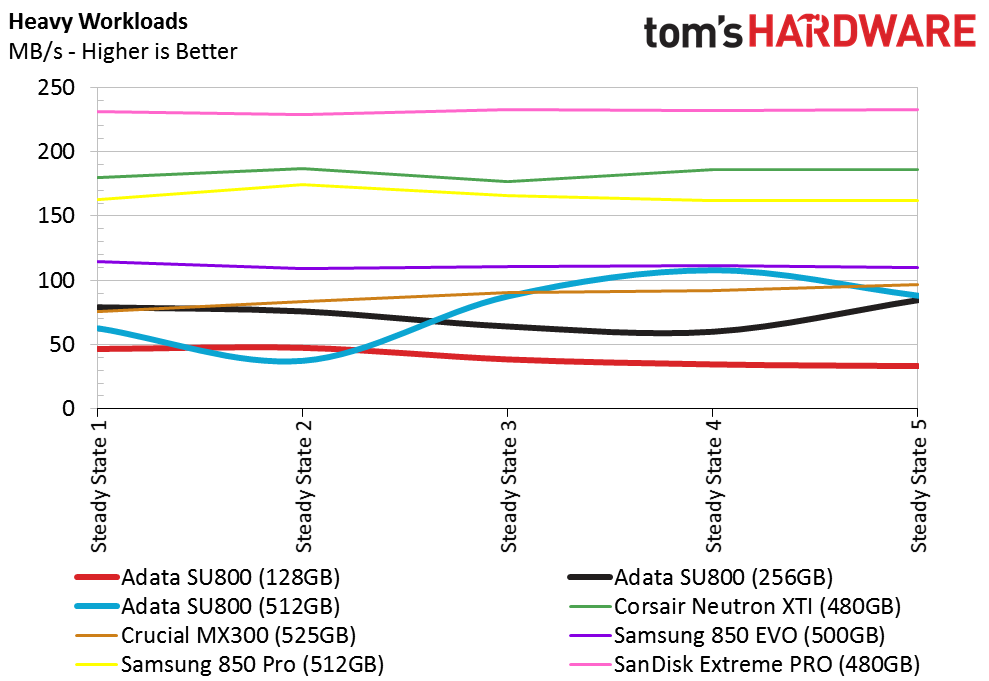
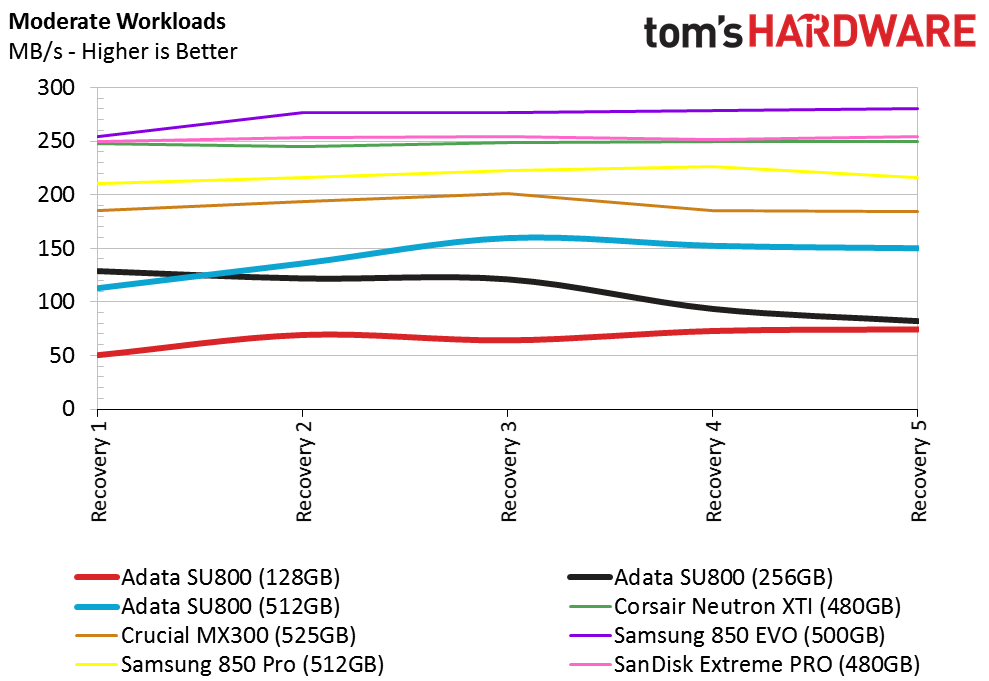
The Adata Ultimate SU800 has a difficult time recovering from heavy use--even with the enormous SLC buffer that takes up one-third of the raw capacity. We noticed earlier in the review that the SSD could only write to the TLC portion of the NAND at ~25MB/s. With such a large buffer, it would take a very long time to flush all of the data to the TLC area.
Total Service Time
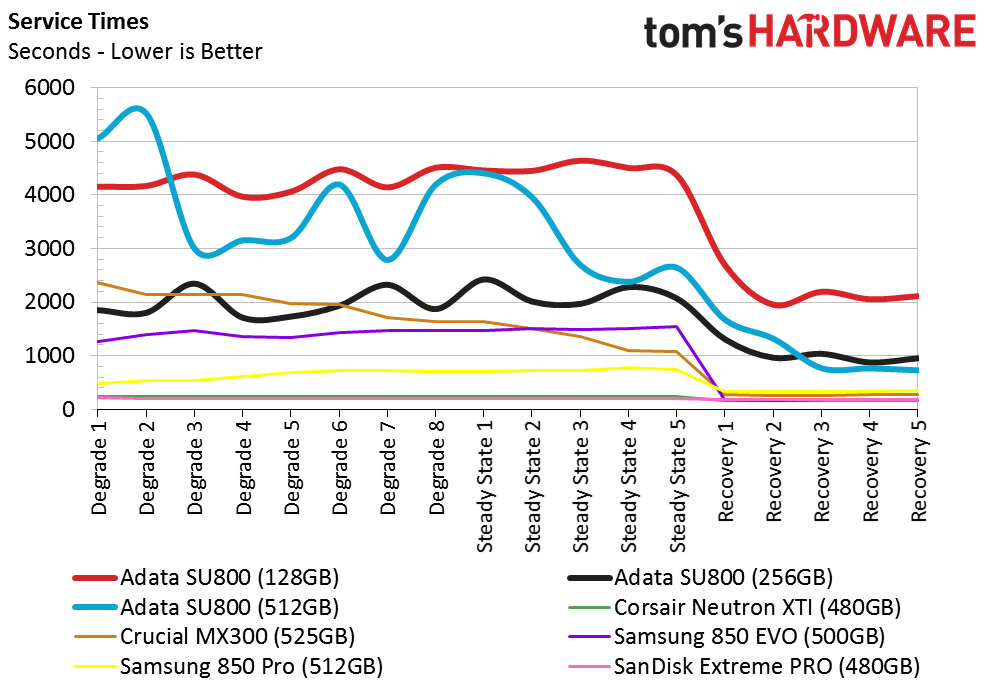
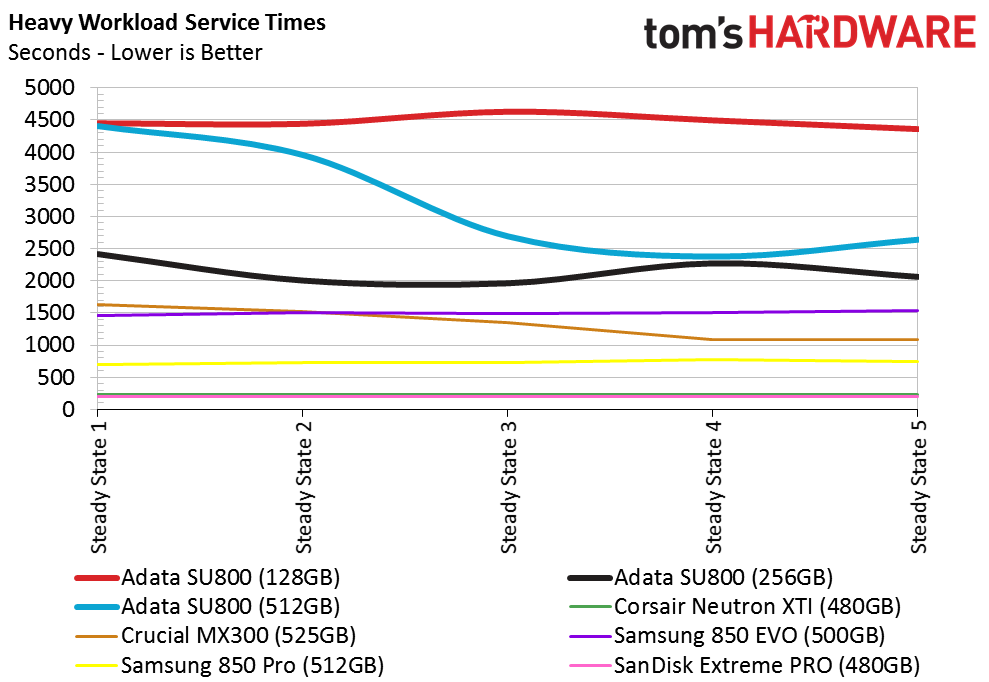
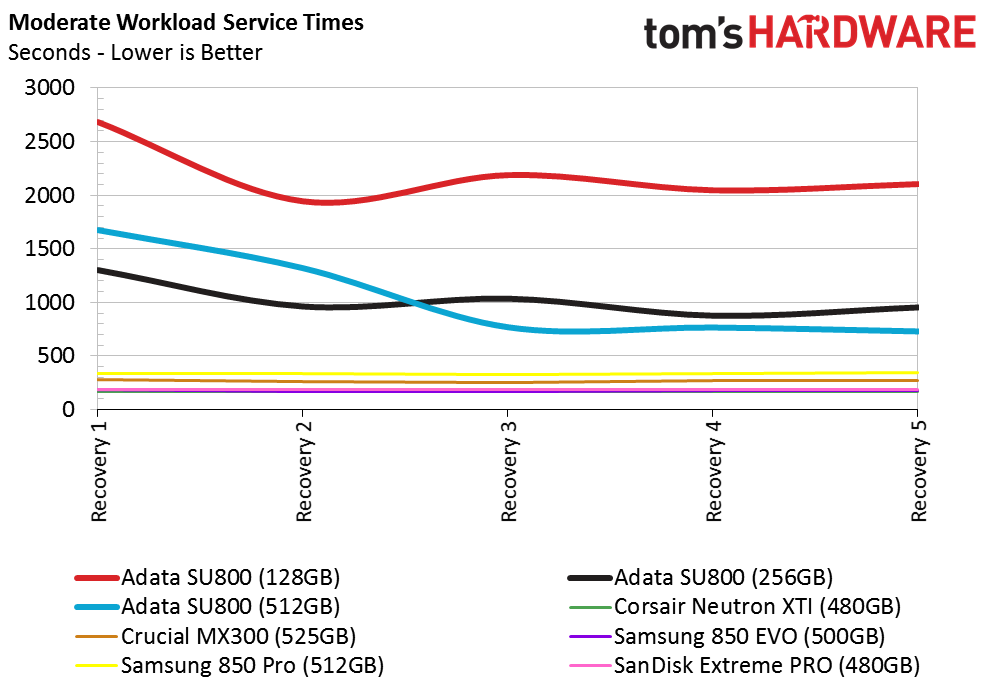
The service times are very high regardless of the workload we throw at the Adata Ultimate SU800. We also had this problem with the Intel 600p and the Crucial MX300 SSDs. Before a new firmware reeled in the latency, the MX300 Special Edition 750GB was even worse than the Adata drives. Crucial was able to address the high latency issue with a firmware update. Hopefully, Adata can dedicate more resources to do the same.
Disk Busy Time
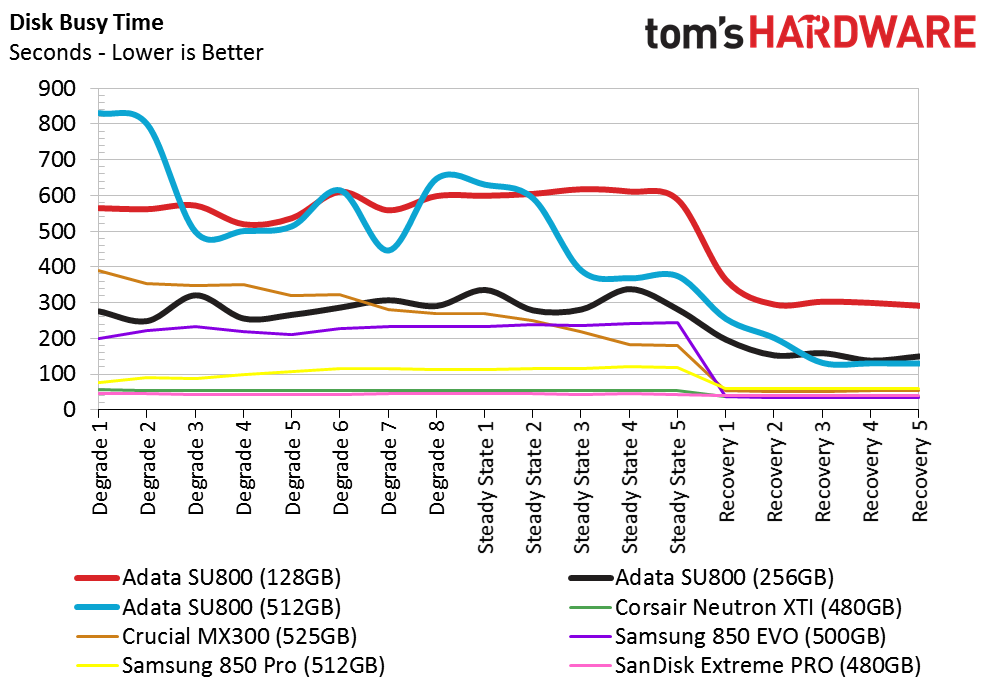
I found it odd that the Adata Ultimate SU800 256GB performed better than both the larger and smaller models in a few of our extended tests. Adata may need to do some additional firmware optimization to streamline the buffer operation. Writing data directly to the TLC is actually faster after the SLC buffer is full, and Adata should consider implementing a direct-to-die write scheme. This technique allows the SSD controller to skip writing to the SLC buffer when it is full, which removes the need for the additional data flush to the TLC NAND.
Notebook Battery Life
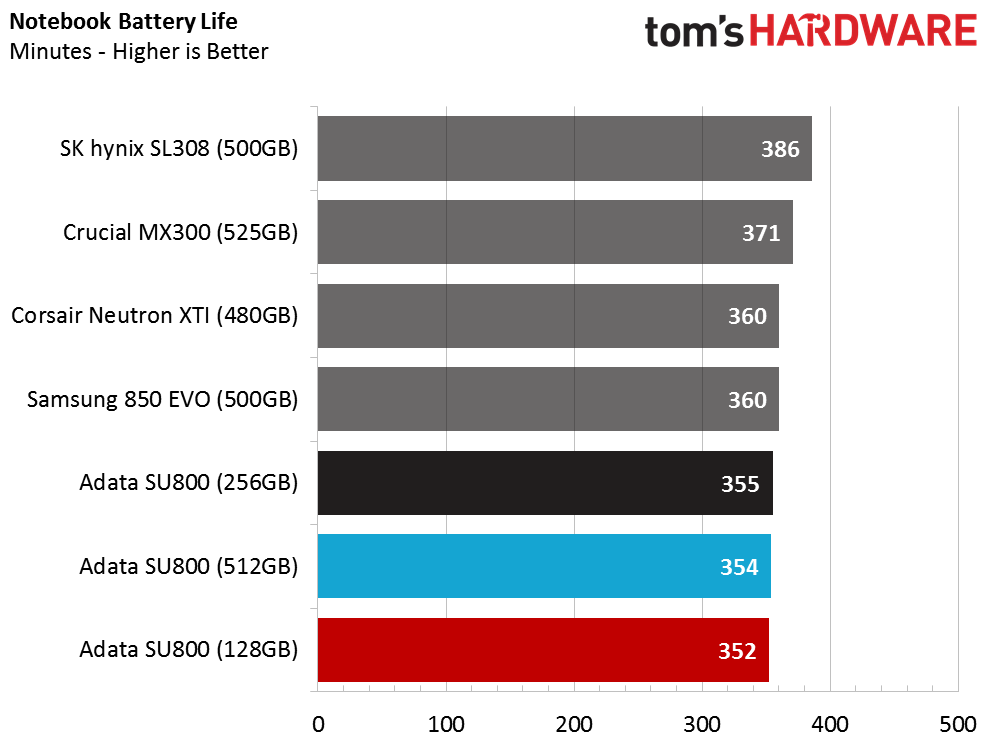
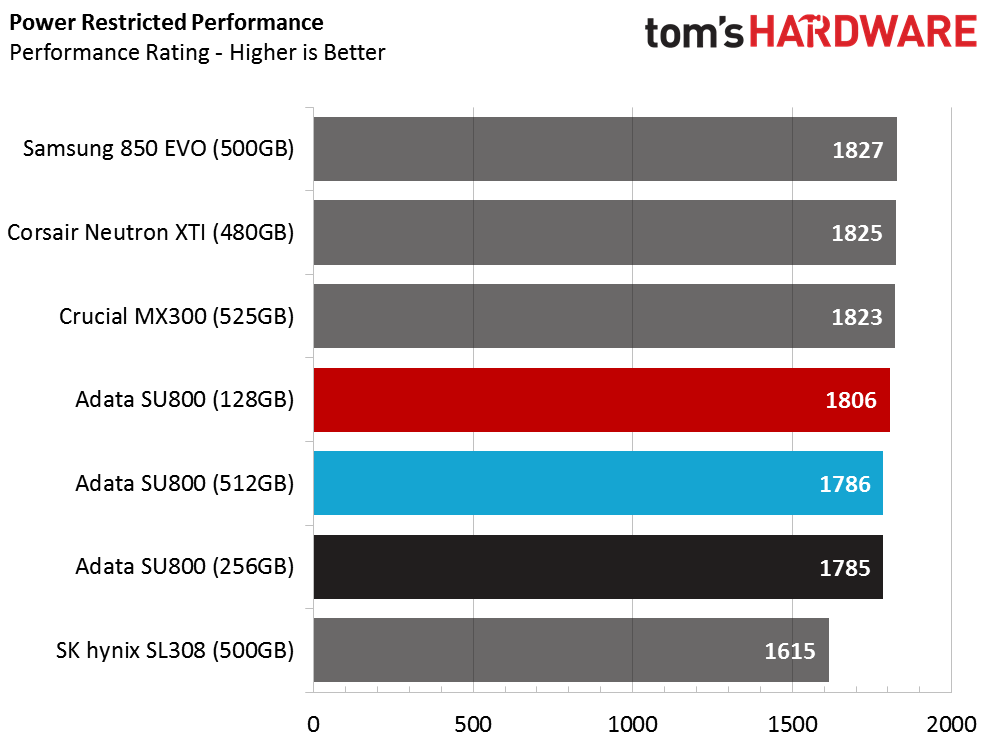
Due to the SU800's poor disk busy time measurements, we didn't expect too much from the SSD during the notebook battery life test. The three drives performed slightly better than we expected, but they are still on the low end of the chart. Notebooks place the CPU, system memory, and DMI link into a reduced power mode while it is on battery power. This equalizes performance for many of the SSDs in the chart, but the SU800 would be much less competitive when it is on battery power.

Chris Ramseyer was a senior contributing editor for Tom's Hardware. He tested and reviewed consumer storage.
-
TbsToy Maybe you guys should start combining your SSD and power supply reviews. Two mints, two mints in one 'Hey, look what we have today.'Reply
W.P. -
HERETIC-1 Chris, Good honest review.Reply
Question-Is there a benefit to over-provisioning compared to extra free space?
Example-256GB drive-156GB free space.
or 10GB OP and 146GB free space.
(boot drive-light duty) -
kalmquist The Micron 3D NAND has been a big disappointment. I haven't read anything about the performance of Toshiba's 3D NAND, but the lack of SSD's using it suggests that its performance may be even worse than Micron's. (Toshiba chose MLC planar NAND for their recently released VX500 series.) I'd like to see some company step up and put a little competitive pressure on Samsung.Reply -
CRamseyer Reply18951969 said:The Micron 3D NAND has been a big disappointment. I haven't read anything about the performance of Toshiba's 3D NAND, but the lack of SSD's using it suggests that its performance may be even worse than Micron's. (Toshiba chose MLC planar NAND for their recently released VX500 series.) I'd like to see some company step up and put a little competitive pressure on Samsung.
Toshiba's BiCS is at Gen 2 Awith 3 announced and used in the new iPhone. We have and article in rhe pipe that uses BiCS 2 in our upcoming 11 drive DRAMless roundup. Ir is only an engineering sample though. -
littleleo Ultimately a major disappointment. Lucky for them there is such a bad shortage on SSDs they will probably still sell plenty to the SSD hungry segment.Reply -
Nintendork Intel is a mess when they can't fix their problems with just money. AMD had tons of products stuck on 32nm A8 Phenom II-class APU, Bulldozer, Piledriver...Reply -
daglesj Would be nice if you asked the providers like ADATA for comment. I remember when everyone blasted the Kingston V300 SSDs but they are world class in comparison to a lot of the junk passing for an SSD today. On a side note I bought a lot of V300 SSDs and all of them have performed admirably. Tough little drives.Reply -
icester1973 Another Adata product with sub-par performance? Hardly surprising. Along with sub-par performance, you can expect HORRIBLE product support!Reply
My HP laptop was always returning an "Operating System Not Found" error upon every reboot since the Windows 10 Anniversary update with the SP600. None of my other systems with other brands of SSDs had this problem. Updated all the drivers, including ACHI and the problem persists. Tried to update the SP600's firmware -- nope! The updater wouldn't work! I pulled the drive and used a USB dock and a Windows 7 system and their updater wouldn't even see the drive even though it shows up in Explorer! What a mess!
Finally, I cloned the drive to a different brand and, behold!, all problems are solved! My wife even commented that the new drive was faster. -
LordConrad I understand why Intel and Micron use this NAND (because they're stuck with it), but why on earth would anyone else use it??Reply
