How We Test Smartphones And Tablets
Today, we outline the strict testing procedures used to obtain accurate data and discuss each test that we perform on smartphones and tablets.
Thermal Throttling
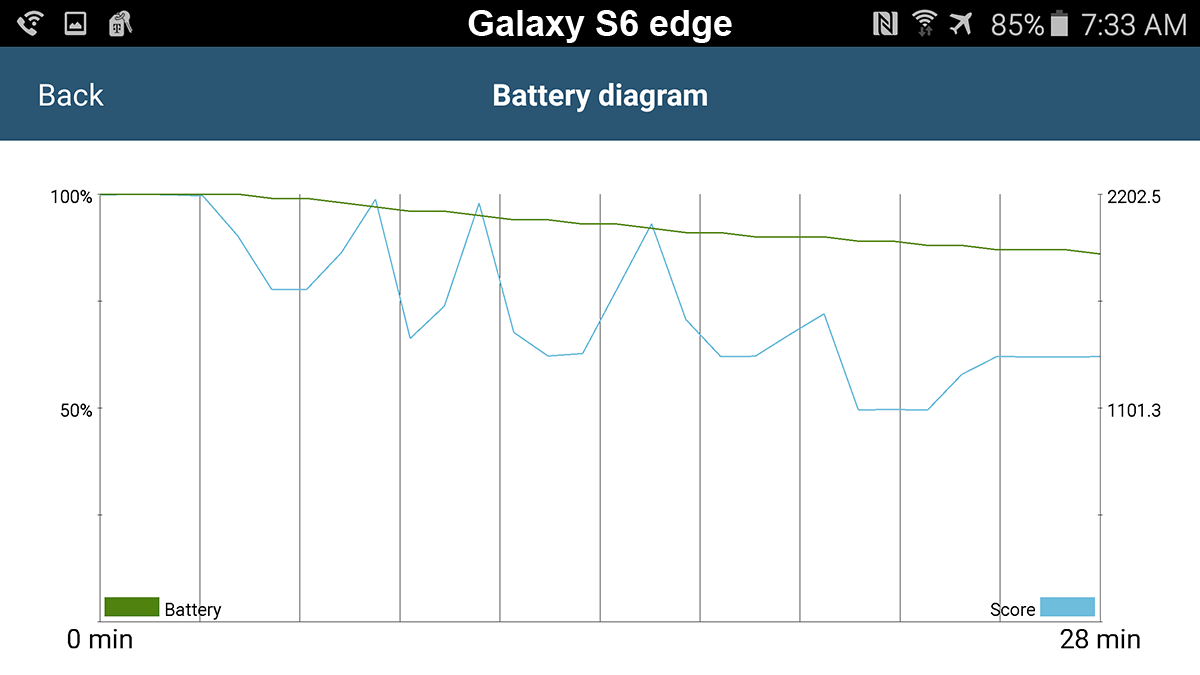
GFXBench 3.0: Battery Life
We use the GFXBench 3.0 battery life test to examine GPU thermal throttling, because the T-Rex workload generates a lot of heat. At the end of the test, GFXBench creates a nice diagram that plots battery charge (green line) and performance (blue line) versus time. Since performance is directly linked to the GPU core frequency, this diagram characterizes the device’s GPU thermal throttling over time.

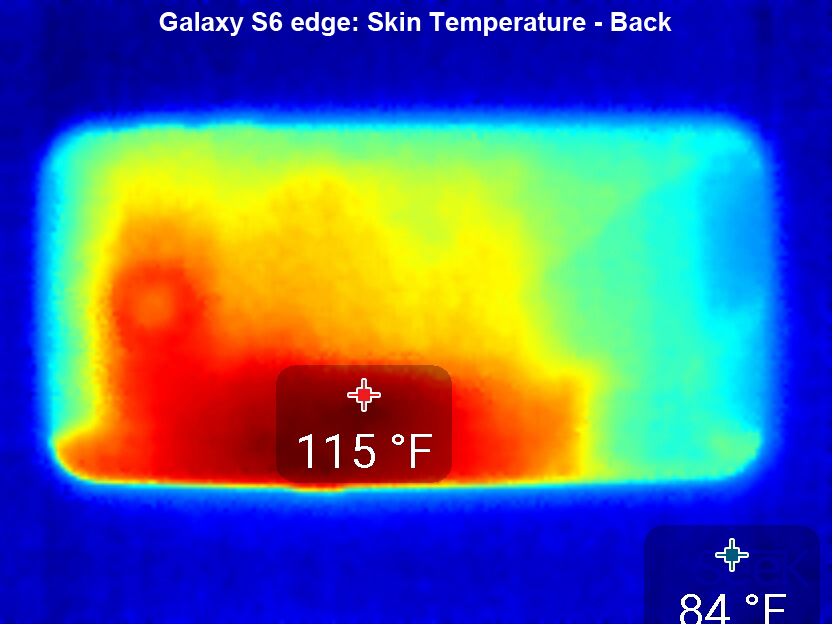
During this test, we use an infrared camera from Seek Thermal to measure the surface temperature of the device. The camera sensor is a vanadium oxide microbolometer type with a 12μm pixel pitch. It has a resolution of 206x156 for a total of 32k thermal pixels, which can detect long-wave infrared of 7.2-13 microns. The camera is rated to be accurate to within 2% at 100 °F, and uses a “black body” shutter that passes in front of the lens periodically for self calibration.

The maximum skin temperature of the rear cover is recorded during the test and compared to other devices in a chart. The thermal image is also provided, because it shows how a device’s structural design helps or hinders heat dissipation.
Get Tom's Hardware's best news and in-depth reviews, straight to your inbox.
-
blackmagnum Thank you for clearing this up, Matt. I am sure us readers will show approval with our clicks and regular site visits.Reply -
falchard My testing methods amount to looking for the Windows Phone and putting the trophy next to it.Reply -
WyomingKnott It's called a phone. Did I miss something? Phones should be tested for call clarity, for volume and distortion, for call drops. This is a set of tests for a tablet.Reply -
MobileEditor ReplyIt's called a phone. Did I miss something? Phones should be tested for call clarity, for volume and distortion, for call drops. This is a set of tests for a tablet.
It's ironic that the base function of a smartphone is the one thing that we cannot test. There are simply too many variables in play: carrier, location, time of day, etc. I know other sites post recordings of call quality and bandwidth numbers in an attempt to make their reviews appear more substantial and "scientific." All they're really doing, however, is feeding their readers garbage data. Testing the same phone at the same location but at a different time of day will yield different numbers. And unless you work in the same building where they're performing these tests, how is this data remotely relevant to you?
In reality, only the companies designing the RF components and making the smartphones can afford the equipment and special facilities necessary to properly test wireless performance. This is the reason why none of the more reputable sites test these functions; we know it cannot be done right, and no data is better than misleading data.
Call clarity and distortion, for example, has a lot to do with the codec used encode the voice traffic. Most carriers still use the old AMR codec, which is strictly a voice codec rather than an audio codec, and is relatively low quality. Some carriers are rolling out AMR wide-band (HD-Voice), which improves call quality, but this is not a universal feature. Even carriers that support it do not support it in all areas.
What about dropped calls? In the many years of using a cell phone, I can count the number of dropped calls I've had on one hand (that were not the result of driving into a tunnel or stepping into an elevator). How do we test something that occurs randomly and infrequently? If we do get a dropped call, is it the phone's fault or the network's? With only signal strength at the handset, it's impossible to tell.
If there's one thing we like doing, it's testing stuff, but we're not going to do it if we cannot do it right.
- Matt Humrick, Mobile Editor, Tom's Hardware -
WyomingKnott The reply is much appreciated.Reply
Not just Tom's (I like the site), but everyone has stopped rating phones on calls. It's been driving me nuts. -
KenOlson Matt,Reply
1st I think your reviews are very well done!
Question: is there anyway of testing cell phone low signal performance?
To date I have not found any English speaking reviews doing this.
Thanks
Ken -
MobileEditor Reply1st I think your reviews are very well done!
Question: is there anyway of testing cell phone low signal performance?
Thanks for the compliment :)
In order to test the low signal performance of a phone, we would need control of both ends of the connection. For example, you could be sitting right next to the cell tower and have an excellent signal, but still have a very slow connection. The problem is that you're sharing access to the tower with everyone else who's in range. So you can have a strong signal, but poor performance because the tower is overloaded. Without control of the tower, we would have no idea if the phone or the network is at fault.
You can test this yourself by finding a cell tower near a freeway off-ramp. Perform a speed test around 10am while sitting at the stoplight. You'll have five bars and get excellent throughput. Now do the same thing at 5pm. You'll still have five bars, but you'll probably be getting closer to dialup speeds. The reason being that the people in those hundreds of cars stopped on the freeway are all passing the time by talking, texting, browsing, and probably even watching videos.
- Matt Humrick, Mobile Editor, Tom's Hardware