Why you can trust Tom's Hardware
Power
We used GPUz’s logging to measure the card’s power consumption with the Metro:Exodus benchmark running at 2560 x 1440 using the default Ultra settings. The card is warmed up prior to testing and benchmarking is started when it settles to a normalised idle temperature (after about 10 minutes). The benchmark is looped a total of five times, which yields around 10 minutes of testing. In the charts you will see a few blips in power use; this is a result of the benchmark starting the next loop.
We also use Furmark to capture worst-case power readings. Although both Nvidia and AMD consider the application to be a “power virus,” or a program that deliberately taxes the components beyond normal limits, the data we gather from it tells us about a card’s capabilities.
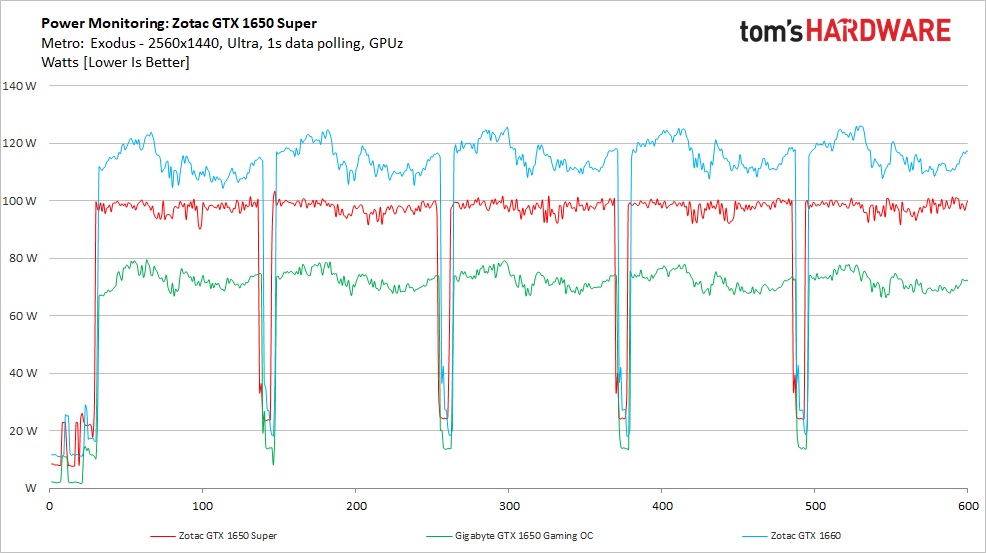
Power consumption during gaming wasn’t much with these budget cards. The new GTX 1650 Super averaged around 94W, the GTX 1650 Gaming OC 69W, and the GTX 1660 averaged 110W. The 94W result is still under the TDP of 100W, and below the GTX 1660.
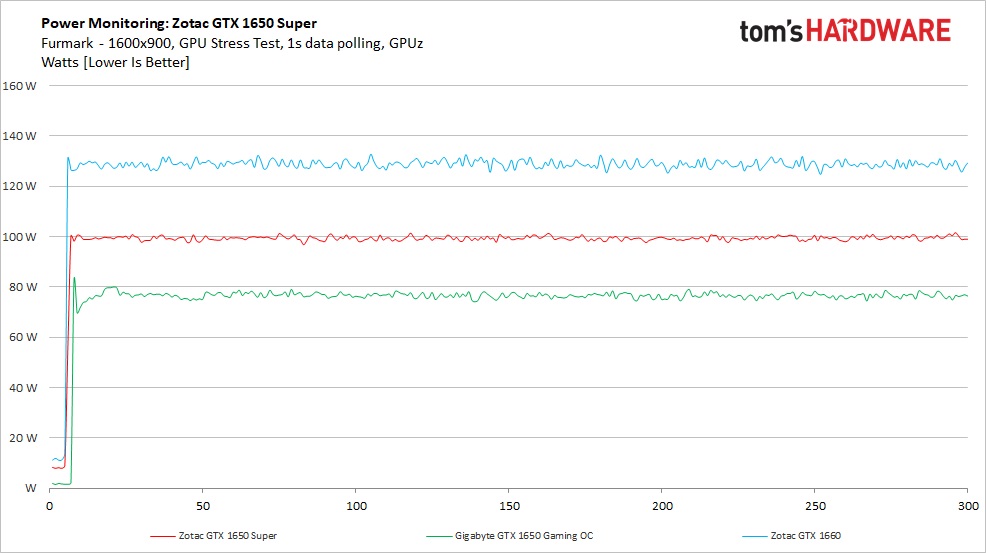
When looking at power consumption through the lens of Furmark, we don’t see much difference, outside of a much more consistent load. Here the 1650 Super averaged 99W, the GTX 1650 76W, and the GTX 1660 127W. This tells us the Zotac GTX 1650 we have throttles at the Nvidia-designed TDP of 100W. The power limit on this card is not able to be increased through software, so what you see is what you get for all intents and purposes. There may still be some overclocking headroom, but it won’t be much.
Temperatures, Fan Speeds and Clock Rates
Gaming
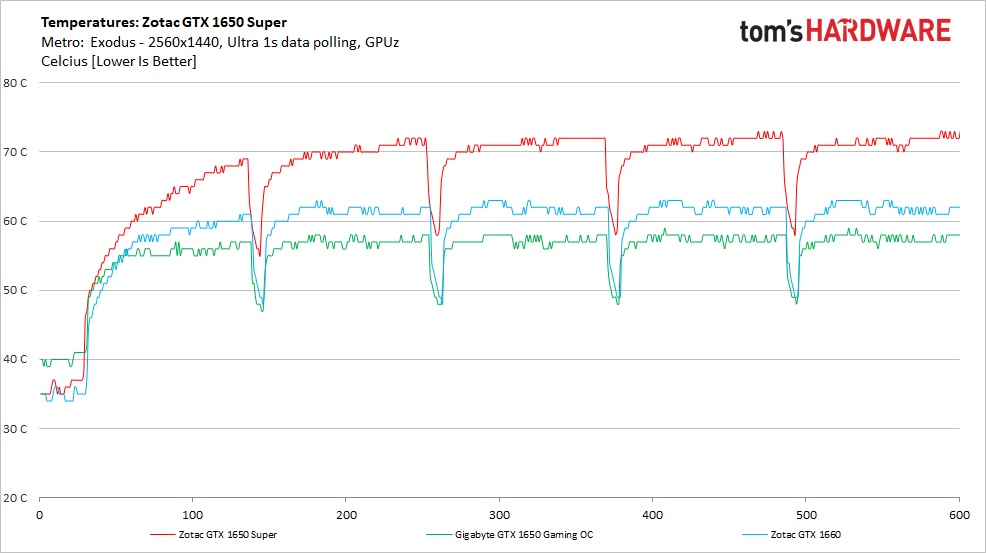
Temperatures in our gaming tests peaked at 72C for the Zotac GTX 1650 Super and its dual fan cooling solution. This result is the highest in our comparison cards. However, they all have different cooling and TDPs, so comparing them as like isn’t exactly fair. Zotac’s heatsink and fans kept the card running as expected throughout testing. The card has a capable, though not exceptional, cooler. It’s noisier than we’d like for this performance level.
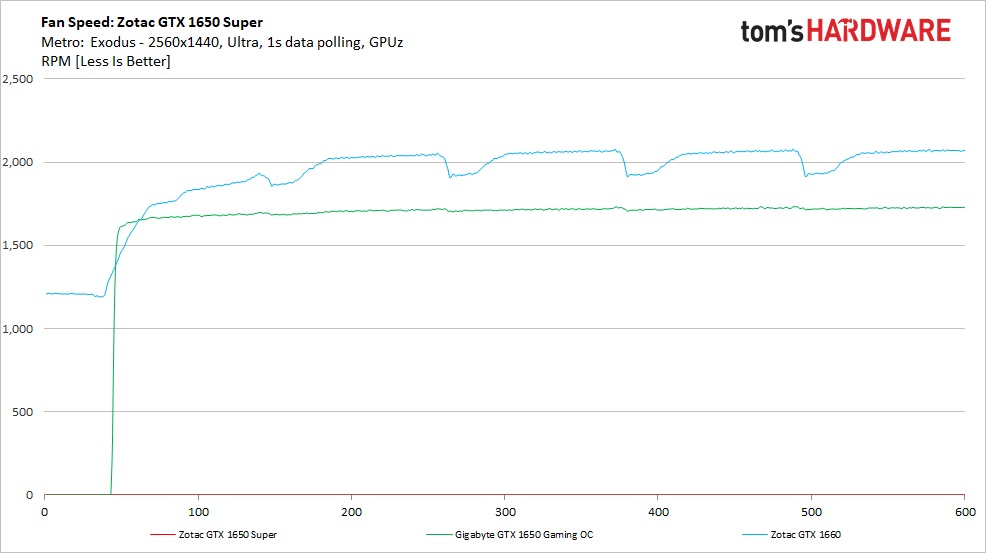
The chart for fan speeds is a bit bare, as GPUz (v2.27) was not able to capture fan speeds on the 1650 Super. A future update to the application will likely solve that issue. What we can say about the fans is that they are quiet when the card is idle, but ramp up and are definitely audible under load.
Get Tom's Hardware's best news and in-depth reviews, straight to your inbox.
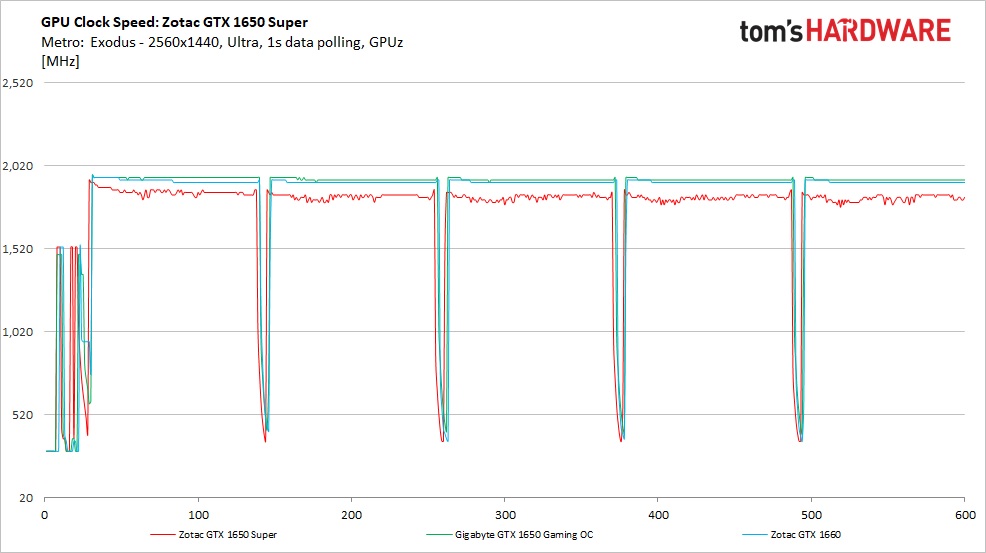
In reference to clock speeds, the Zotac GTX 1650 Super averaged 1,825 MHz compared to its boost specification, listed at 1,725 MHz. Holding around 100 MHz above the listed boost clock is standard for Nvidia cards. This is unlike AMD’s boost, which is optimistic even at the best of times. At idle, as we’ve seen with previous Turing based GPUs, clocks drop to 300 Mhz.
Furmark
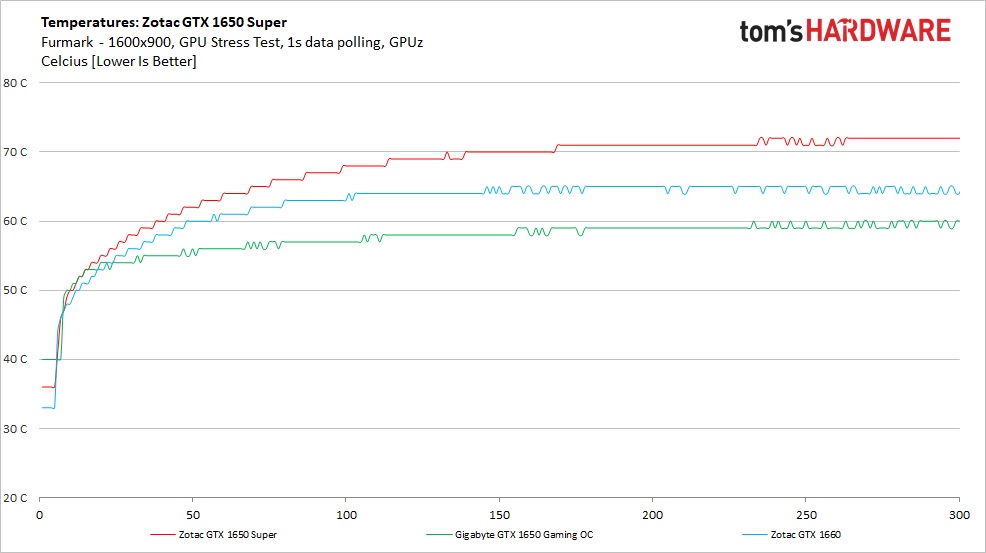
Shifting focus to the more consistent and heavier load in furmark, we see similar results as with the gaming side. In this case, temperatures peaked at 72C, just as we recorded in the gaming tests. The integrated protection built into these cards throttle Furmark loads considerably, protecting your hardware investment.
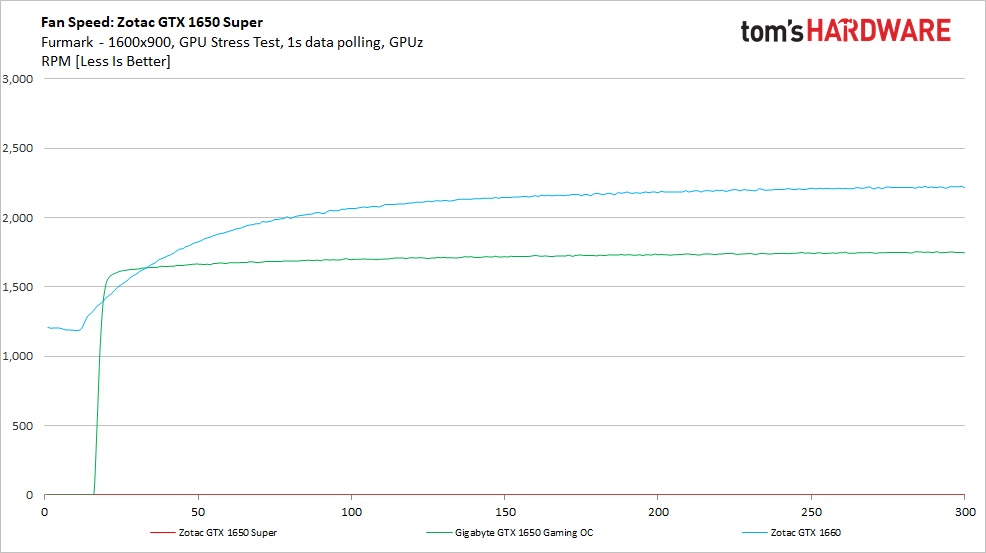
Again, GPUz is not currently able to capture the fan speed on this card.
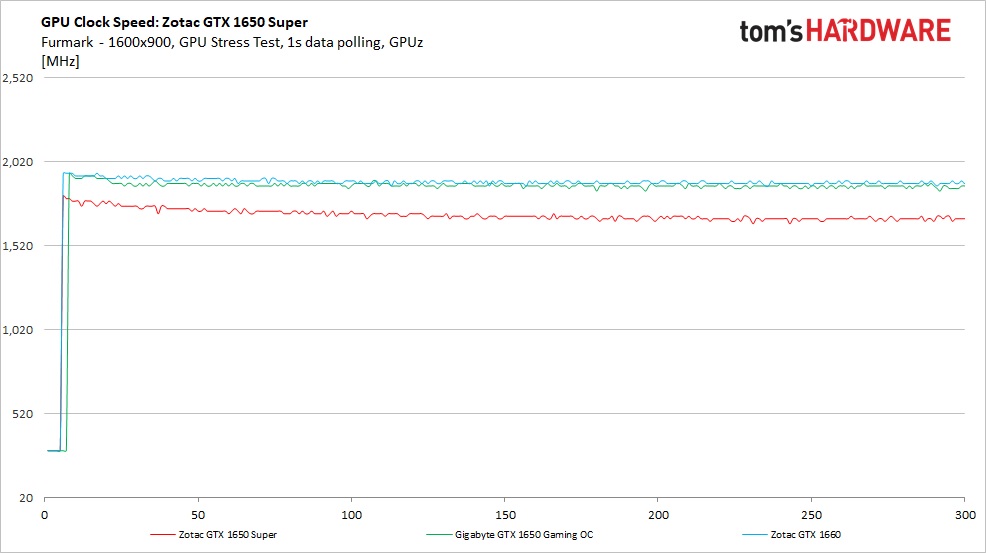
The GTX 1650 Super’s clock speeds in Furmark are much lower than what we saw in gaming. In this case the card averaged a bit over 1,700 MHz over the duration of the test while under load. Compare that to 1,825 MHz when gaming and we confirmed that the GPU is working hard trying to fit within its power limits.
MORE: Best Graphics Cards
MORE: Desktop GPU Performance Hierarchy Table
MORE: All Graphics Content
Current page: Power Consumption, Fan Speeds, Clock Rates and Temperature
Prev Page Performance Results: 1920 x 1080 (Medium) Next Page Software: Firestorm
Joe Shields is a staff writer at Tom’s Hardware. He reviews motherboards and PC components.
-
Mileta Cekovic It would be interesting to see how Radeon RX 5500 and especially RX 5500 XT fare against RTX 1650 Super and what the prices of them will be.Reply
With RTX 1650 Super @ $160, Nvidia has given AMD a serious task to beat this price/performance level. -
King_V This, I think, has definitely put AMD on notice. A little hard to say for certain, and I wish the RX 570 4GB and RX 580 8GB results were on the charts as well, but, depending on the game, it looks like the 1650 Super is at least equal to the RX 570, and sometimes matches the RX 590.Reply
Given the $160 price point, it seems the RX 570, 580, and 590 are going to have to adjust prices downward.
Further, I'm thinking that AMD is not going to be able to get by with only matching the RX 580's performance with the RX 5500. Or, if they do, they will have to definitely undercut the 1650 Super's price, which will put even further downward pressure on the Polaris cards.
On the other hand, I don't know what to think about the RX 5500 - at one point it was stated to be a 150W card, then it was 110W. What little performance data we have, and it's precious little data, pegs it at around RX 580 performance. I'm hoping this is all a case of AMD holding their cards close to their chest, but, as it stands, that's not overly promising, given what the 1650 Super offers in performance... and AMD should worry.