Extreme Overclocking
Benchmark Results
3DMark05
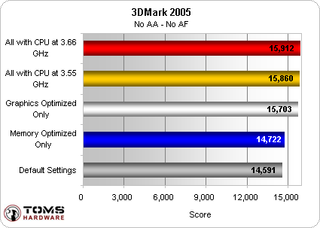
For all of the tests we used the 1024x768 resolution, as this should show the largest movements in performance. At higher resolutions the graphics cards are the main limitation, but at the lowest settings we should see the impact of bottlenecks in the system. Here we see that 3DMark05 only went up 9% in performance, even though the three main system components were operating above spec by 20% or more. One thing to note about 3DMark05 is that there is a greater improvement from speeding up the graphics cards than from pushing the entire system further. This is not the case for all of the game tests.

Doom 3
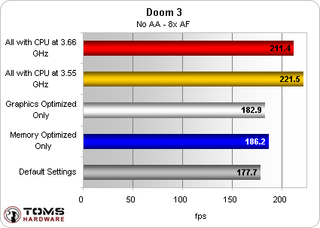
Doom 3 shows a completely different picture for performance. While 3.66 GHz was the fastest CPU speed, the frequency was of the bus was at 281.75 MHz (281.75 x 4 = 1227) and the multiplier at 13x. The 3.55 GHz was comprised of a 443 MHz bus (443 x 4 = 1772) and an 8x multiplier. Here we can see that the higher FSB frequency and lower multiplier wins, even though the overall clock speed of the CPU is faster by 110 MHz. At the 3.55 GHz settings the game falls in line with the overclock on the entire system. Moving from a base rate of 177.7 frames per second (fps) we gained 24.6% more performance, obtaining 221.5 fps.

Stay on the Cutting Edge
Join the experts who read Tom's Hardware for the inside track on enthusiast PC tech news — and have for over 25 years. We'll send breaking news and in-depth reviews of CPUs, GPUs, AI, maker hardware and more straight to your inbox.
Most Popular


