The Secret Sauces of THG's LCD Tests
The Driving Software
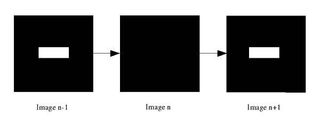
We're now in a position to measure the response of one or more pixels. But to do that, we need to simulate the screen with a video sequence appropriate to the test and perfectly reproducible. The simulation software that we use can be adapted to all screen resolutions and all refresh frequencies that the monitor is capable of supporting. The software generates a flashing line in the middle of the screen, which flashes at the vertical blanking interval of the monitor. It is vital that all the pixels measured are on the same line because they are stimulated at the same instant (or at least very rapidly one after the other), so it's better if the delay between the illumination of two pixels is negligible compared to the measurement time. The vertical blanking interval of a CRT is of the order of 60 kHz or 15 microseconds of uncertainty compared with the 8 milliseconds of latency measured. This represents an uncertainty of around 0.1%, which is perfectly acceptable.

The driving software, amongst other things, controls the following:
- Choice of display mode (resolution, nominal frequency);
- Channel separation (8 bits per channel RVB allowing the display of no less than 24-bit color);
- Frequency (subsets of the nominal frequency).
- Blinking Rate
Example Of Use: (CRT Monitor)

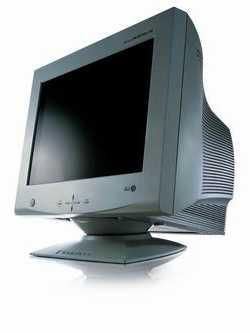
We tested the system on several screens prior to using it for real tests. So, here's an example of the results we derived from a CRT screen: the 19 inch LG915FT+. Our decision to test a CRT monitor wasn't random: the Cathode Ray Tube will always be a good reference for latency, as you will see. Basically, whatever works on a CRT will also work on a TFT, which is by nature extremely slow. The CRT represents an extreme case a probe could encounter during TFT tests.
The settings of the screen were as follows:
- Vertical Blanking Interval: 85 Hz
- Resolution 1 280 x 1 024
Stay on the Cutting Edge
Join the experts who read Tom's Hardware for the inside track on enthusiast PC tech news — and have for over 25 years. We'll send breaking news and in-depth reviews of CPUs, GPUs, AI, maker hardware and more straight to your inbox.
Current page: The Driving Software
Prev Page The Mechanism Next Page First Observation: Refresh DelayMost Popular

