How to Check Your Graphics Card Temperature and Other Settings
Keeping your cool
It's important to check your graphics card temperature periodically, whether you're using one of the best graphics cards or something a bit older and less potent. High graphics card temperatures can also signal that something is wrong, and thankfully it's easy to quickly check how things are running. Many users might go many months or even years without cleaning out the dust buildup inside their PC, and the result can be higher temperatures, lower performance, or even component failure. If you're one of those, checking your GPU temperatures before and after cleaning can be an enlightening experience.
You'll need a few things to determine your graphics card temperature. Multiple utilities will do the job, but we prefer using either MSI Afterburner, HWiNFO, or GPU-Z. All three are free and support virtually every graphics card currently available. We like the portable version of HWiNFO since we know where the files are and can overwrite them with updated versions as needed, but you can use either one. You can also use MSI Afterburner to overclock your graphics card, but it doesn't report on as many system components, so it's not a bad idea to grab it along with one or both of the others.
Besides GPU-Z, MSI Afterburner, and HWiNFO, you'll also want some programs that will give your graphics card a workout. You can use benchmarks like 3DMark, which can also report temperatures, but we prefer actual games. Our how to test your graphics card reference provides the details you'll need.
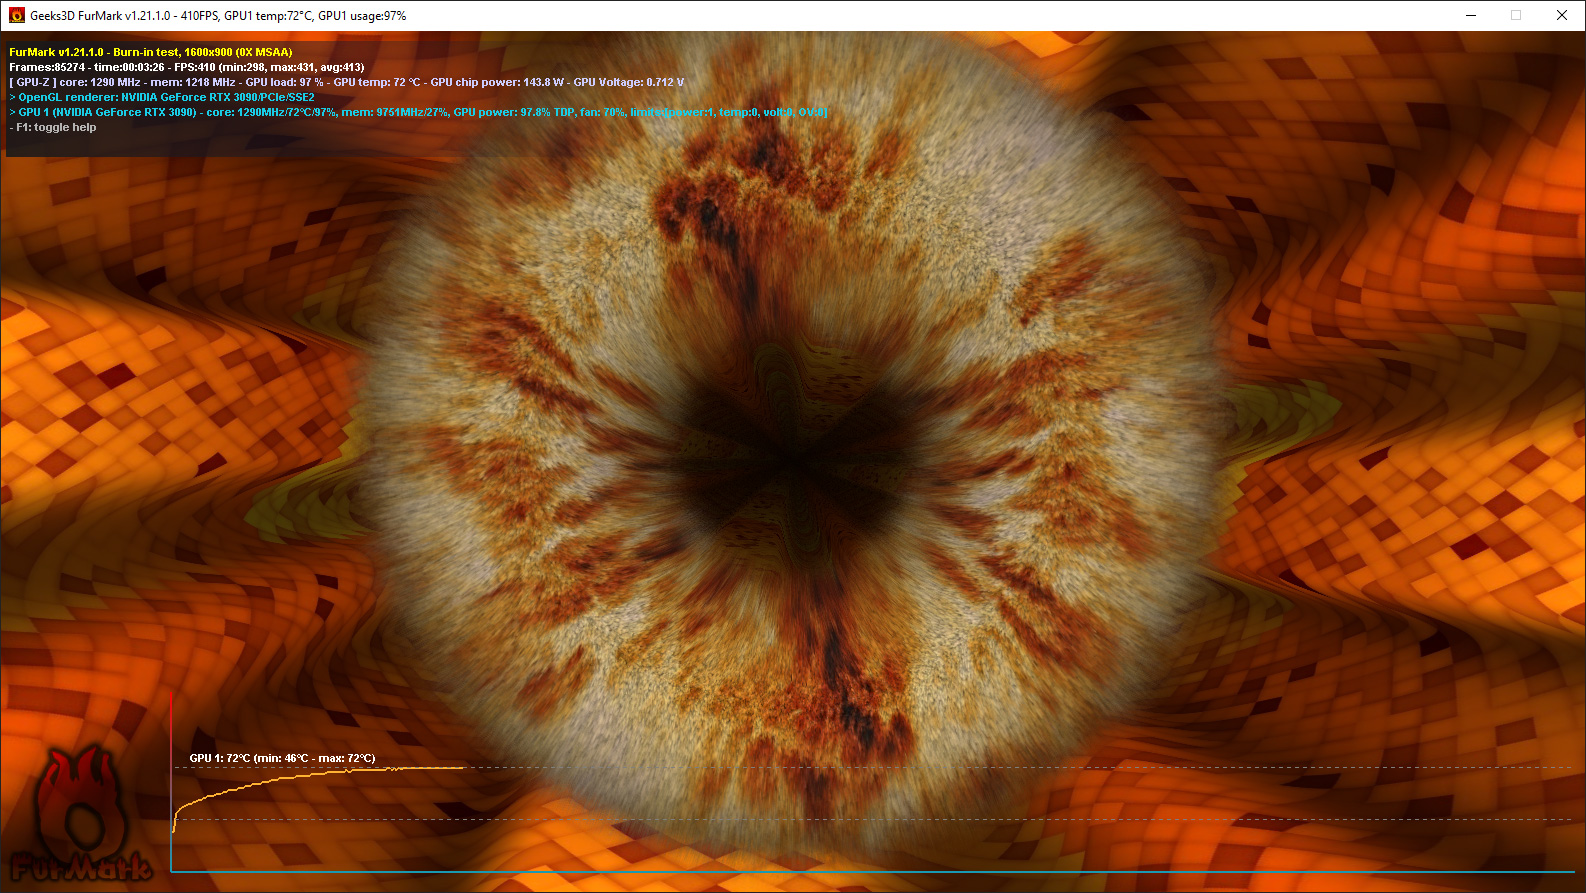
FurMark is another utility often used to stress test graphics cards, and it reports temperatures and other details. However, be careful as it can put a heavy load on your GPU and cause graphics cards to fail, particularly if they're already having issues. It's also not usually representative of gaming performance, which is what most people actually care about.
Using GPU-Z
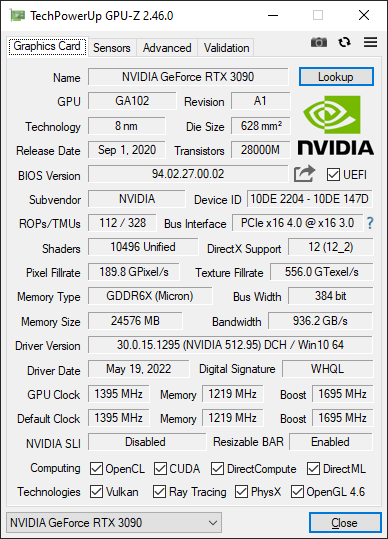
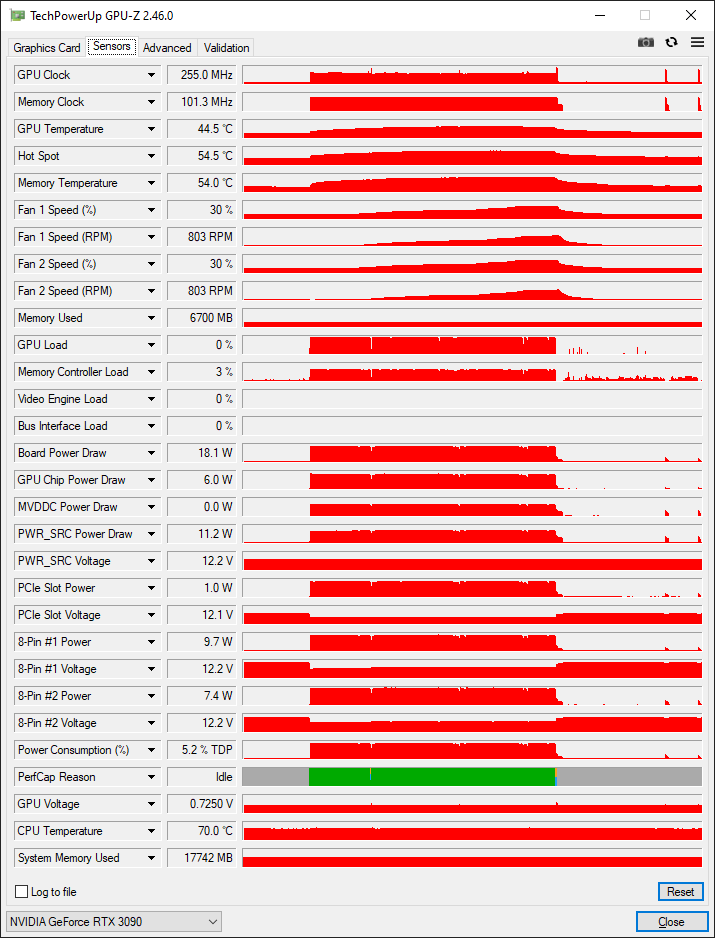
The main GPU-Z screen shows basic information about your graphics card, like the actual GPU, the memory clock, VBIOS version, driver version, and more. While you could try to refer to this screen to see the current clocks on your card, it's better to head to the Sensors tab. That will show temperatures, clock speed, fan speeds, and other details, and it also supports logging to a CSV file that can then be imported into any spreadsheet application.
With GPU-Z running on the Sensors tab — with or without logging — go ahead and run a game or other graphics workload. Play for as long as you want, though probably at least 15 minutes, to ensure your GPU has had time to heat up fully. Then, exit the game or utility and go back to GPU-Z, and you can see how things progressed over time. The column of numbers shows the current data only, which is why you'll want to log the data so that you can then find the peak temperature, fan speed, etc.
The above shot shows an RTX 3090 Founders Edition running FurMark for a few minutes. The green section on "PerfCap Reason" indicates that the GPU is throttling performance, likely to avoid using too much power or overheating. FurMark heats up the GPU pretty quickly, but you can't see exact figures without interacting with the live application.
Using MSI Afterburner
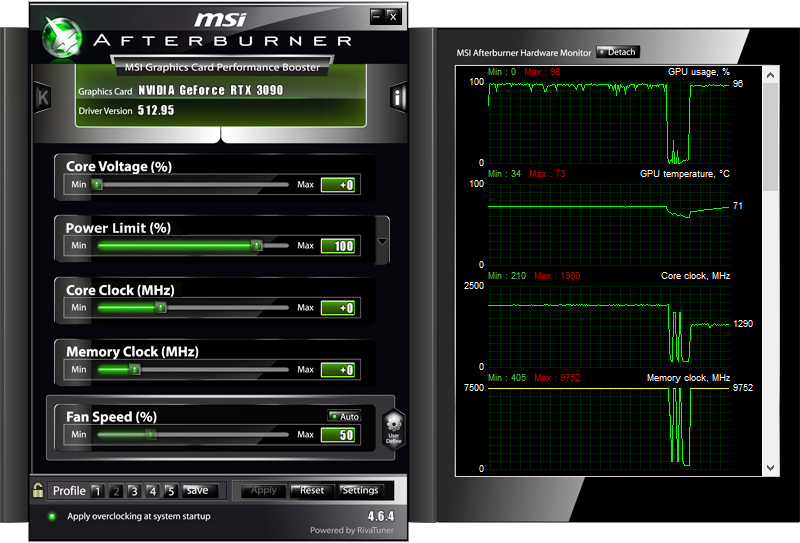
While you can use MSI Afterburner for overclocking, our main purpose here is to look at its monitoring capabilities. The above screenshot (see how to take screenshots in Windows) shows GPU usage, temperature, core clock, and memory clock. The first part of the graph shows the card running Forza Horizon 5 for a while, then we exited and launched FurMark. Notice how much lower the GPU clocks are with FurMark in order to keep power and thermals in check. One nice aspect of Afterburner is that it shows the maximum value reached for the various sensors, so you can see that the GPU clocked at up to 1980 MHz, for example, while the temperature peaked at 73C.
The hardware monitor portion of Afterburner can also be detached and enlarged, and numerous skins are also available. We used the v3 skin because we're old and don't like change or something. It can monitor CPU clocks, temperatures, and utilization on a per-core basis if you're interested in that data. You can also right-click on the monitor screen and choose to log the values over time if you want a CSV file.
Using HWiNFO
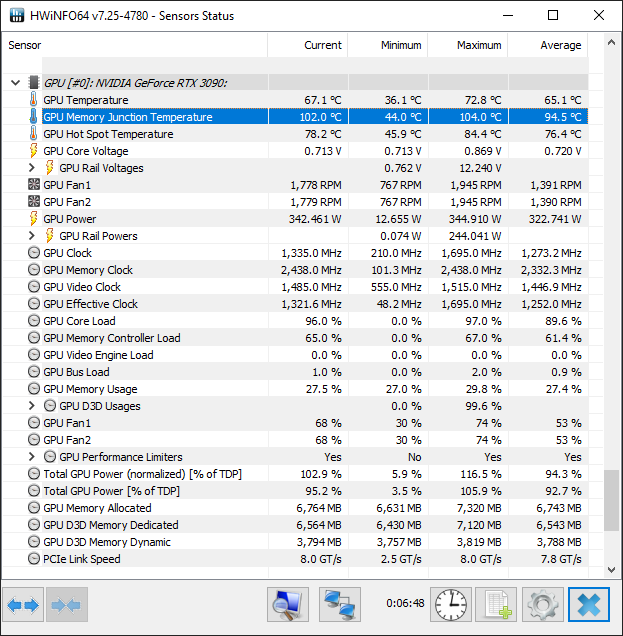
HWiNFO is perhaps the most full-featured monitoring utility available. Not only can it check your graphics card temperatures, utilization, and clock speeds, but it can also show details for your CPU, motherboard, SSDs, and other hardware. Perhaps the most important element of HWiNFO is that it also reports GDDR6 and GDDR6X temperatures for supported GPUs — basically the GeForce RTX 30-series and Radeon RX 6000-series. Not many other utilities will do that, and GDDR6X thermals, in particular, can get a bit too high on some cards, especially if you happen to do any cryptocurrency mining.
We typically launch HWiNFO64 and use the sensors-only mode. You can log data to a CSV, though the icon isn't particularly clear in this case — it's the ledger icon with the green plus-sign. The "reset history" icon is even less clear, showing an analog clock. But besides those idiosyncrasies, HWiNFO64 will quickly let you see how things are going with your PC's hardware.
Fire up a game or other graphics workload, run it for a while, and check the main window or the log file. HWiNFO helpfully reports minimum, maximum, and average figures for all monitored items. In our screenshot, we're running FurMark in the background, which is why the temperatures and hot spot figures are somewhat warm. The GDDR6X also hit a peak of 104C and basically sits at a sustained 102C, which is typical for the RTX 3090 Founders Edition.
How Hot Is Too Hot for Your Graphics Card?
With the above information in hand, you'll likely want to know if your graphics card is getting too hot or if it's running in an appropriate temperature range. For GPU core temperatures, we prefer to keep those well south of 90C, but some GPUs tend to run warmer. For example, AMD's RX Vega series could easily hit the high 80s under typical gaming conditions.
Modern GPUs like the RTX 30-series and RX 6000-series typically shouldn't get above 80C for the GPU core, while GDDR6X memory can go as high as 110C while still technically being within spec. Usually, the RTX 3070/3080/3090 GPUs with GDDR6X will start to throttle performance at 110C, and sometimes even at 106C–108C. Of course, we prefer the memory to stay below 100C, but on some cards, that's just not going to happen without modding the cooling elements.
If you're concerned your graphics card is running too hot and throttling, log a gaming session to a CSV file and then look at the temperatures and clock speeds over time. Then look up the specifications for your particular GPU at either AMD or Nvidia (or perhaps Intel if you get an Arc graphics card) and compare the average GPU clocks after 15 minutes or more of gaming to the official clock speeds. If your GPU runs at significantly lower clock speeds than the advertised game or boost clock (meaning 100 MHz or more below the listed value), it could be overheating and throttling.
This is especially true if you notice that GPU clocks start much higher and drop a lot over time — a brief spike near the start of gaming isn't unusual, but if your GPU slowly drops from 1850 MHz to 1500 MHz, that's not normal behavior for a well-cooled card. In that case, we recommend a good cleaning of the fans and heatsink using canned air, and in some cases, you might even want to dismantle the cooling setup and reapply thermal paste and thermal pads.
Get Tom's Hardware's best news and in-depth reviews, straight to your inbox.
- MORE: Best Graphics Cards
- MORE: GPU Benchmarks and Hierarchy
- MORE: All Graphics Content

Jarred Walton is a senior editor at Tom's Hardware focusing on everything GPU. He has been working as a tech journalist since 2004, writing for AnandTech, Maximum PC, and PC Gamer. From the first S3 Virge '3D decelerators' to today's GPUs, Jarred keeps up with all the latest graphics trends and is the one to ask about game performance.
