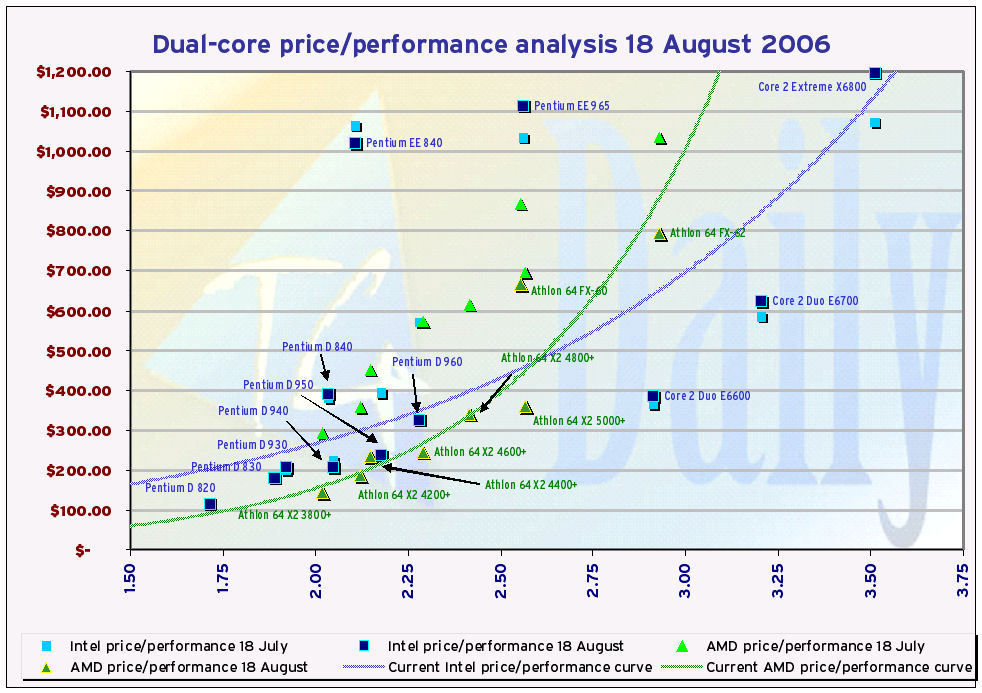
Updated price/performance chart reflects single-day AMD price drop
Sunnyvale (CA) - A surprisingly steep single-day average price drop in nearly all AMD dual-core processors, including its top-of-the-line FX series, plus a drop in Intel Pentium D 8xx series prices, characterized the last 24 hours of consumer CPU purchases, according to the latest data obtained by PriceGrabber. Suddenly, the Athlon 64 X2 3800+ is selling for an average price of $144 - down $23 from yesterday, and below the new 3600+ target price - once it's introduced - of $149.
Only the Athlon 64 X2 4200+ remained unaffected by yesterday's drops, according to PriceGrabber data, though it also remains AMD's single best-performing processor against our projected Intel price/performance curve. At $186, and with a performance index score of 2.12 (212% the overall performance of a Pentium 4 2 GHz CPU), a hypothetical Intel processor with the same score would sell for $300.69. Currently, the real-world Pentium 950 with an index score of 2.18 sells for $236.
Since yesterday, we received a number of letters from readers, and even a request from AMD, asking us to make our ongoing price/performance charts easier to read. While we can't fit our big chart into our current narrow layout, what we can do is make a bigger chart accessible via the Web. We listened to all your comments, and we thank you for your constructive feedback - and even some of the destructive feedback. To see the full chart, click on the miniature below.
Besides an obvious size advantage to the new chart, here's what we're doing differently now: Gone are the fishing-line-looking marks connecting the different product lines, which some of you said were making the chart more difficult to read, especially with the addition of the Pentium EE series to the mix. In their place are labels which point to the current price/performance plot points for each dual-core processor we've tested.
All you need to remember are two colors: Intel is blue, AMD is green. All the current plot points are dark; all the plot points for the past (in this case, one month ago) are light. Intel's points are squares; AMD's are triangles. Only the current-day plot points are labeled, but to find the one-month-old plot point for the same processor, look for the lighter-colored point that rests along the same vertical line as the dark point. For example, the dark blue box in the upper right corner represents Intel's Core 2 Extreme X6800, with an index score of 3.51 and an average price for today of $1,195. Directly below it on the same vertical line is a brighter blue box that represents the Core 2 Extreme's price one month ago ($1,072), when pre-orders were being taken.
The only two lines remaining on the new chart are the trendlines - the curves themselves, which are exponential best-fit curves whose points most closely approximate the actual prices. As the prices change from day to day, so do the performance curves. You can clearly see which processors fall way off these curves - AMD's FX series, and Intel's Extreme Edition dual-cores with hyperthreading. We've heard from some of you that either or both series should be removed from our estimates, and we're taking your advice under consideration. But we also heard earlier from others who have said, as long as we're testing the FX series, we should also be including the EE series.
The two curves clearly carve out Intel's and AMD's respective leadership territories on this map. Currently, they intersect at about $480 and about 2.65 on the index. To the lower left of that point is AMD territory, where anything below that price will generally yield better performance per dollar from AMD than Intel. But in recent days, Intel's Pentium D 820 has been challenging the AMD curve at about $115 - a theoretical AMD equivalent would sell for $90.71. Meanwhile, prices for Intel's popular Pentium D 805 have plunged to $93, according to PriceGrabber, although Tom's Hardware Guide has yet to test the 805 for performance.
Get Tom's Hardware's best news and in-depth reviews, straight to your inbox.
As the market starts to anticipate some action from AMD on the "4x4" front, prices for the FX-62 tumbled $70 in just one day, to $794. Prices for the Athlon 64 X2 4600+ followed suit, dropping $26 (down 9.6%) to $246, while the 4400+ saw the steepest percentage decline of the day, down 11% ($29) to $235. Comments from AMD spokesperson Damon Muzny this afternoon may help give a bottom to that drop, however.
What are the best performance values on the market today? There are two divisions right now: AMD has the low-price market, while Intel has secured the high ground and is aiming for the middle ground. While the lowest-end AMD dual-core processors have the highest price/performance value on the low end, both Intel Core 2 Duo processors show exceptional value. The reason: Perhaps AMD's best price-performer today is the Athlon 64 X2 5000+. At $360 and an index score of 2.57, it sits more than 21% below the Intel curve. But for just $24 more, you can buy a Core 2 Duo E6600 with an index score of 2.91 which is like getting an extra 34% of a Pentium 4 2 GHz at just 30% the extra price.
Tom's Hardware Guide provides us with the performance data we use for our estimates. Intel has yet to make Core 2 Duo E6400 and E6300 units available for testing. When they do, we admit you could see the Intel price/performance curve taper down a little bit, with E6300 prices currently at $218 - very price-competitive even with the Pentium D 950 at $236.
