Why you can trust Tom's Hardware
The performance results on the previous page don't provide a compelling reason to pick up the Nitro+ over the Pulse (or any other less expensive RX 7900 GRE). But there's more to a graphics card that raw performance. Here we'll check out the power use, clock speeds, and GPU temperatures while running our gaming test suite. We also check noise levels, which are an area where cards like the Nitro+ can truly differentiate themselves from lesser models.
Our graphics card test PC uses an Nvidia PCAT v2 device, as it gives us far more data without the need to run separate tests. PCAT with FrameView allows us to capture power, temperature, and GPU clocks from our full gaming suite — along with the usual frame times. The charts below are the geometric mean across all 19 games, and we also have full tables showing the individual results further down the page.
PCAT does not favor Nvidia GPUs in any measurable way. We checked power with our previous setup for the same workload and compared that with the PCAT, and any differences were well within the margin of error (less than 1%). PCAT is external hardware that simply monitors the power draw of the PCIe power cables as well as the PCIe x16 slot by sitting between the PSU/motherboard and the graphics card.
We have separate charts for 1080p medium/ultra, 1440p ultra, and 4K ultra in the galleries below. There's no reference design for the RX 7900 GRE, so the Sapphire Pulse will have to suffice. The Sapphire Nitro+ represents the top of what we're likely to see from the 7900 GRE, give or take — Asus, Gigabyte, PowerColor, and XFX also offer 'halo' parts that have a boost clock of 2391–2395 MHz, with the XFX 7900 GRE being the least expensive option and also the highest boost clock.
Sapphire RX 7900 GRE Nitro+ Power Use
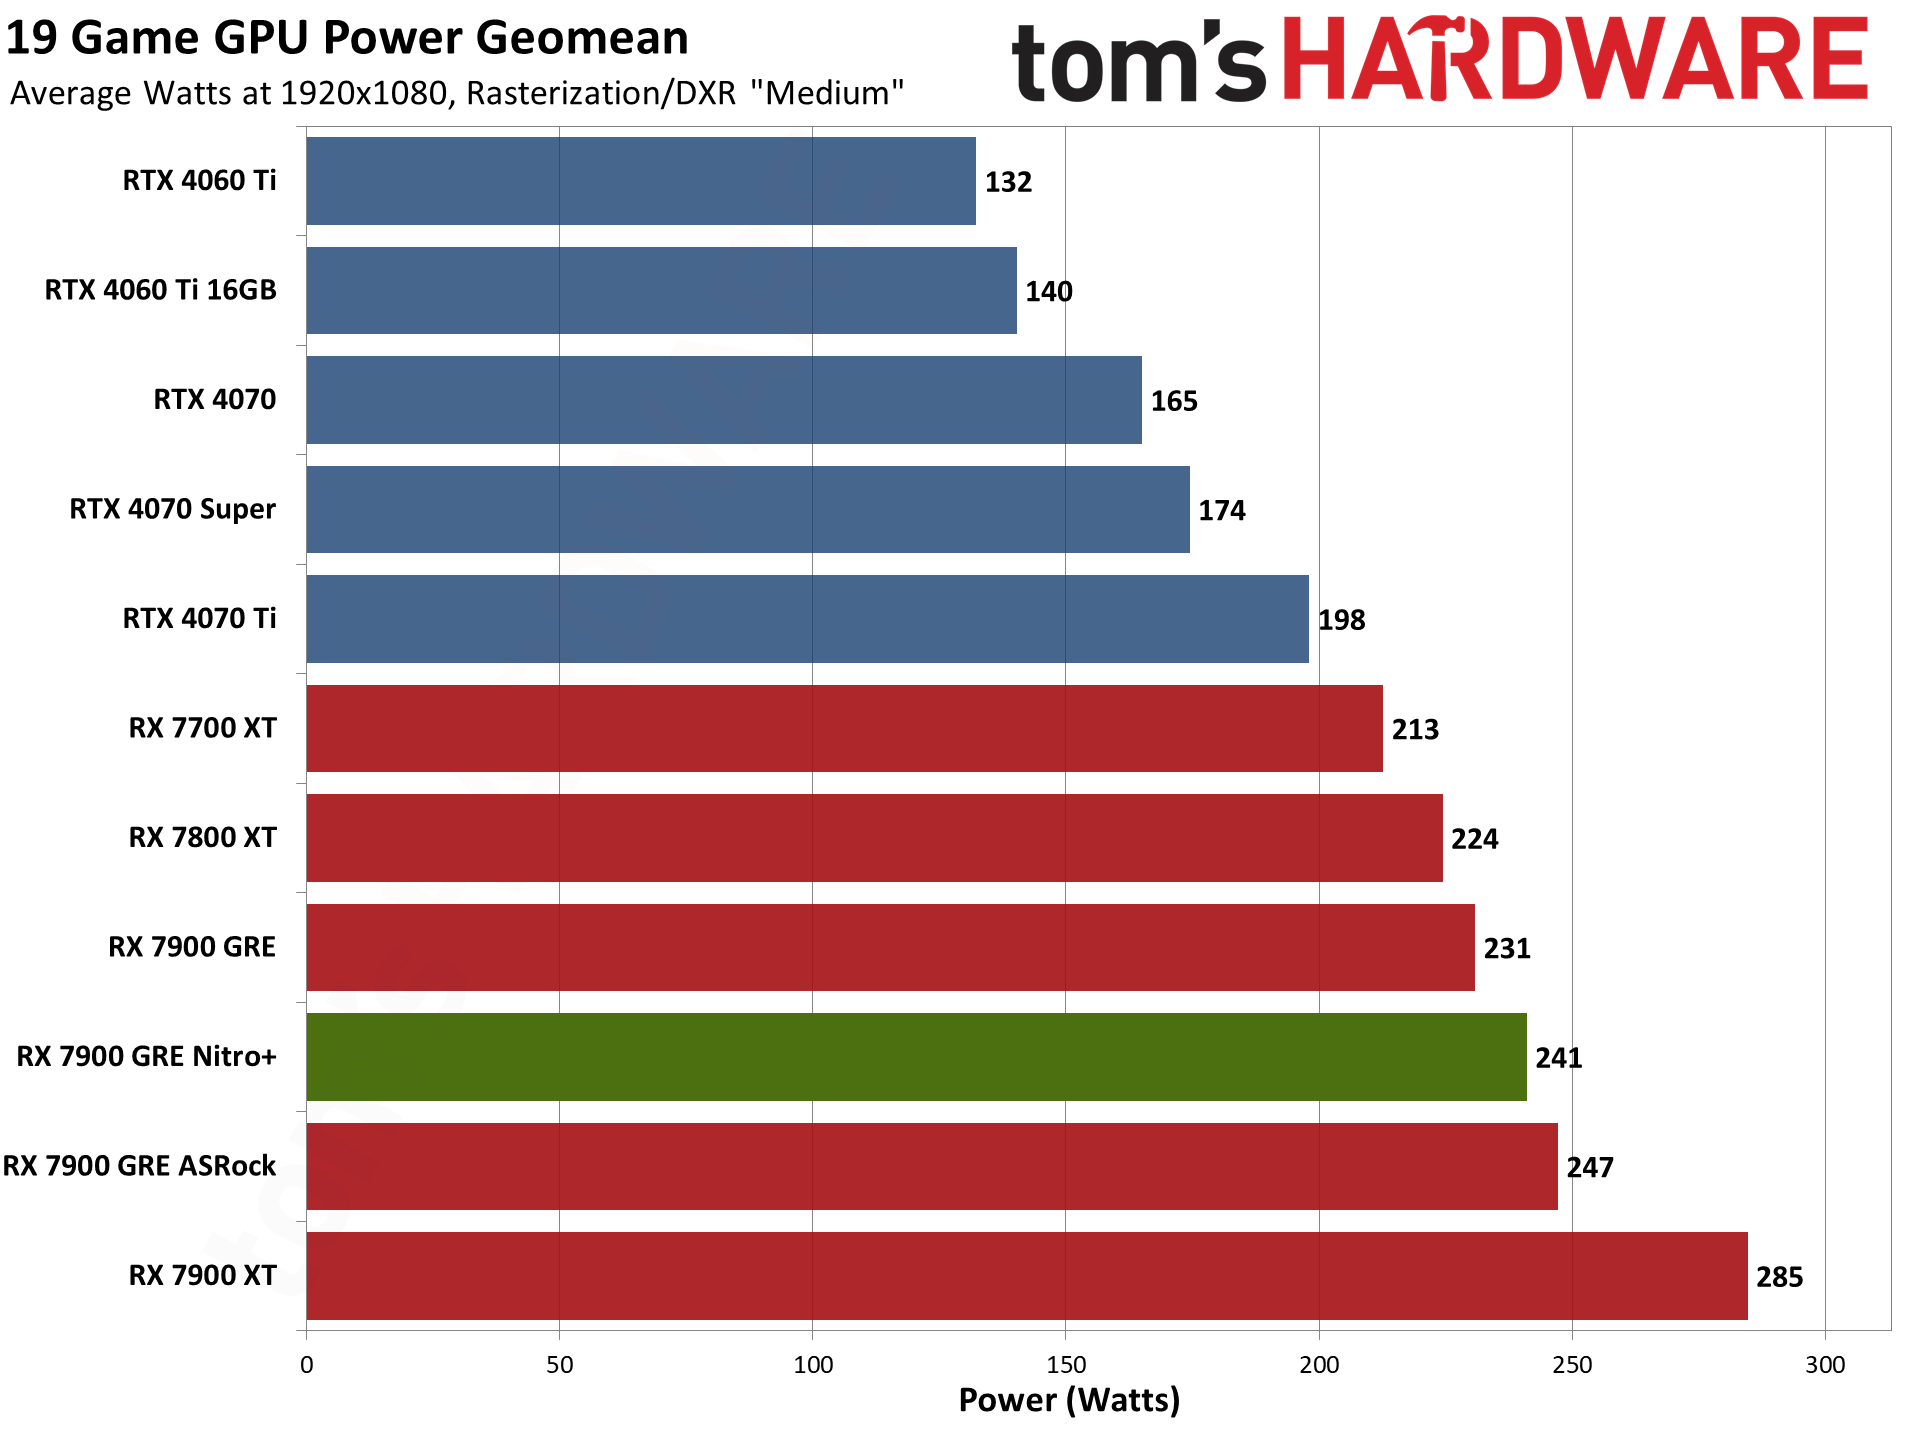
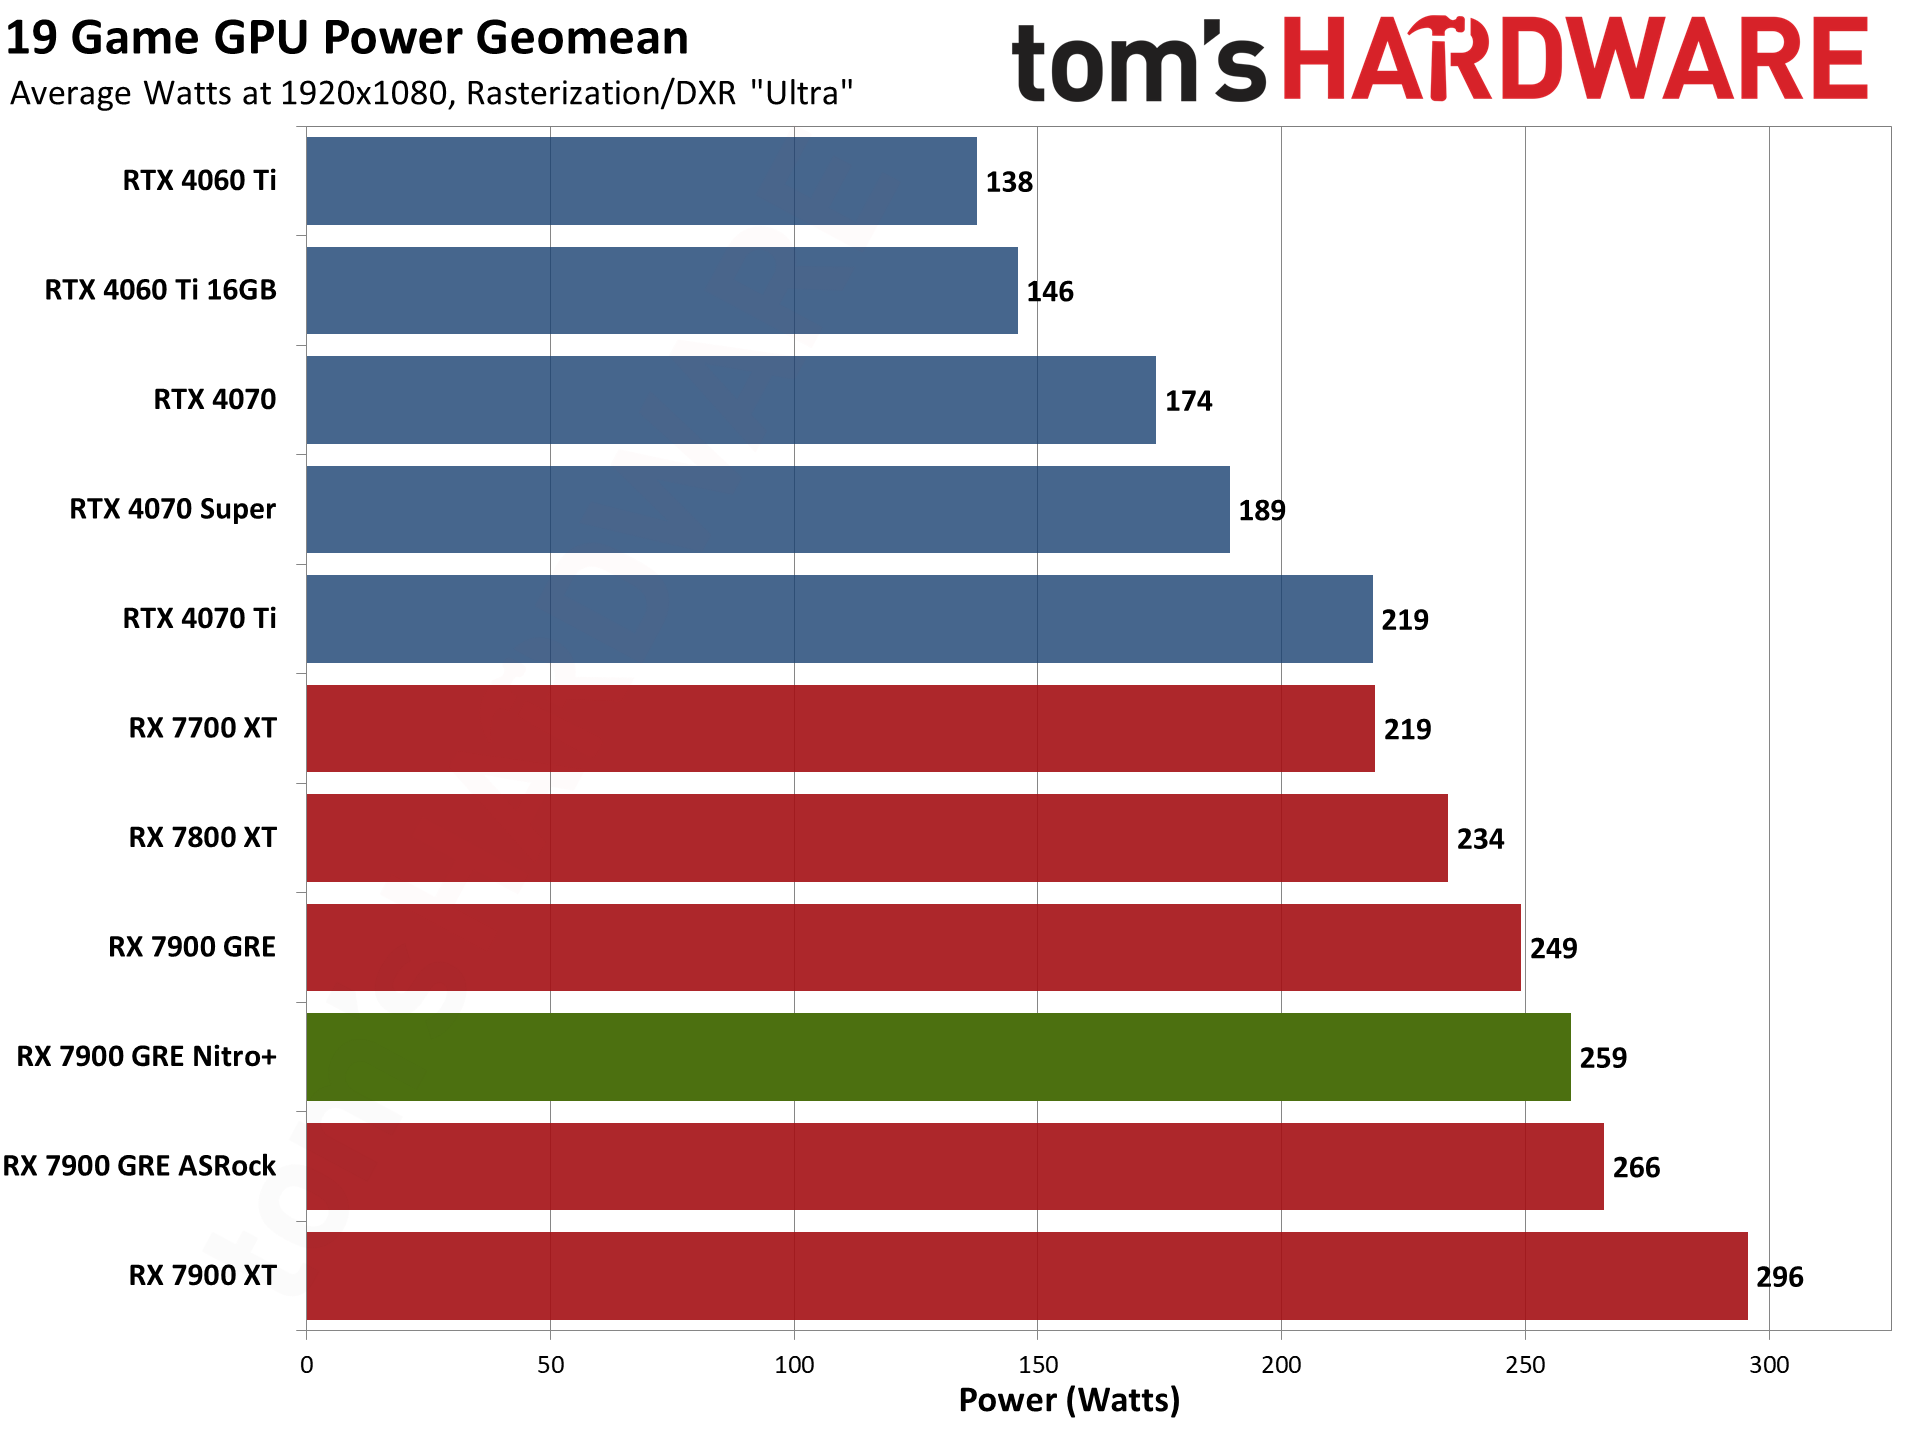
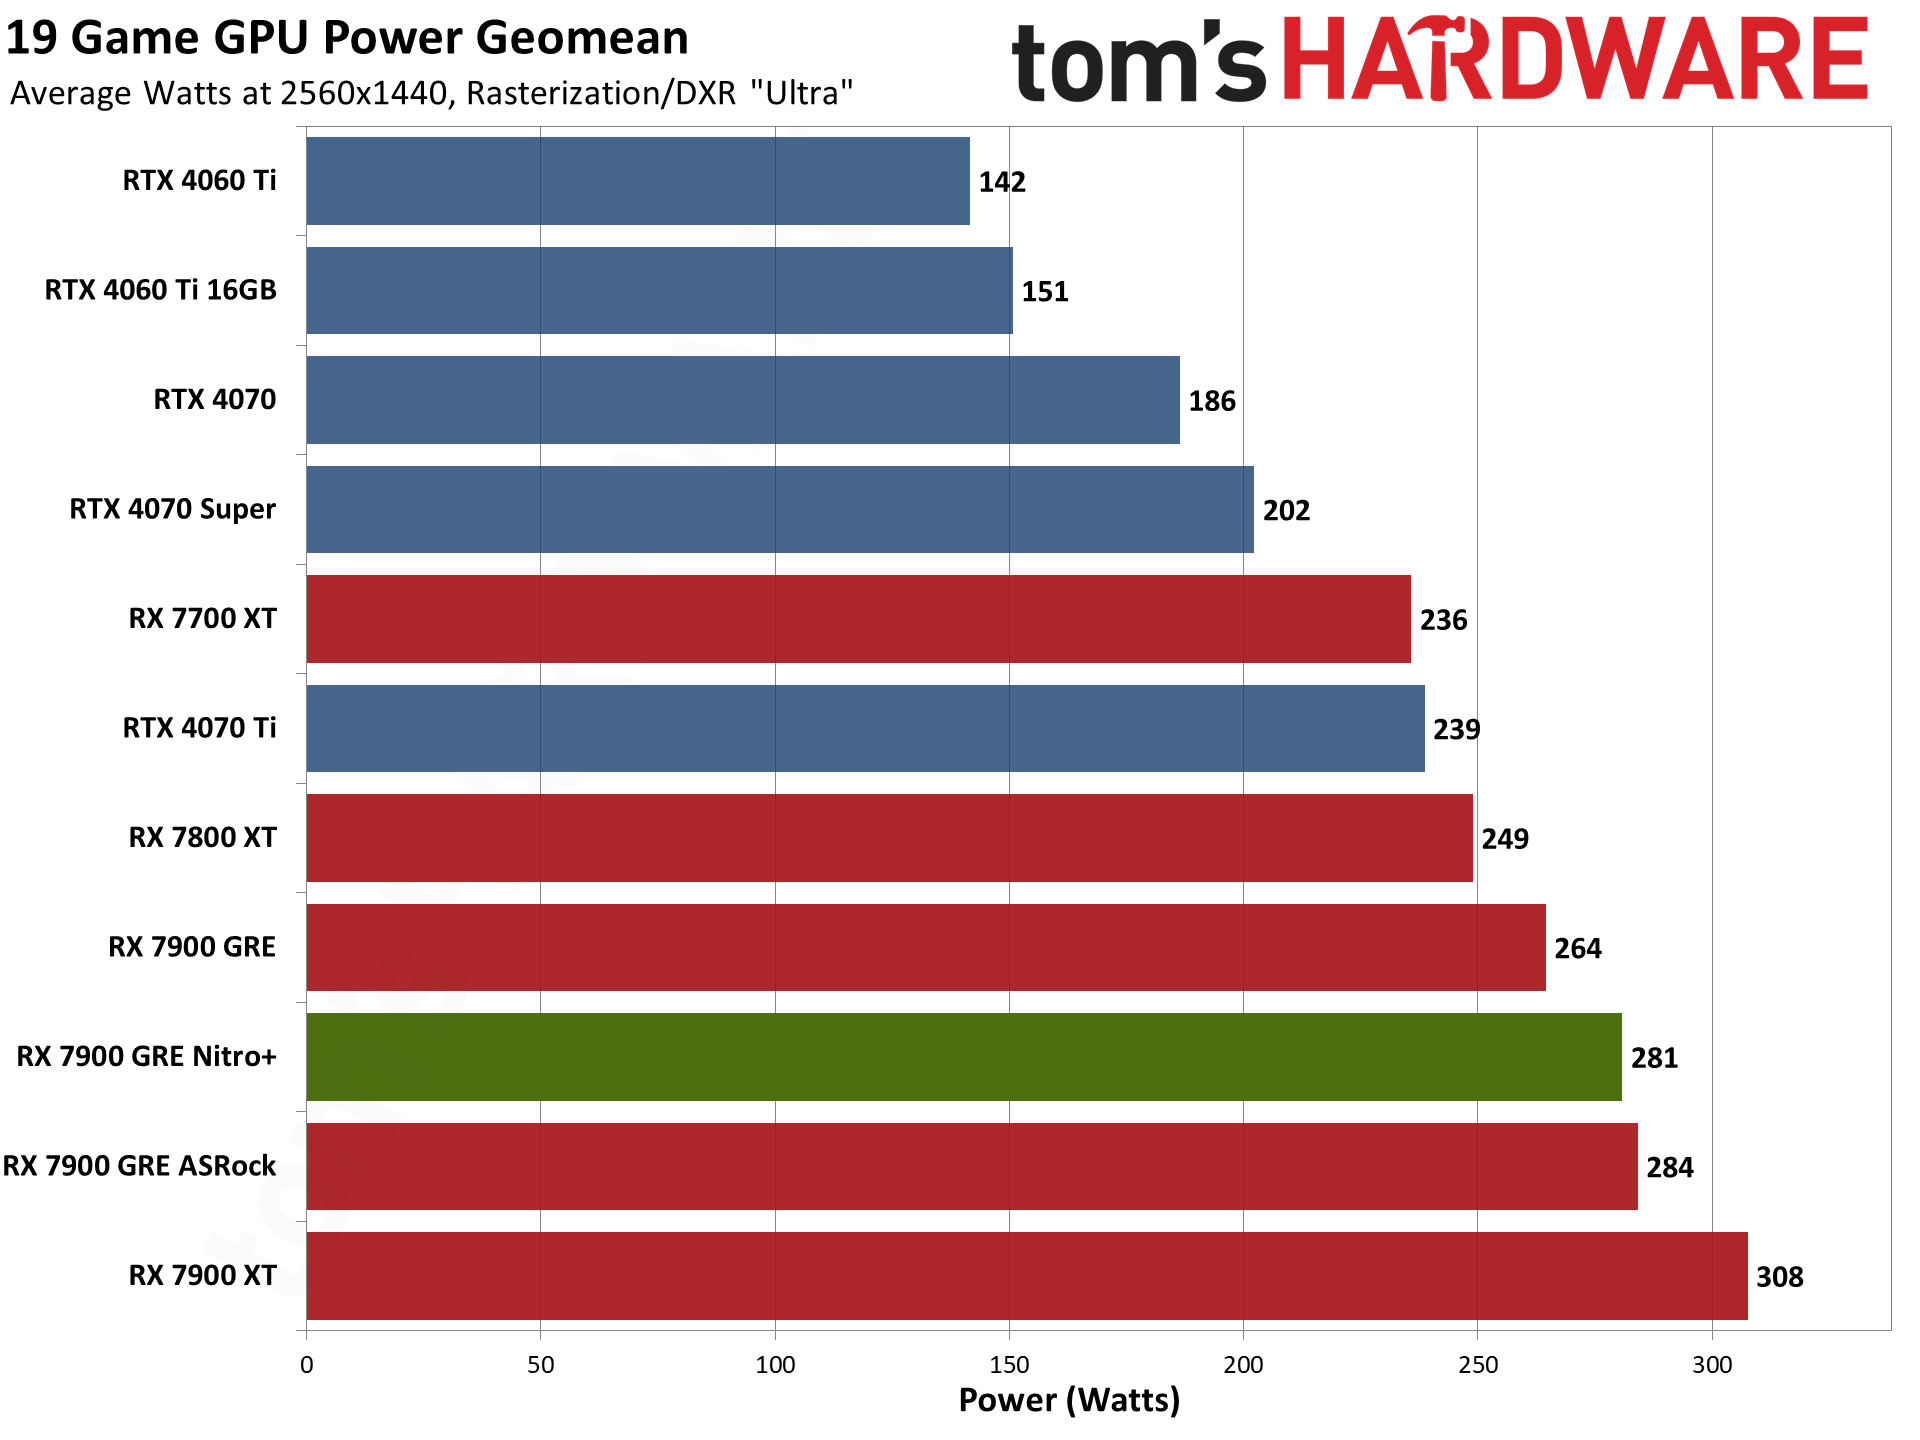
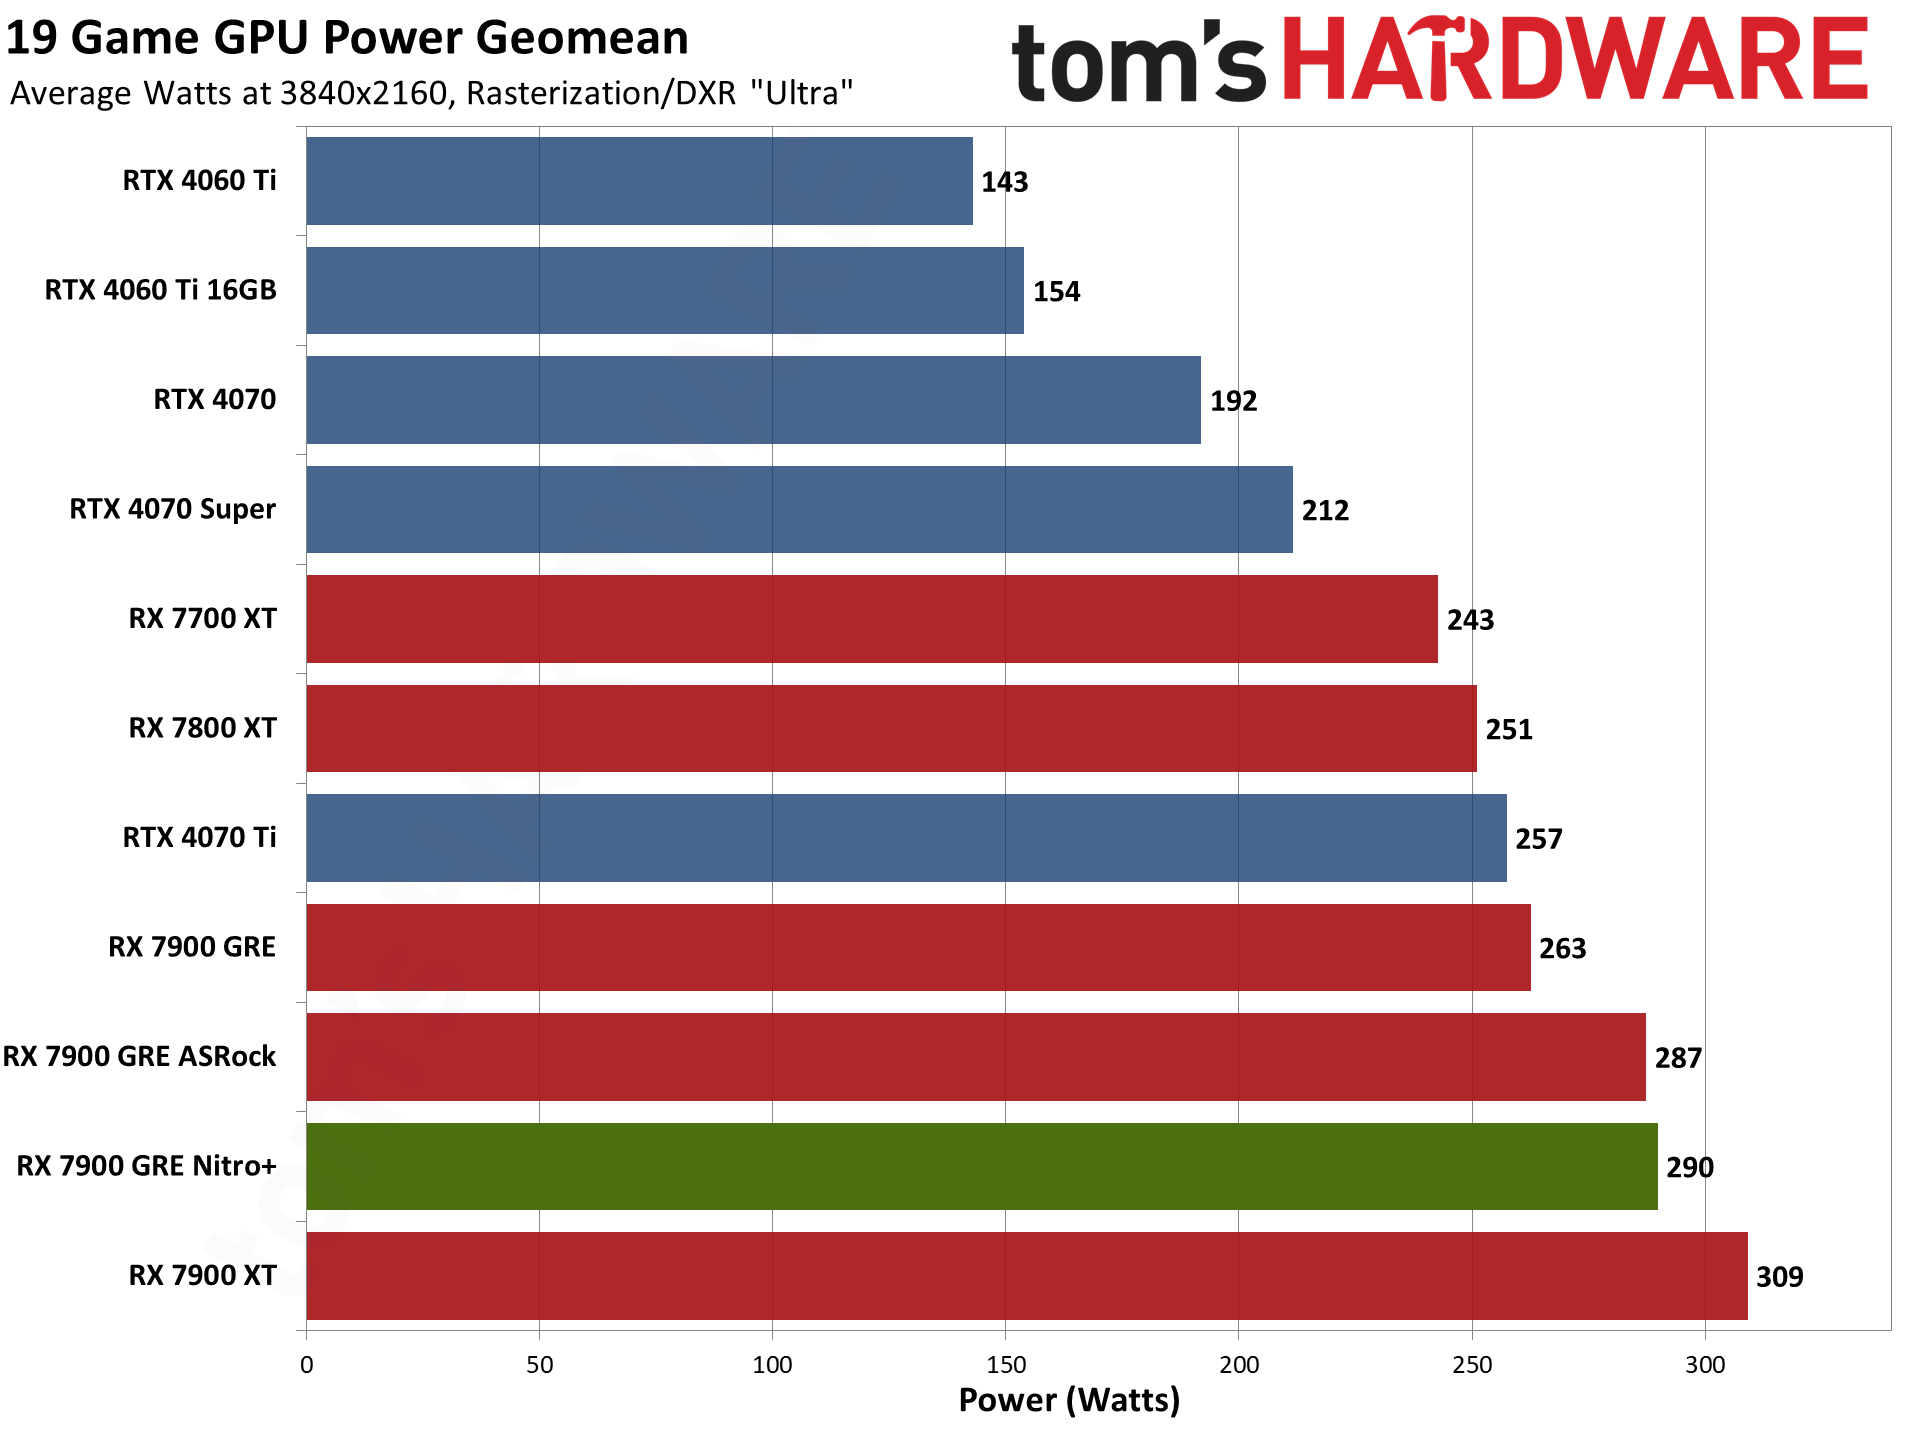
Sapphire gives a 295W TBP (Total Board Power) for the Nitro+, 35W higher than the official reference spec from AMD. The average power draw at our four test settings doesn't quite reach that high, topping out at 290W at 4K, but individual games can get there.
The highest average power (during a gaming test) comes from Cyberpunk 2077 with 297.6W. Again, that's at 4K, with the lowest power from the games we tested for 4K still hitting 286.7W. That's not much of a spread. However, dropping to 1440p gives a power range of 228–292 watts, 1080p ultra is 134–193 watts, and 1080p medium shows 145–294 watts. Diablo IV and Flight Simulator fall well below most other games at 1080p, as they're very much CPU limited at our test settings with that resolution.
The potential concern here is that the Sapphire Pulse draws 10W to 27W less power across our test suite. That's not a huge difference, but neither is there a major performance difference between the two GPUs. The ASRock Steel Legend incidentally uses slightly more power than the Nitro+, except at 4K where it's 3W less.
Sapphire RX 7900 GRE Nitro+ Clock Speeds
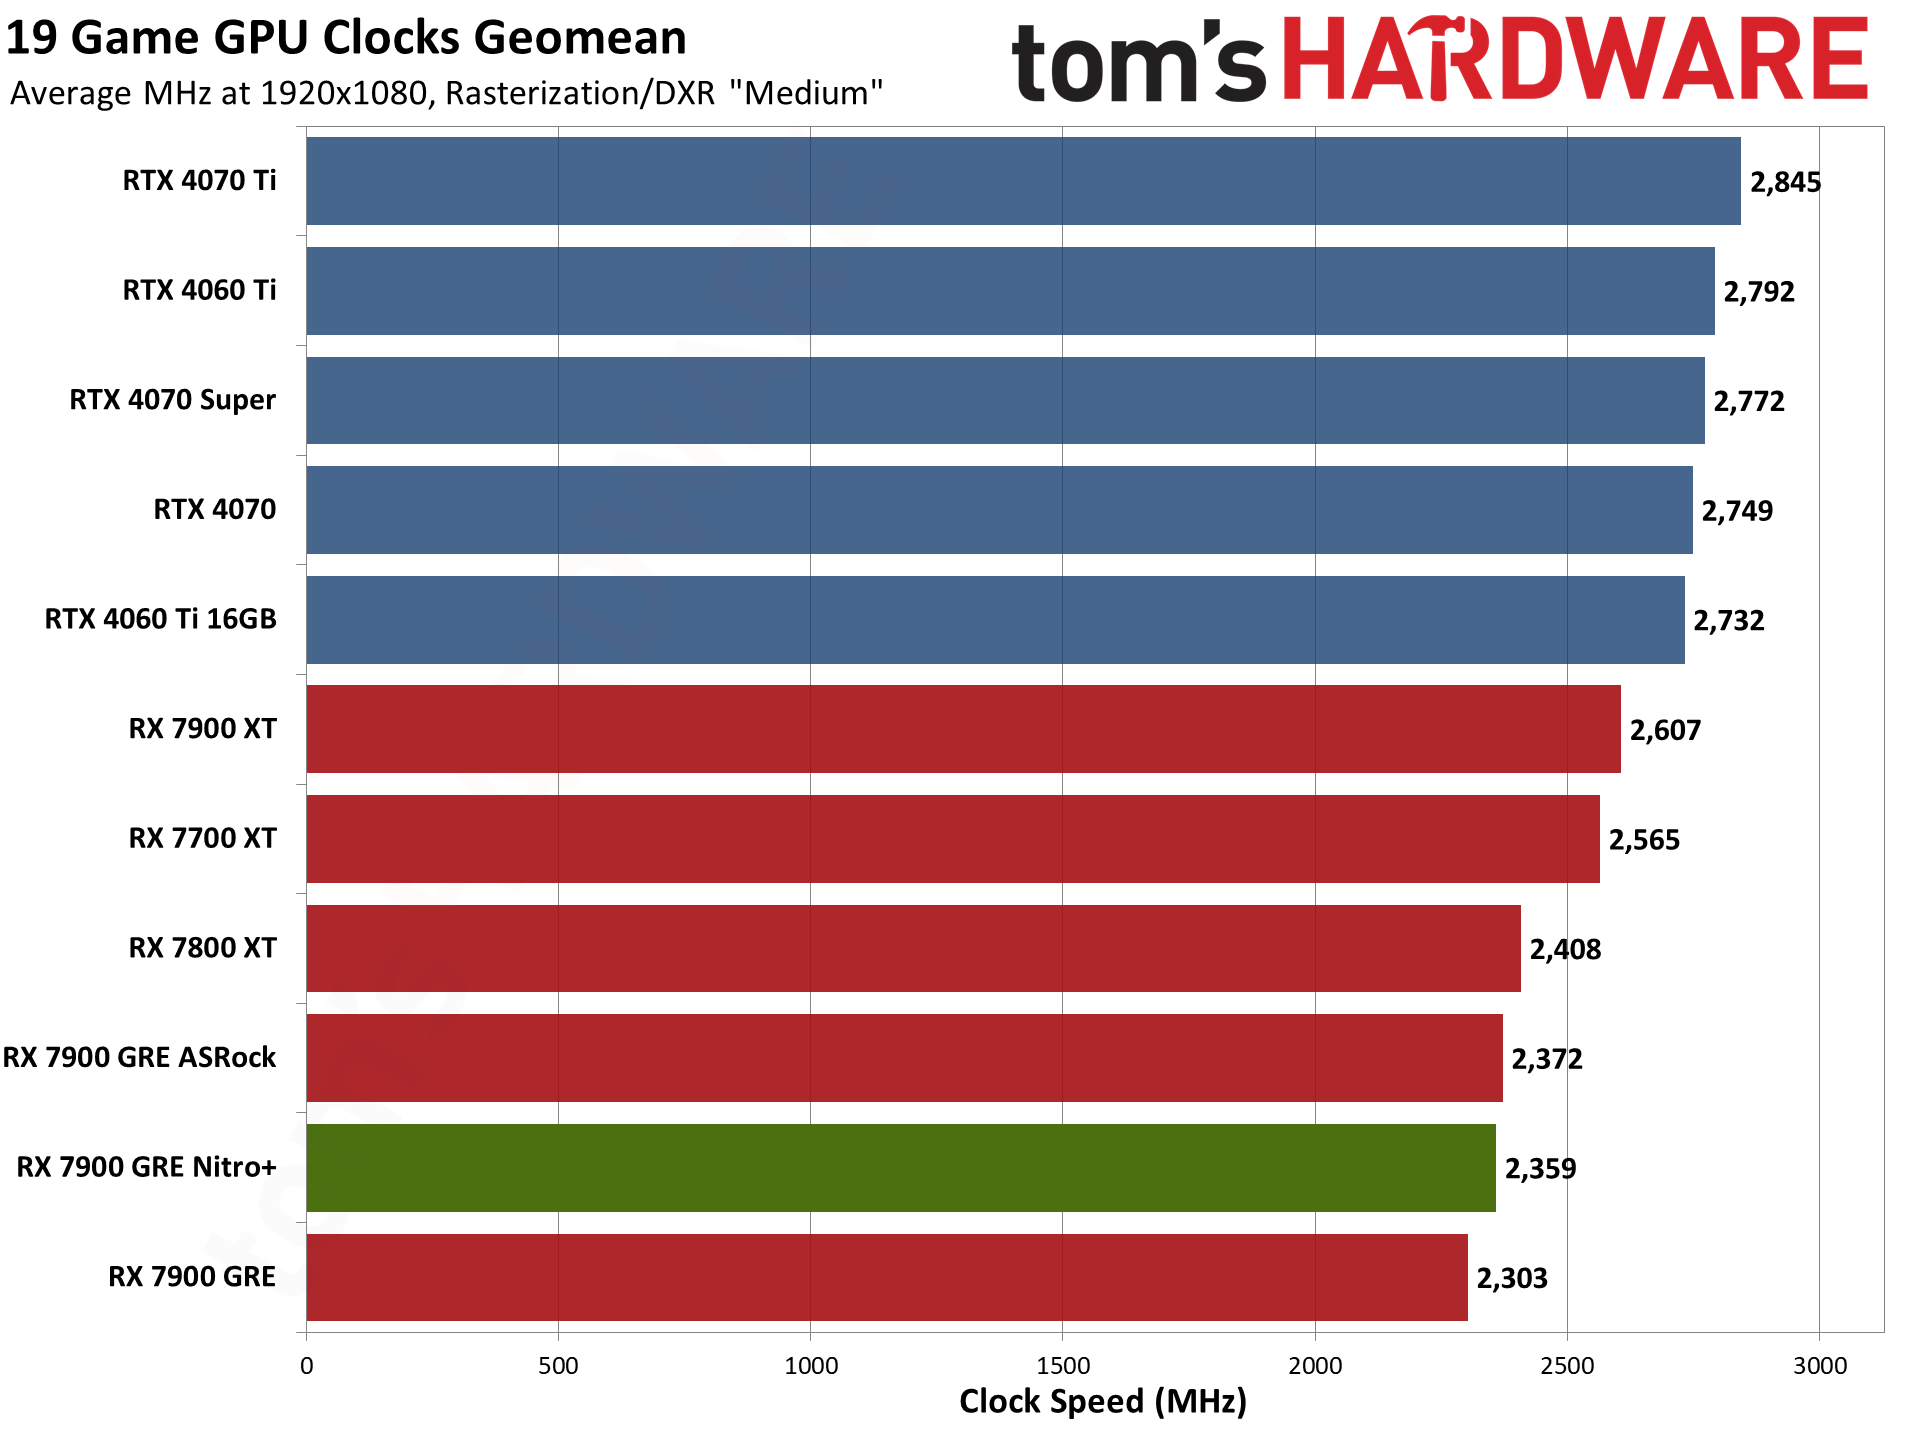
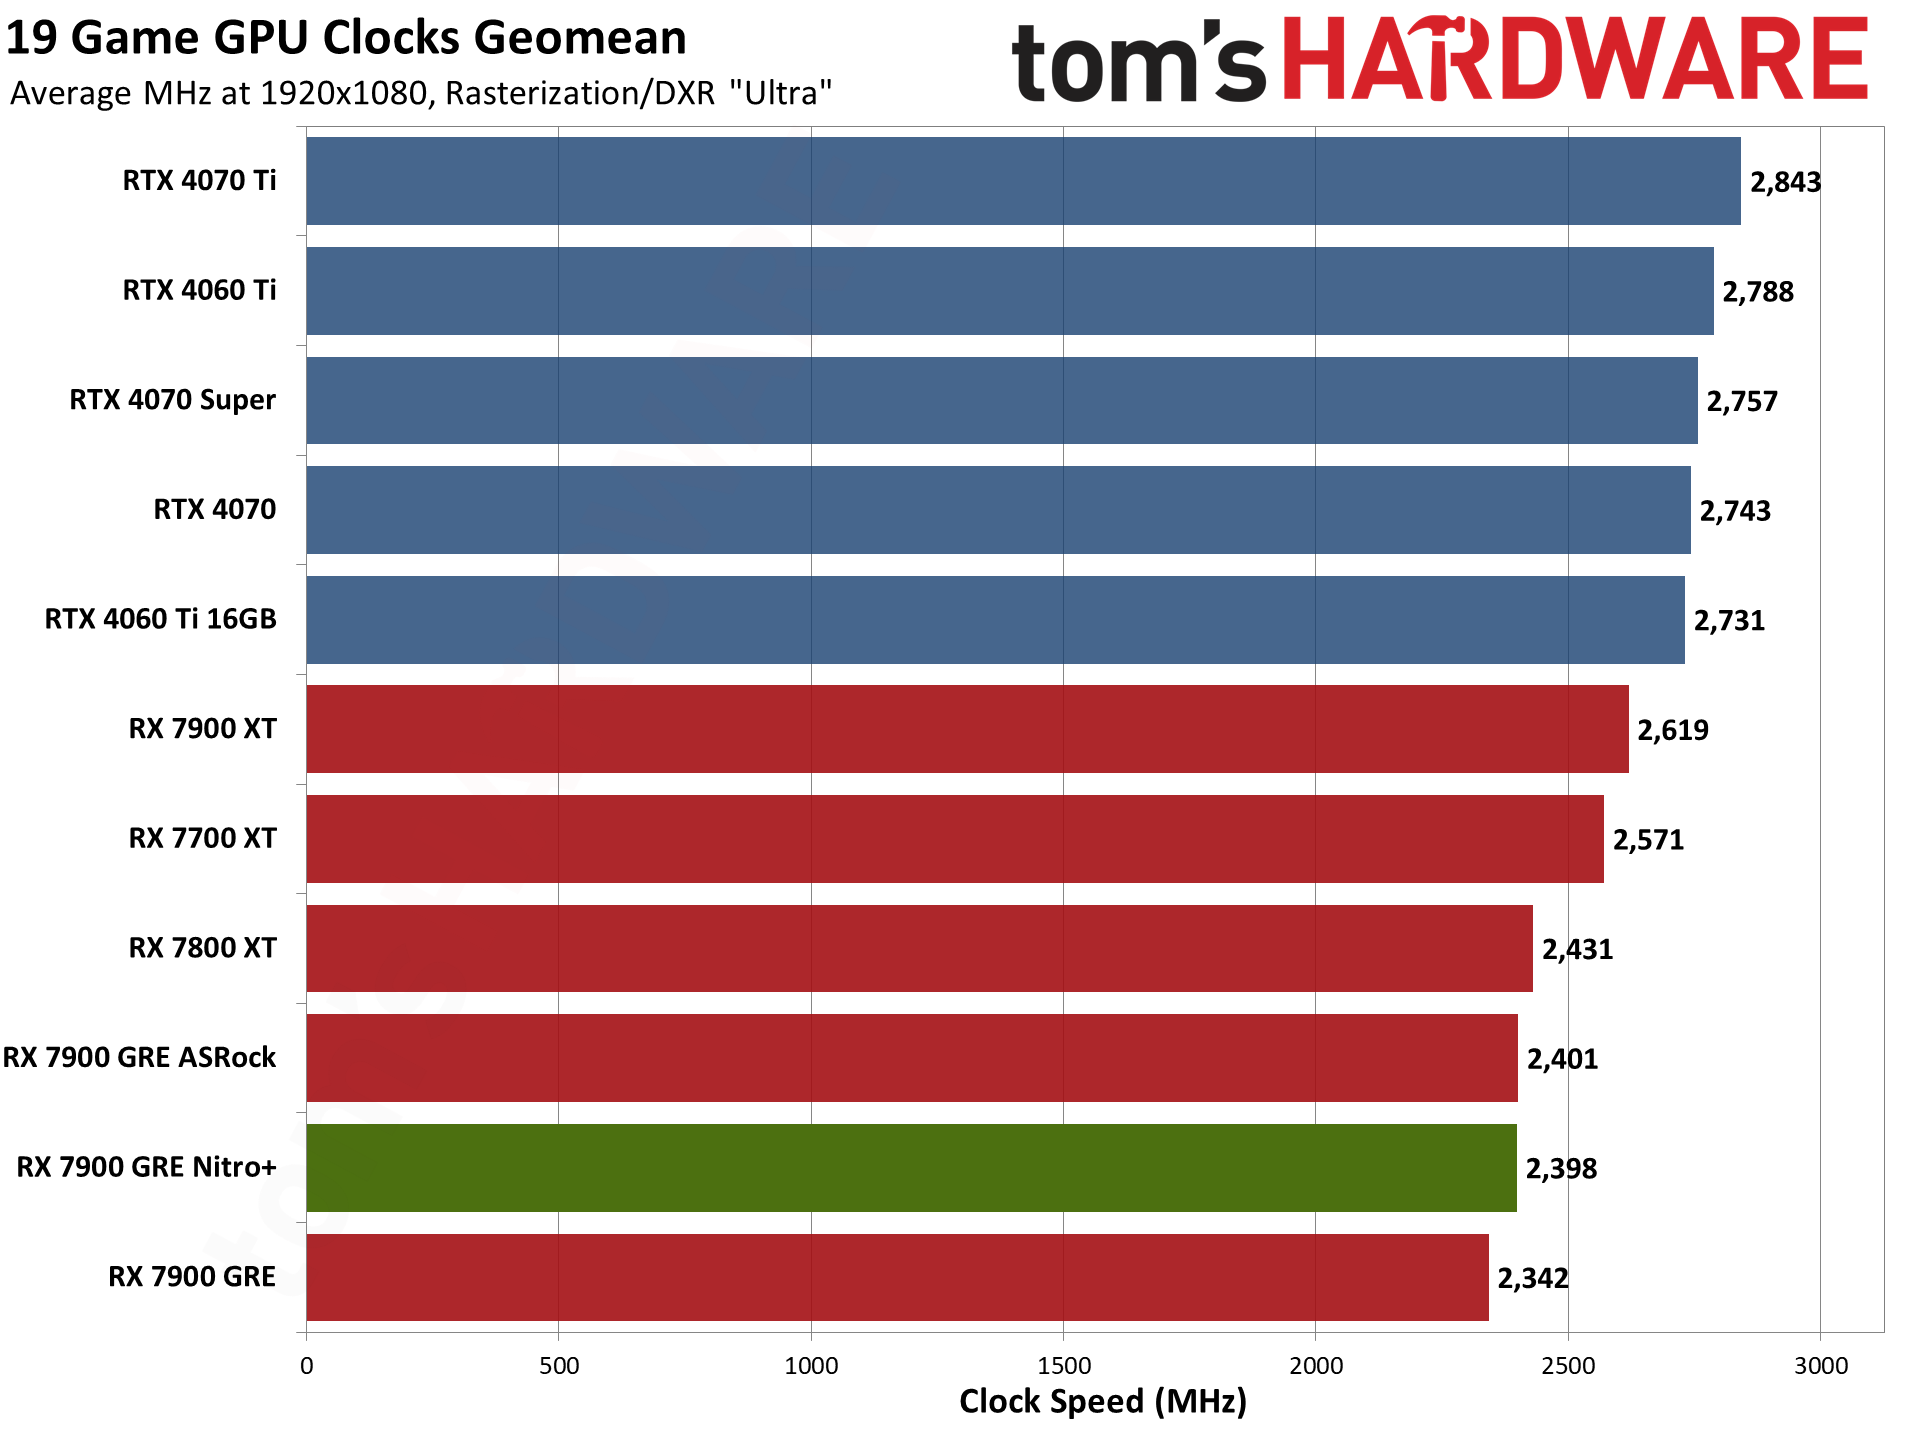
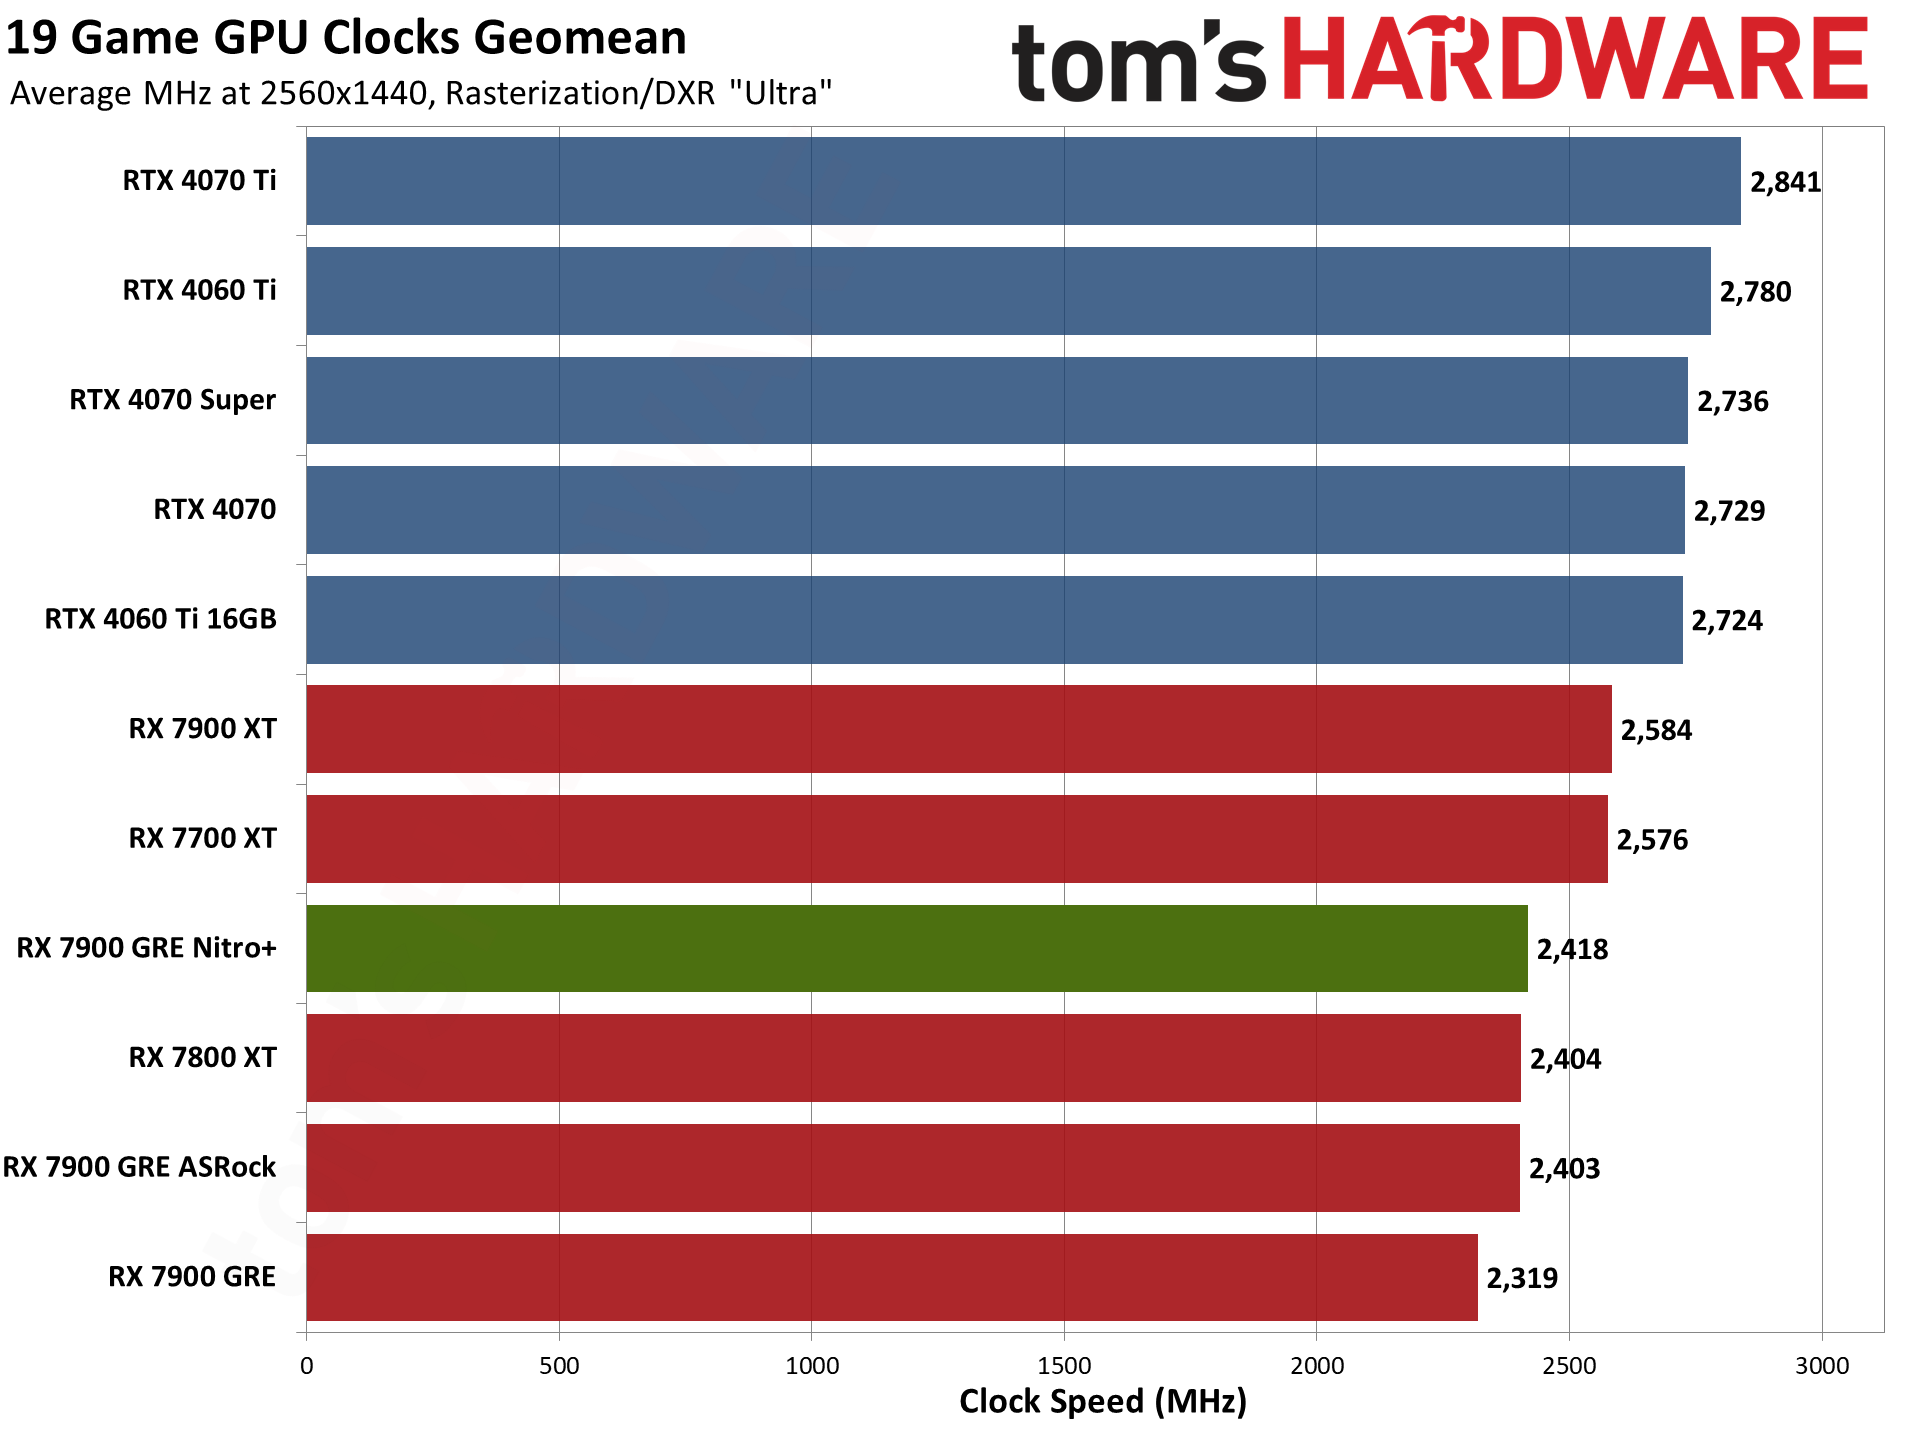
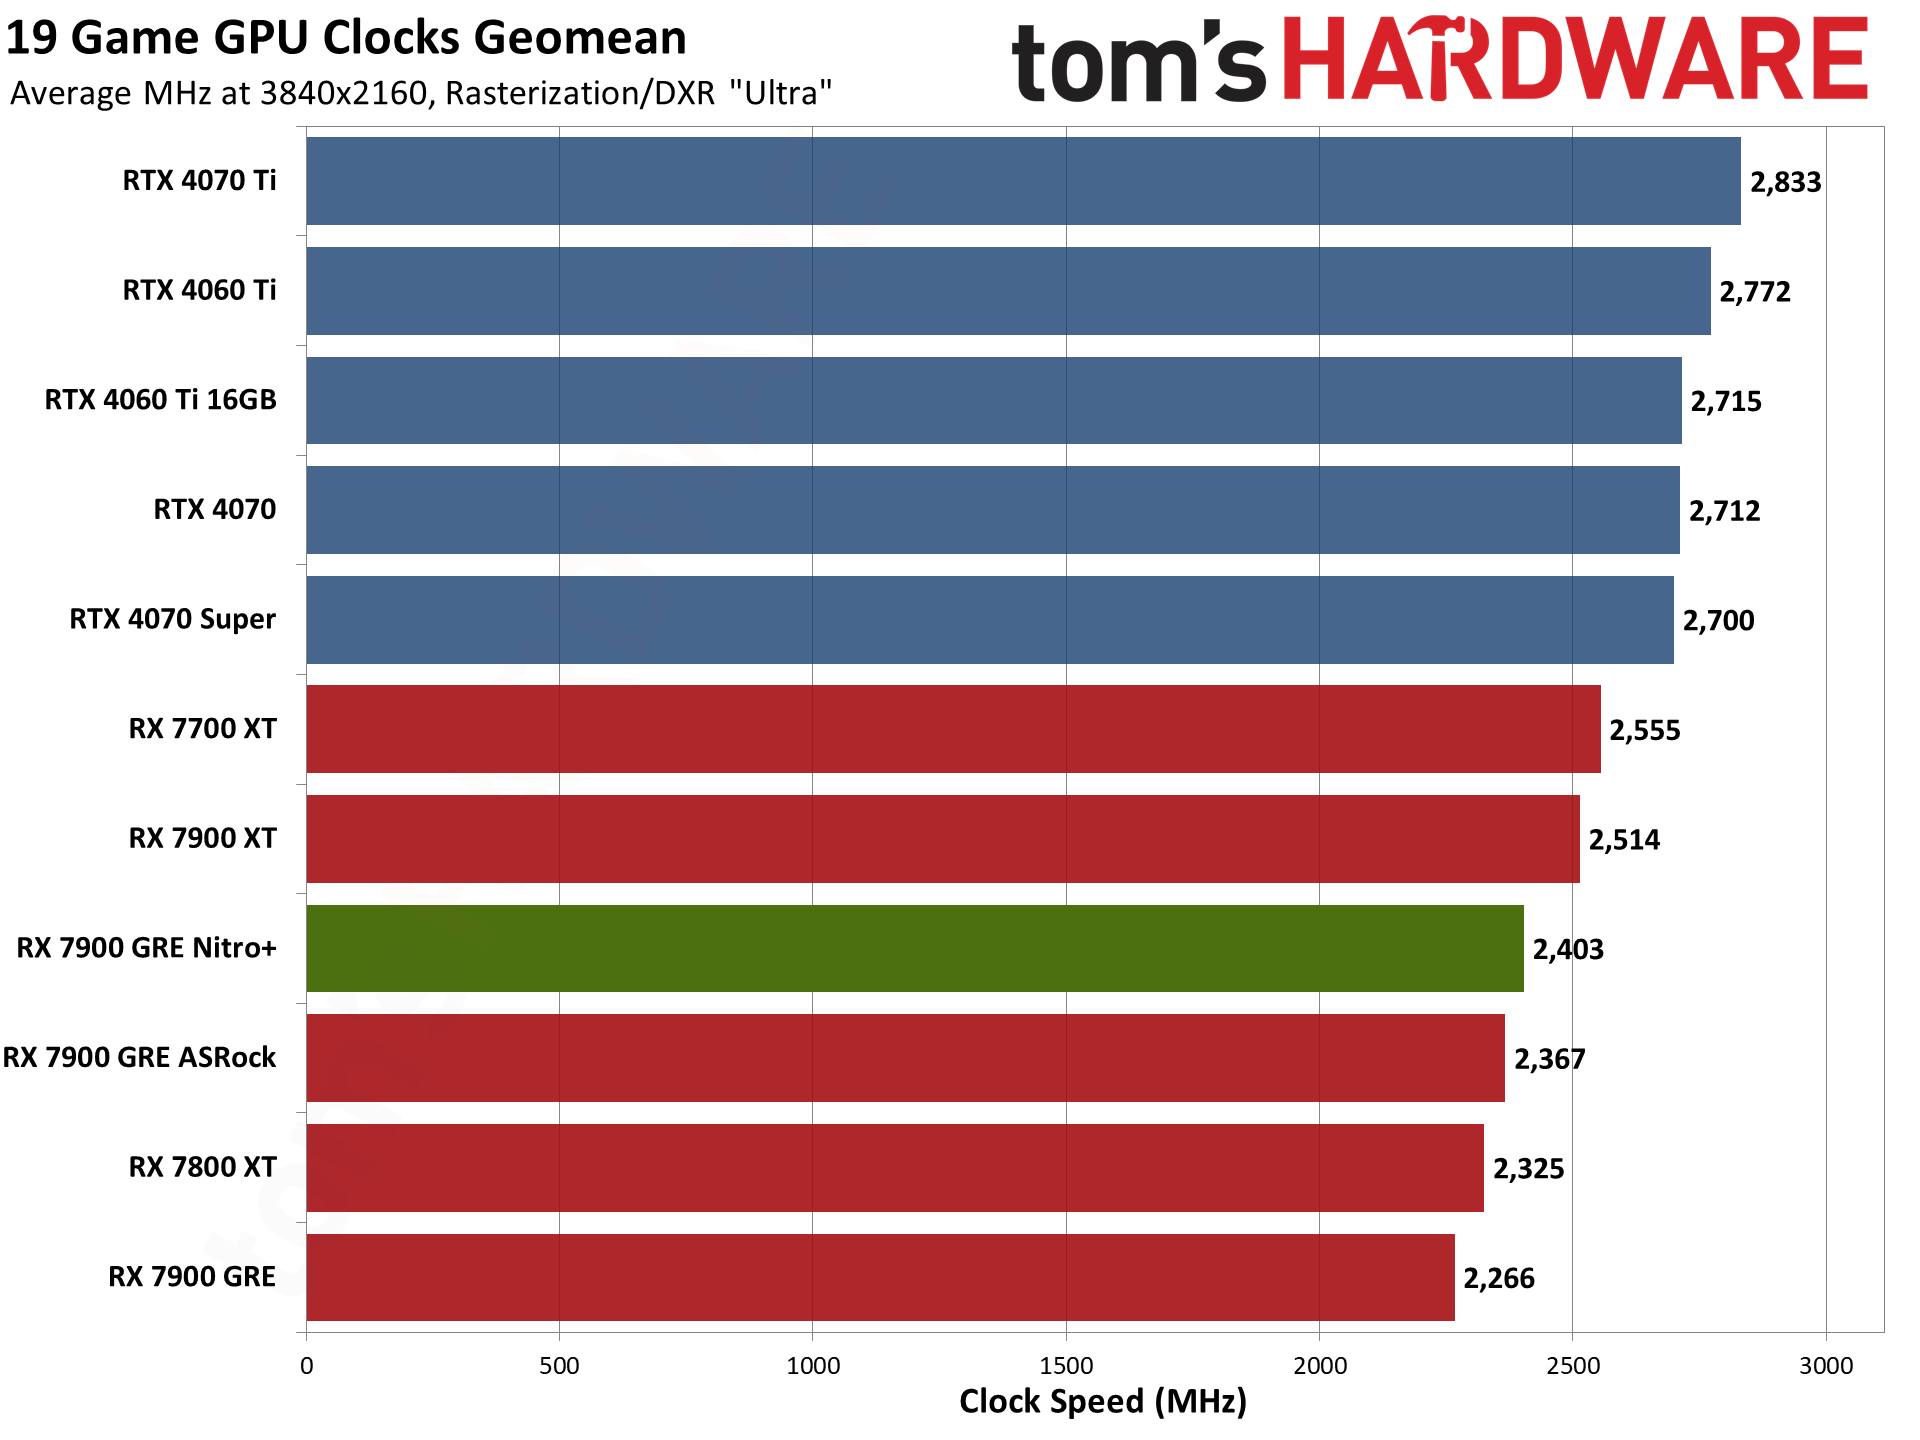
Boost clocks and power limits play into the average GPU clock speed, so these charts are mostly interesting as a way to see how close the various GPUs come to their stated boost clocks.
The Nitro+ doesn't quite hit its advertised 2391 MHz at 1080p medium, in part because games like Diablo IV, Far Cry 6, and Flight Simulator bring the average down thanks to hitting CPU limits. The highest average boost clocks while playing through our gaming suite easily exceed the boost clock, however, with a few titles landing around 2550 MHz — Assassin's Creed, Avatar, Diablo IV, Forza Horizon, and Spider-Man all reach into the 2500+ MHz range, depending on resolution.
Compared to the Pulse model, the Nitro+ average clocks are 50~140 MHz higher, with the bigger delta coming at 4K. That makes sense, as the higher power limit of the Nitro+ card comes into play there, and that also explains why the performance tends to be similar at 1080p. The ASRock card, incidentally, does clock about 15~35 MHz lower than the Nitro+ at 1440p and 4K. So the boost clocks are meaningful, provided the cards are pushed to the limit.
Sapphire RX 7900 GRE Nitro+ Temperatures
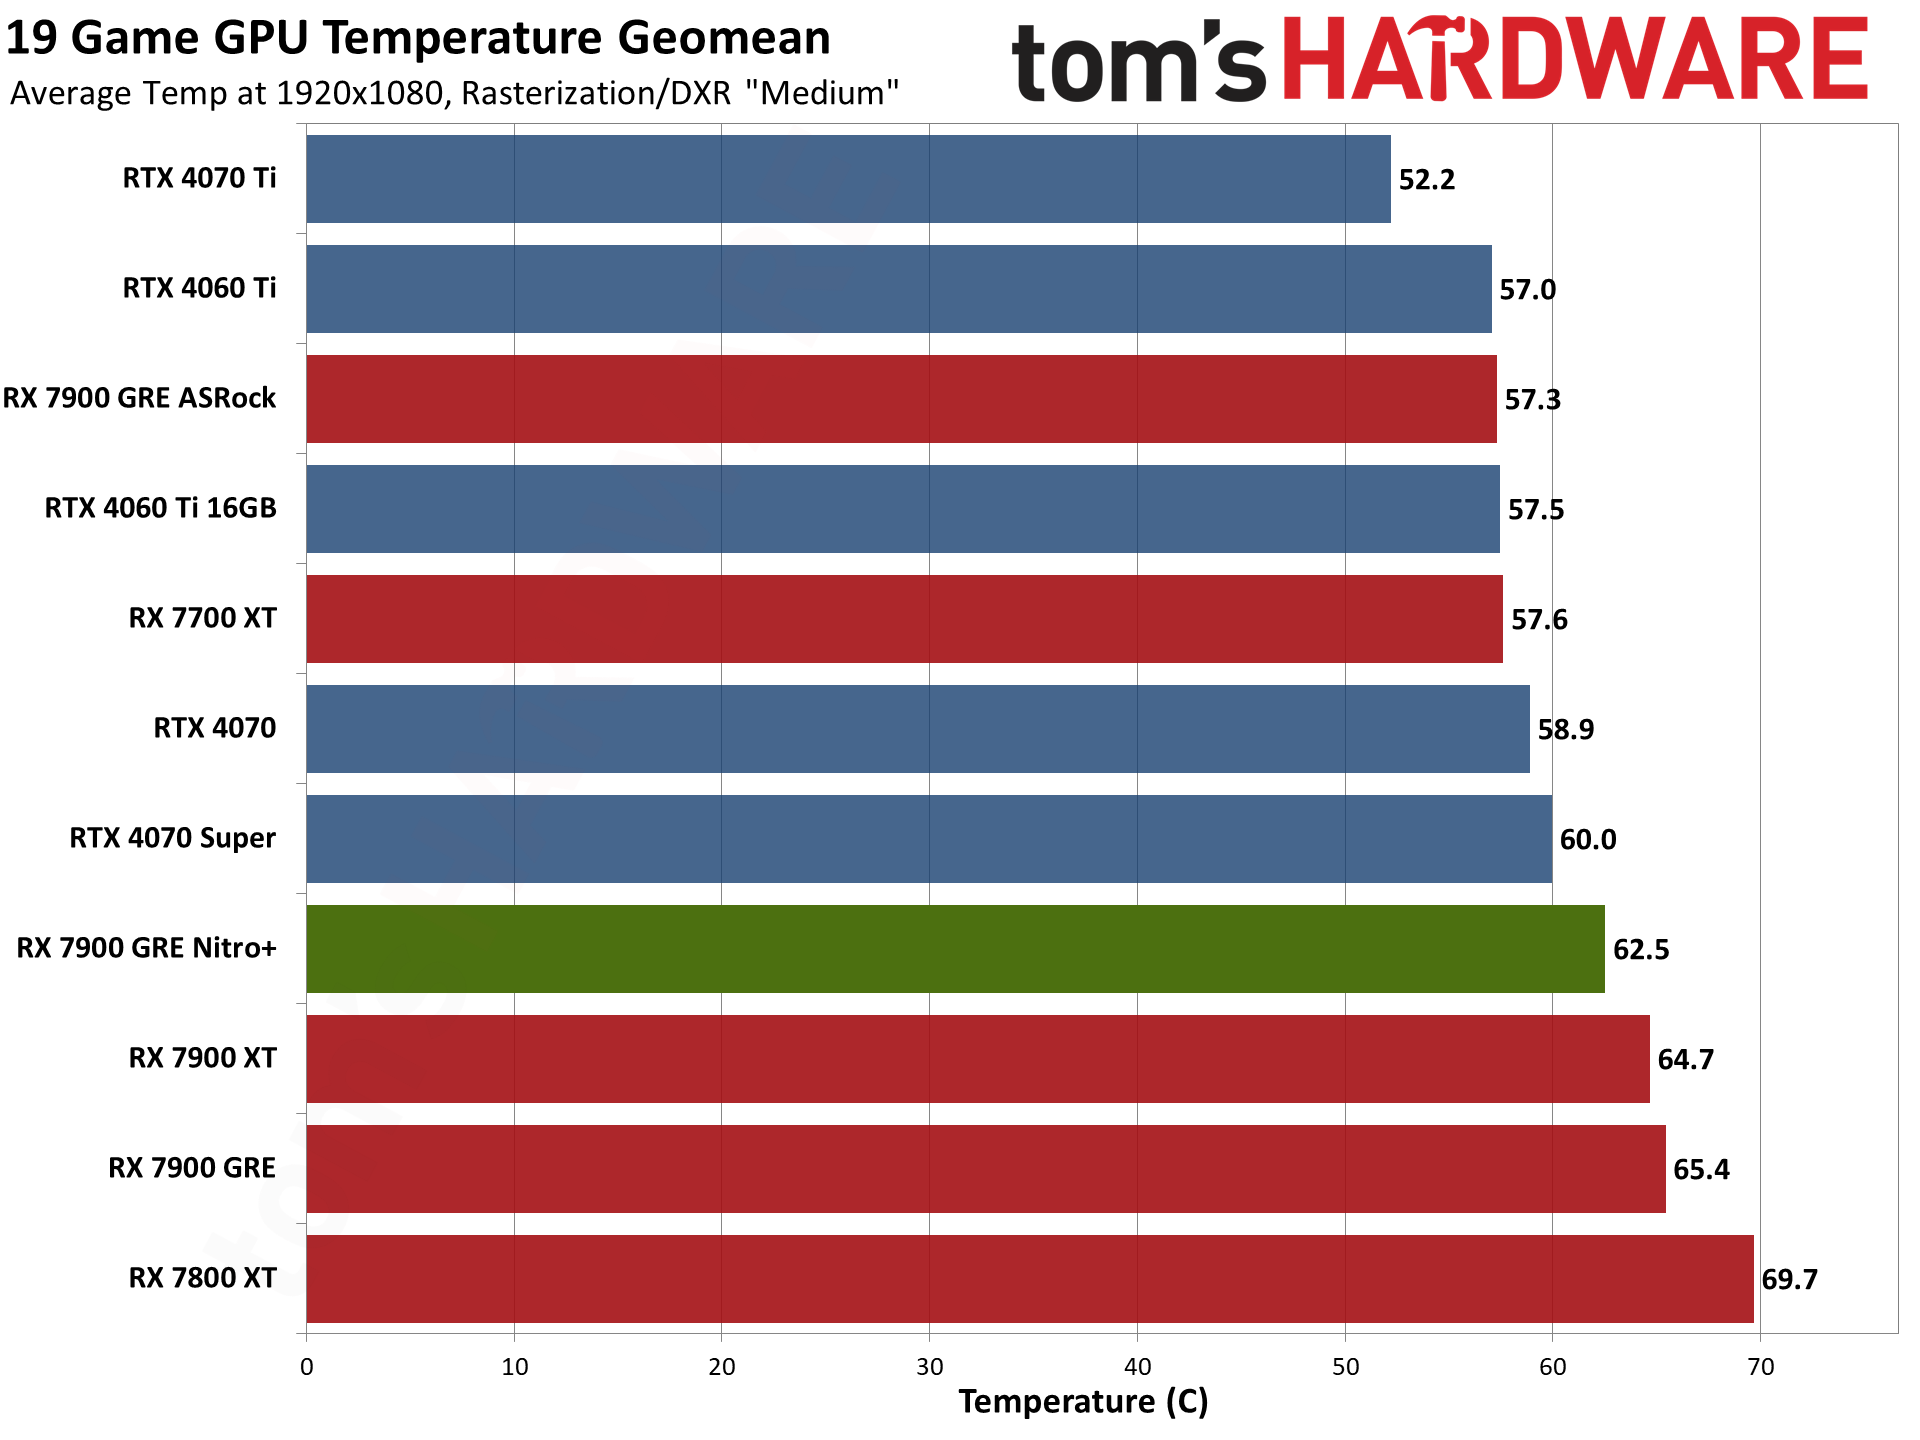
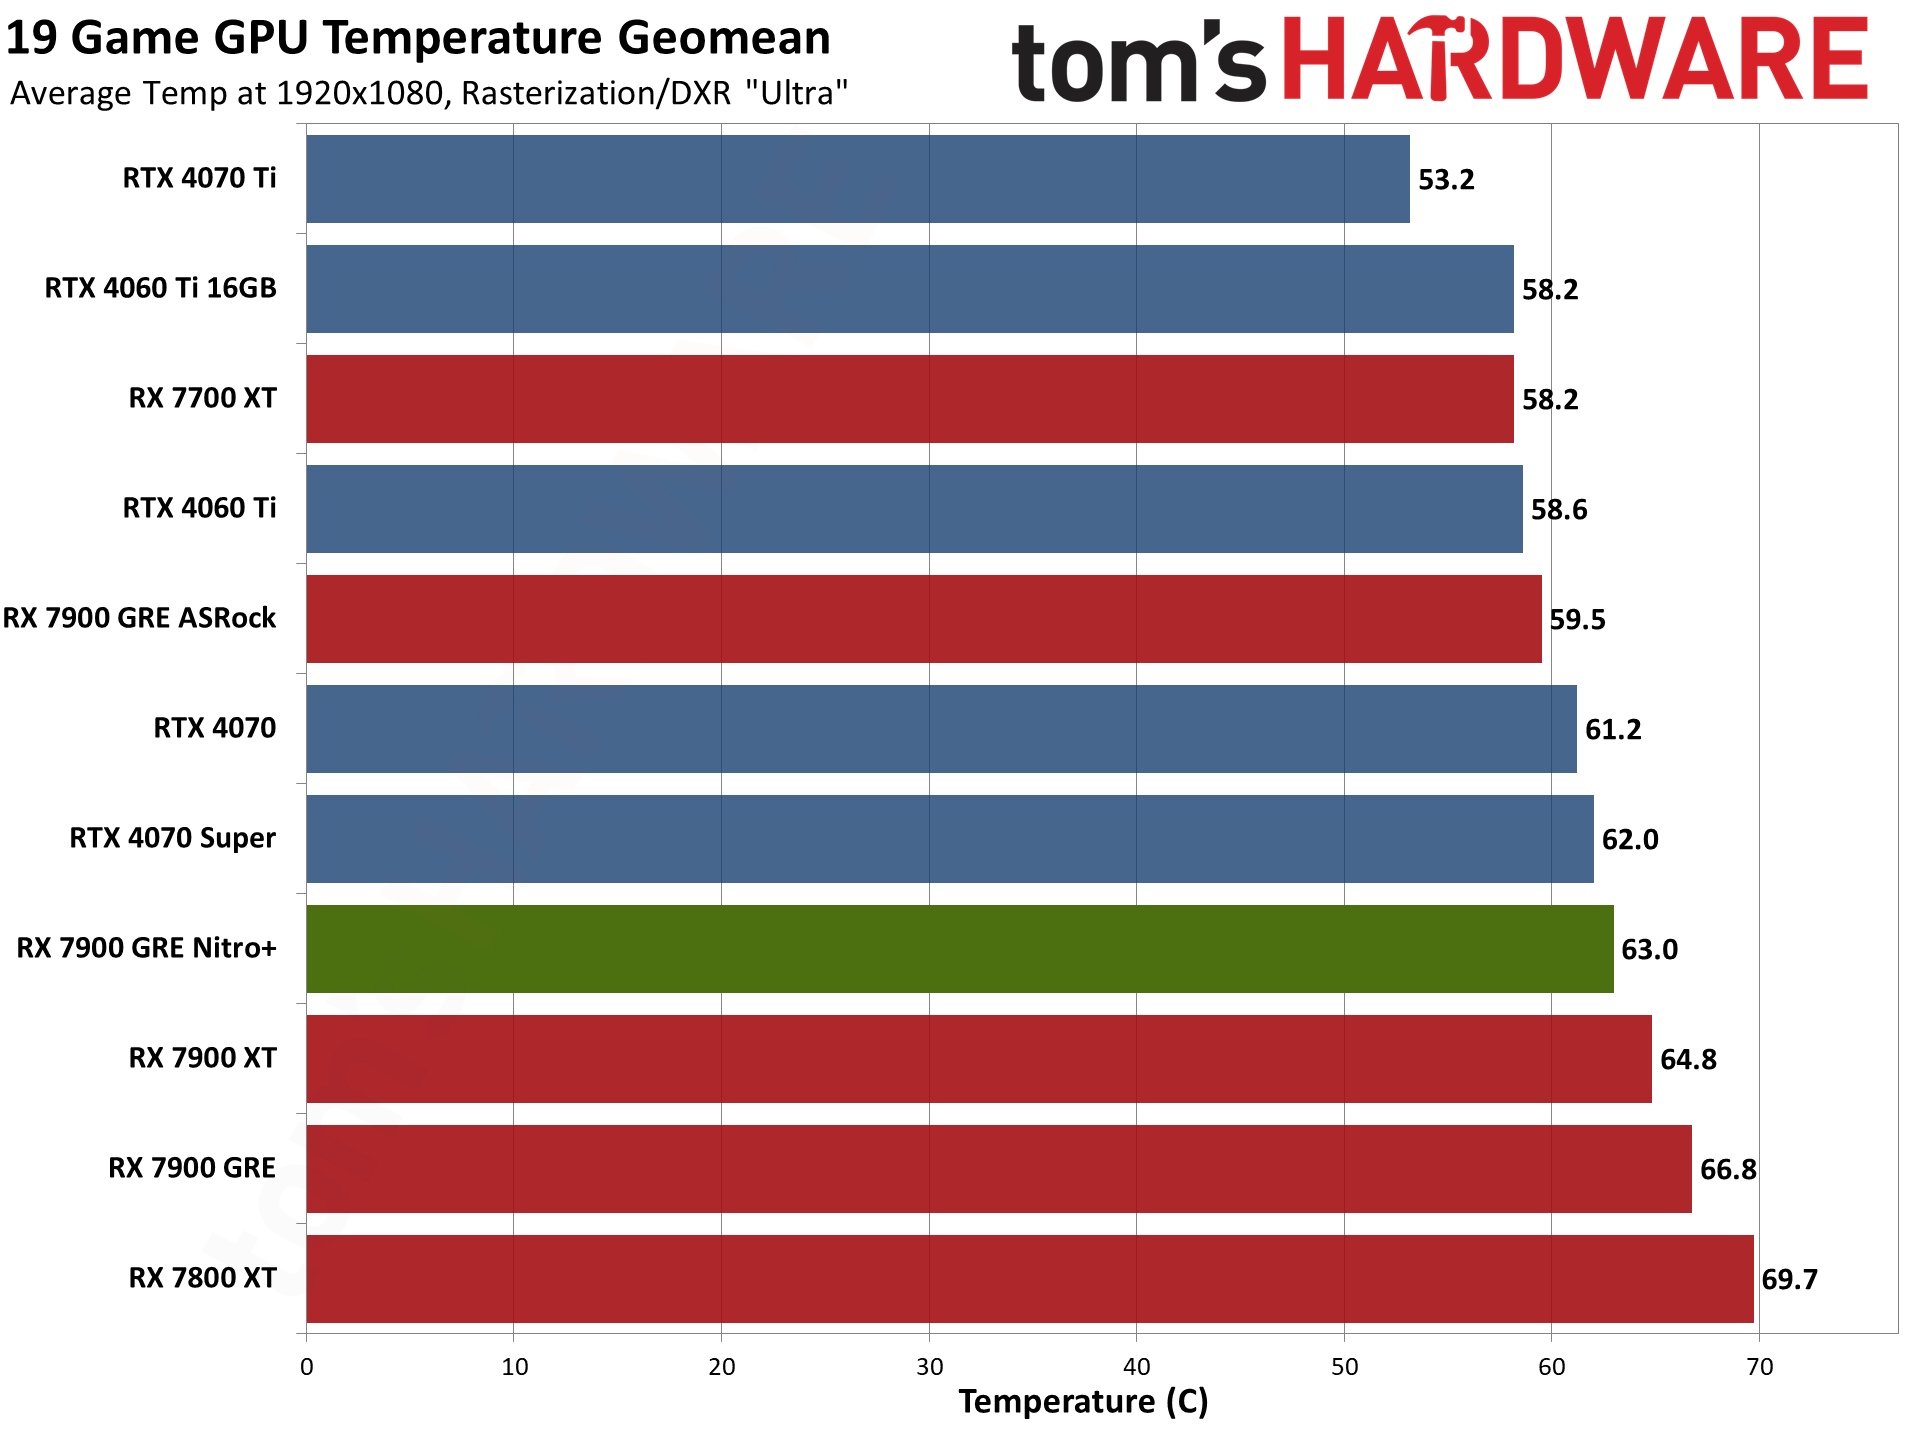
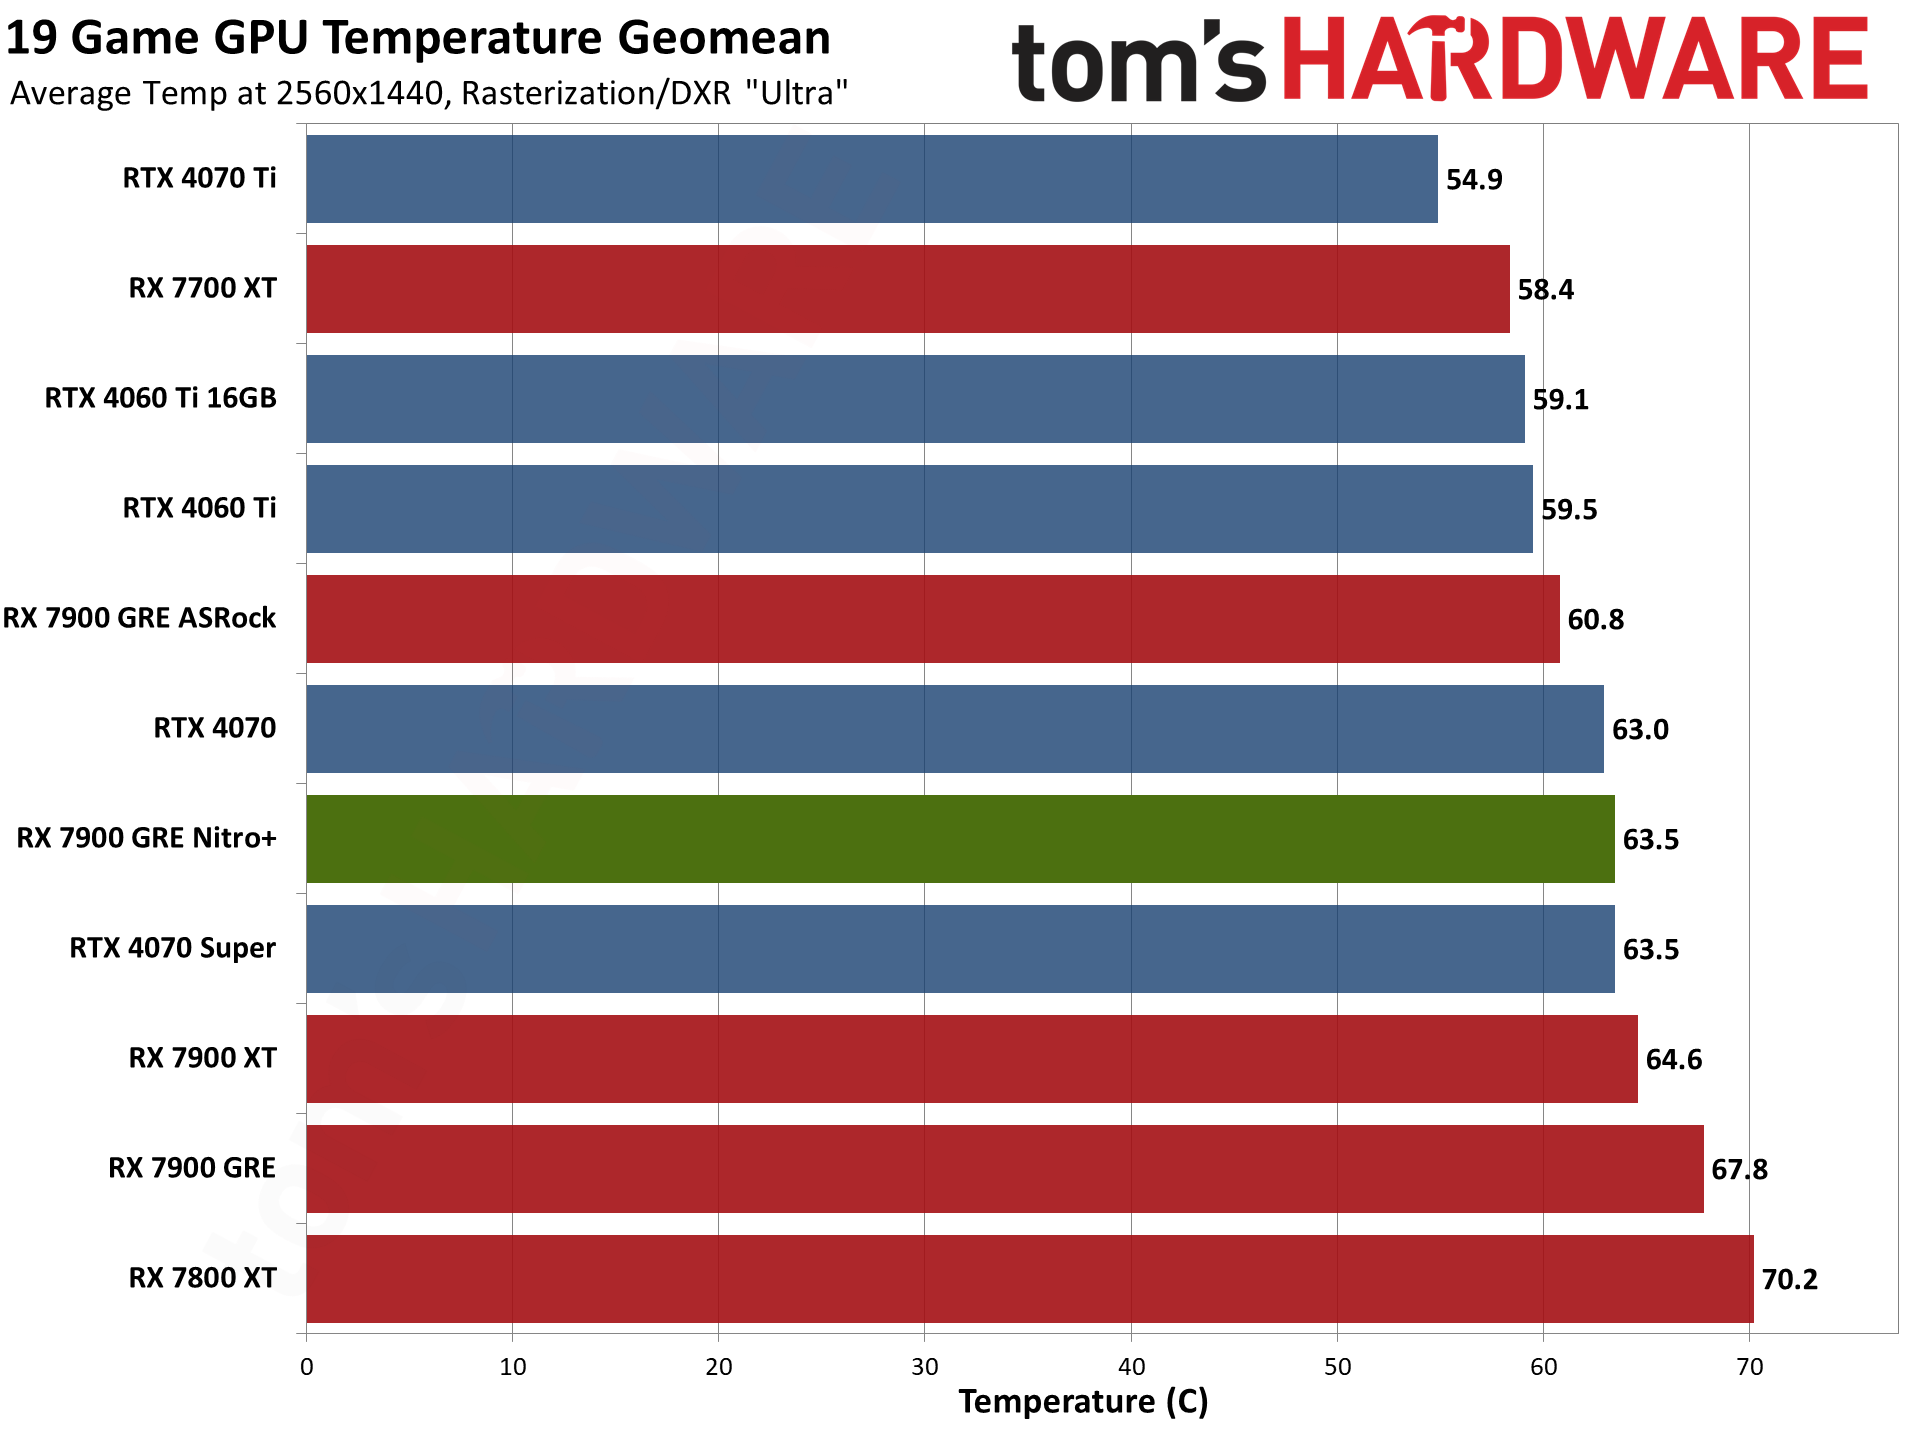
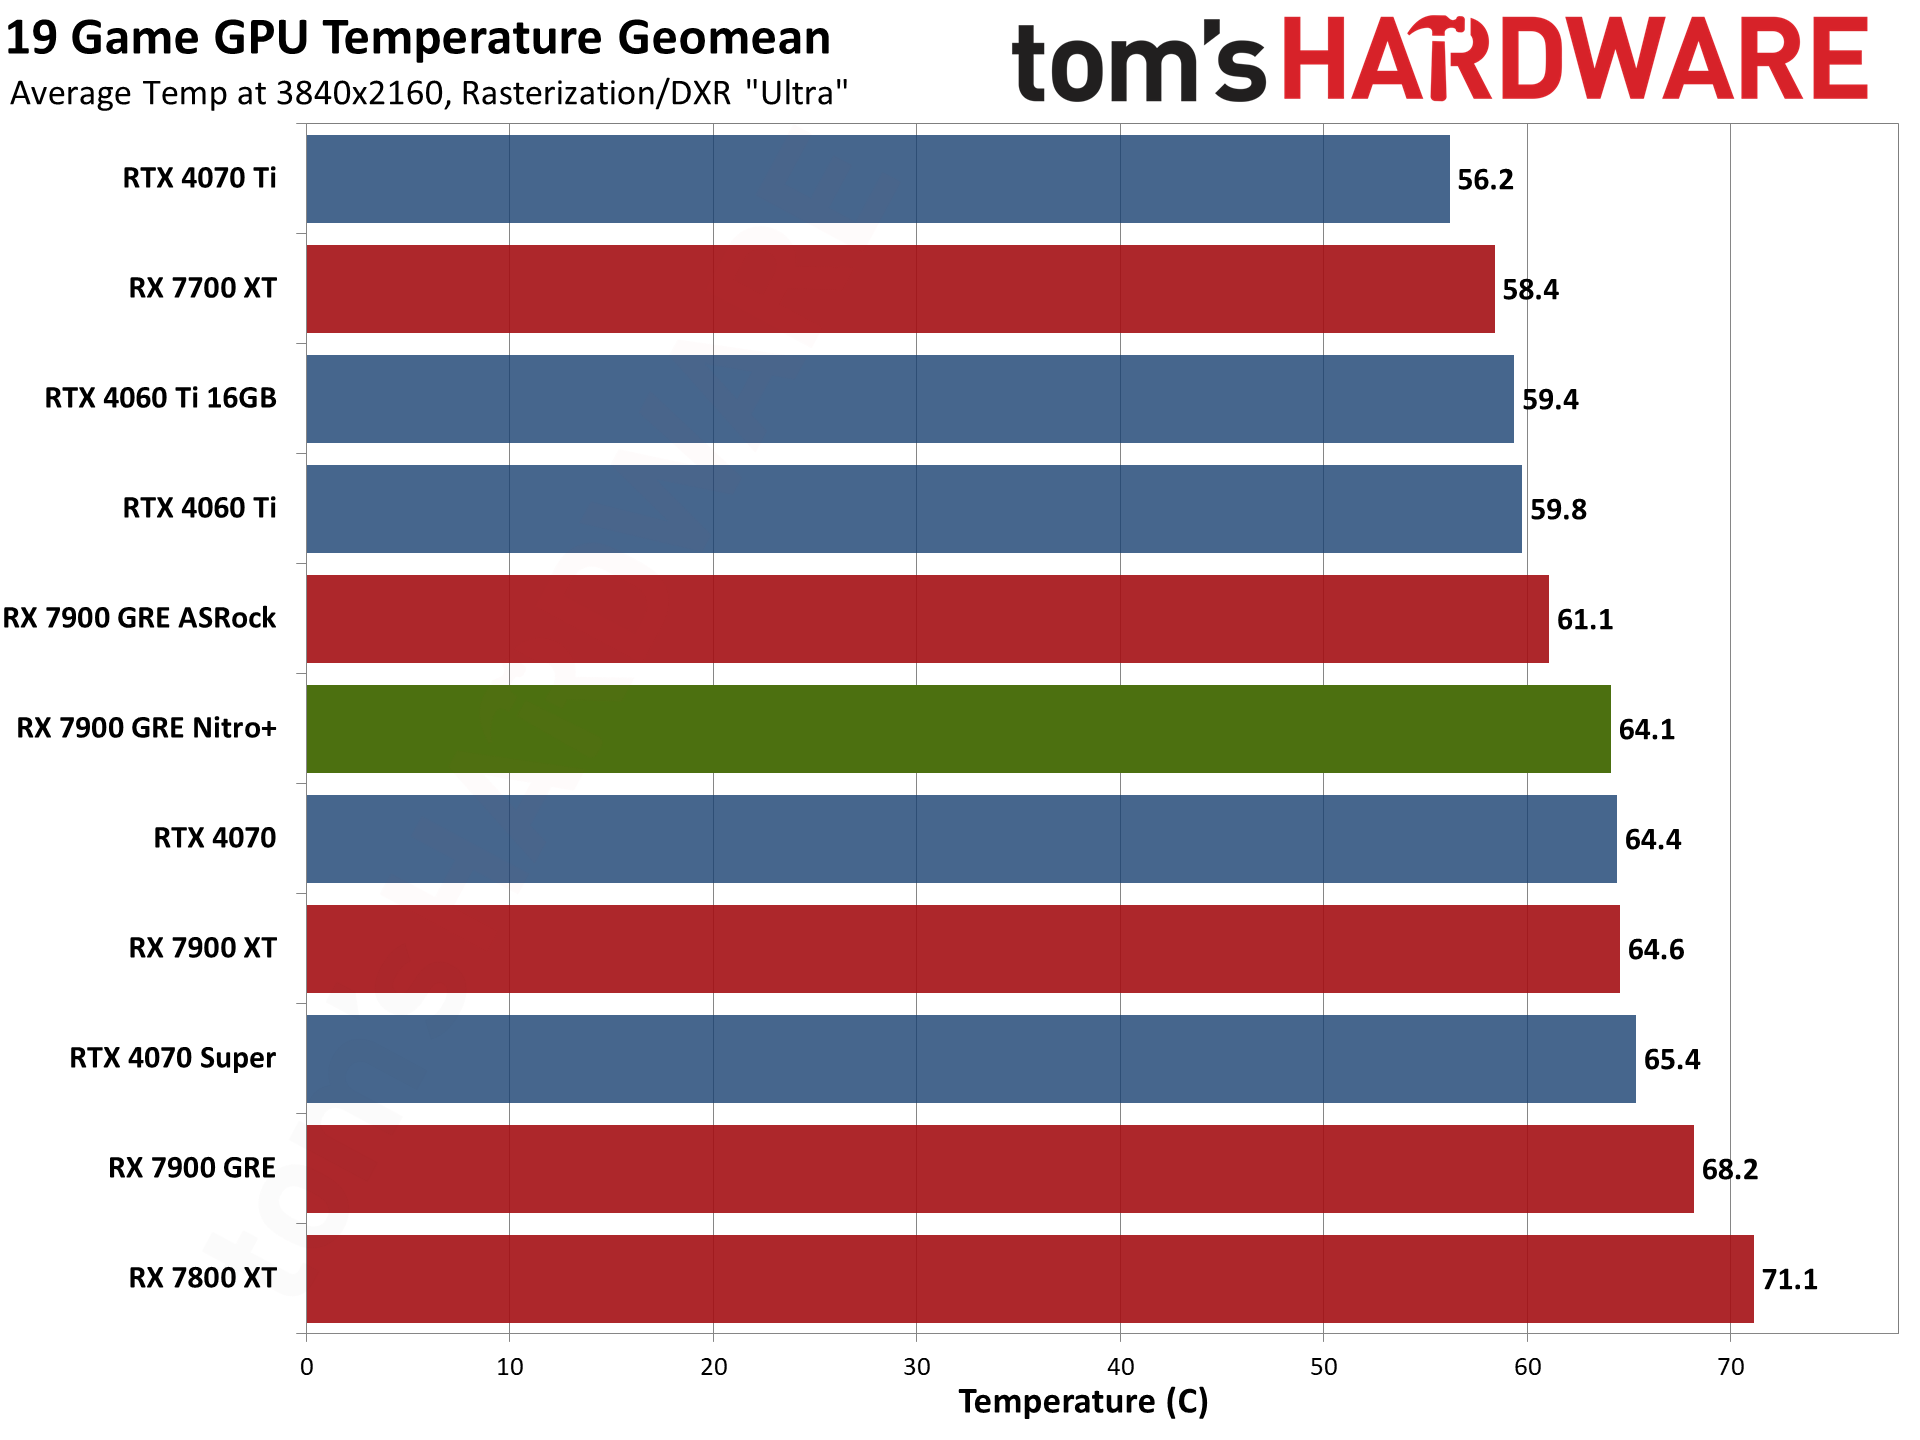
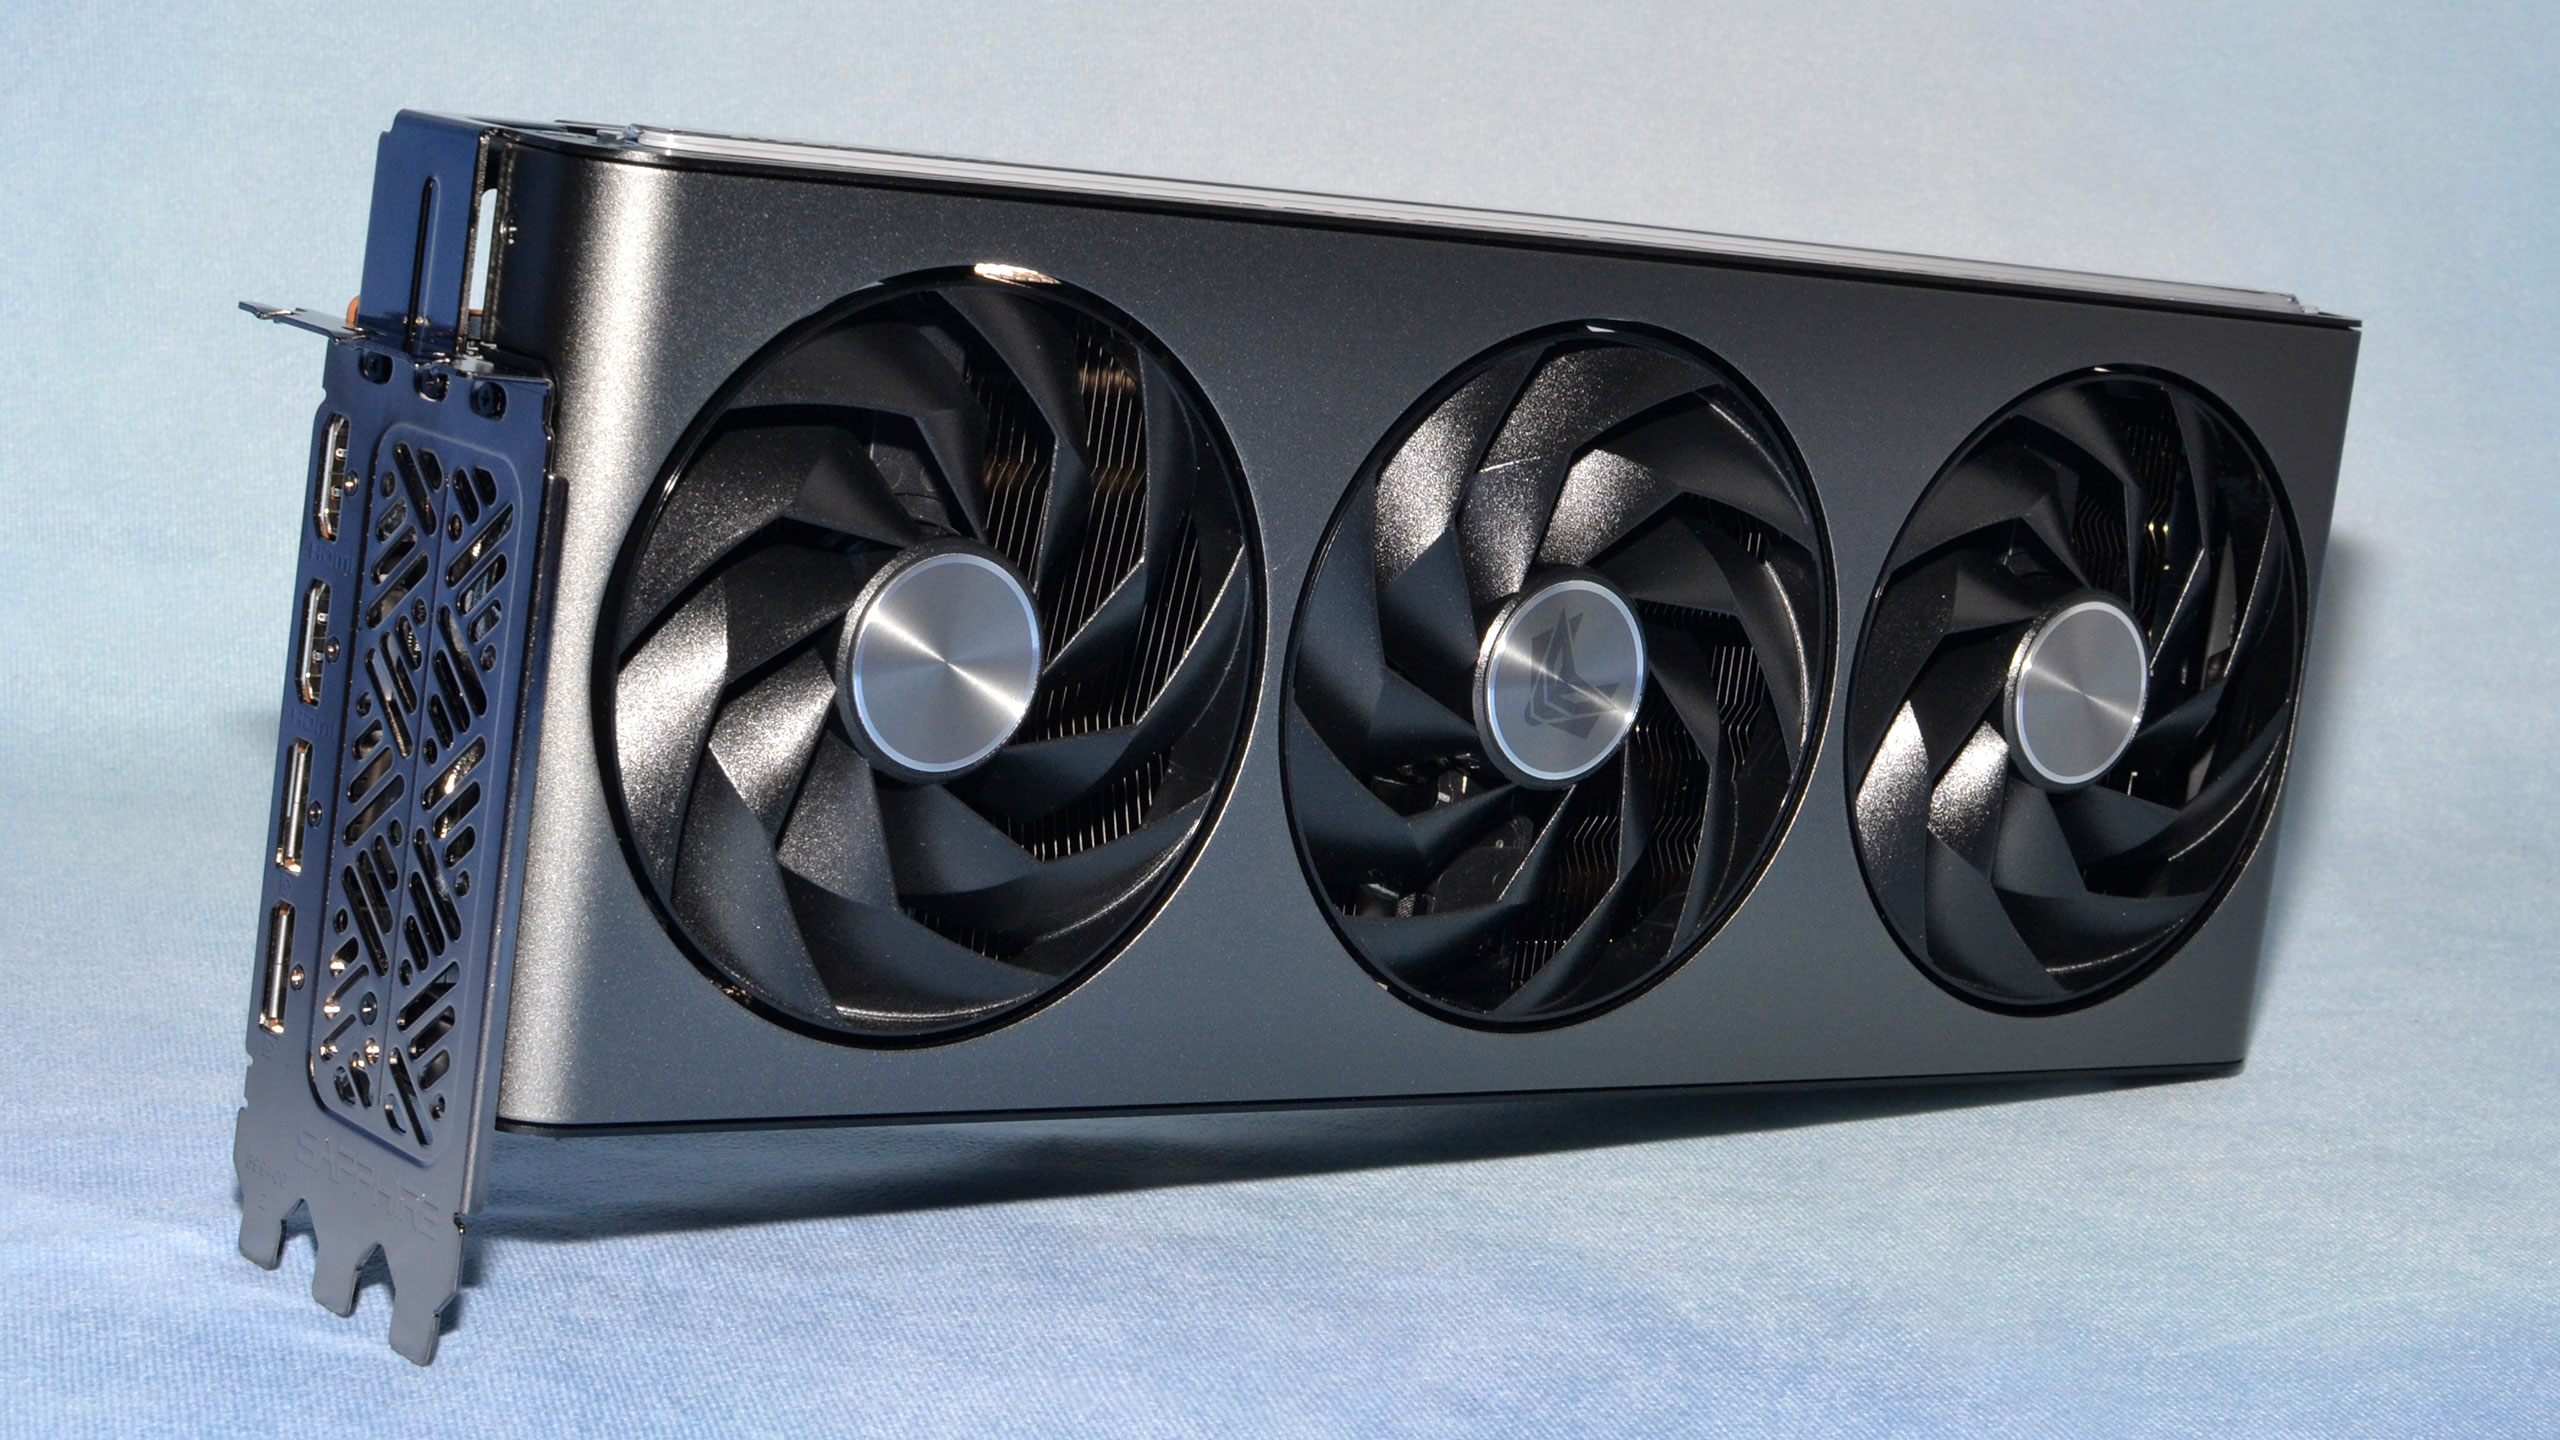
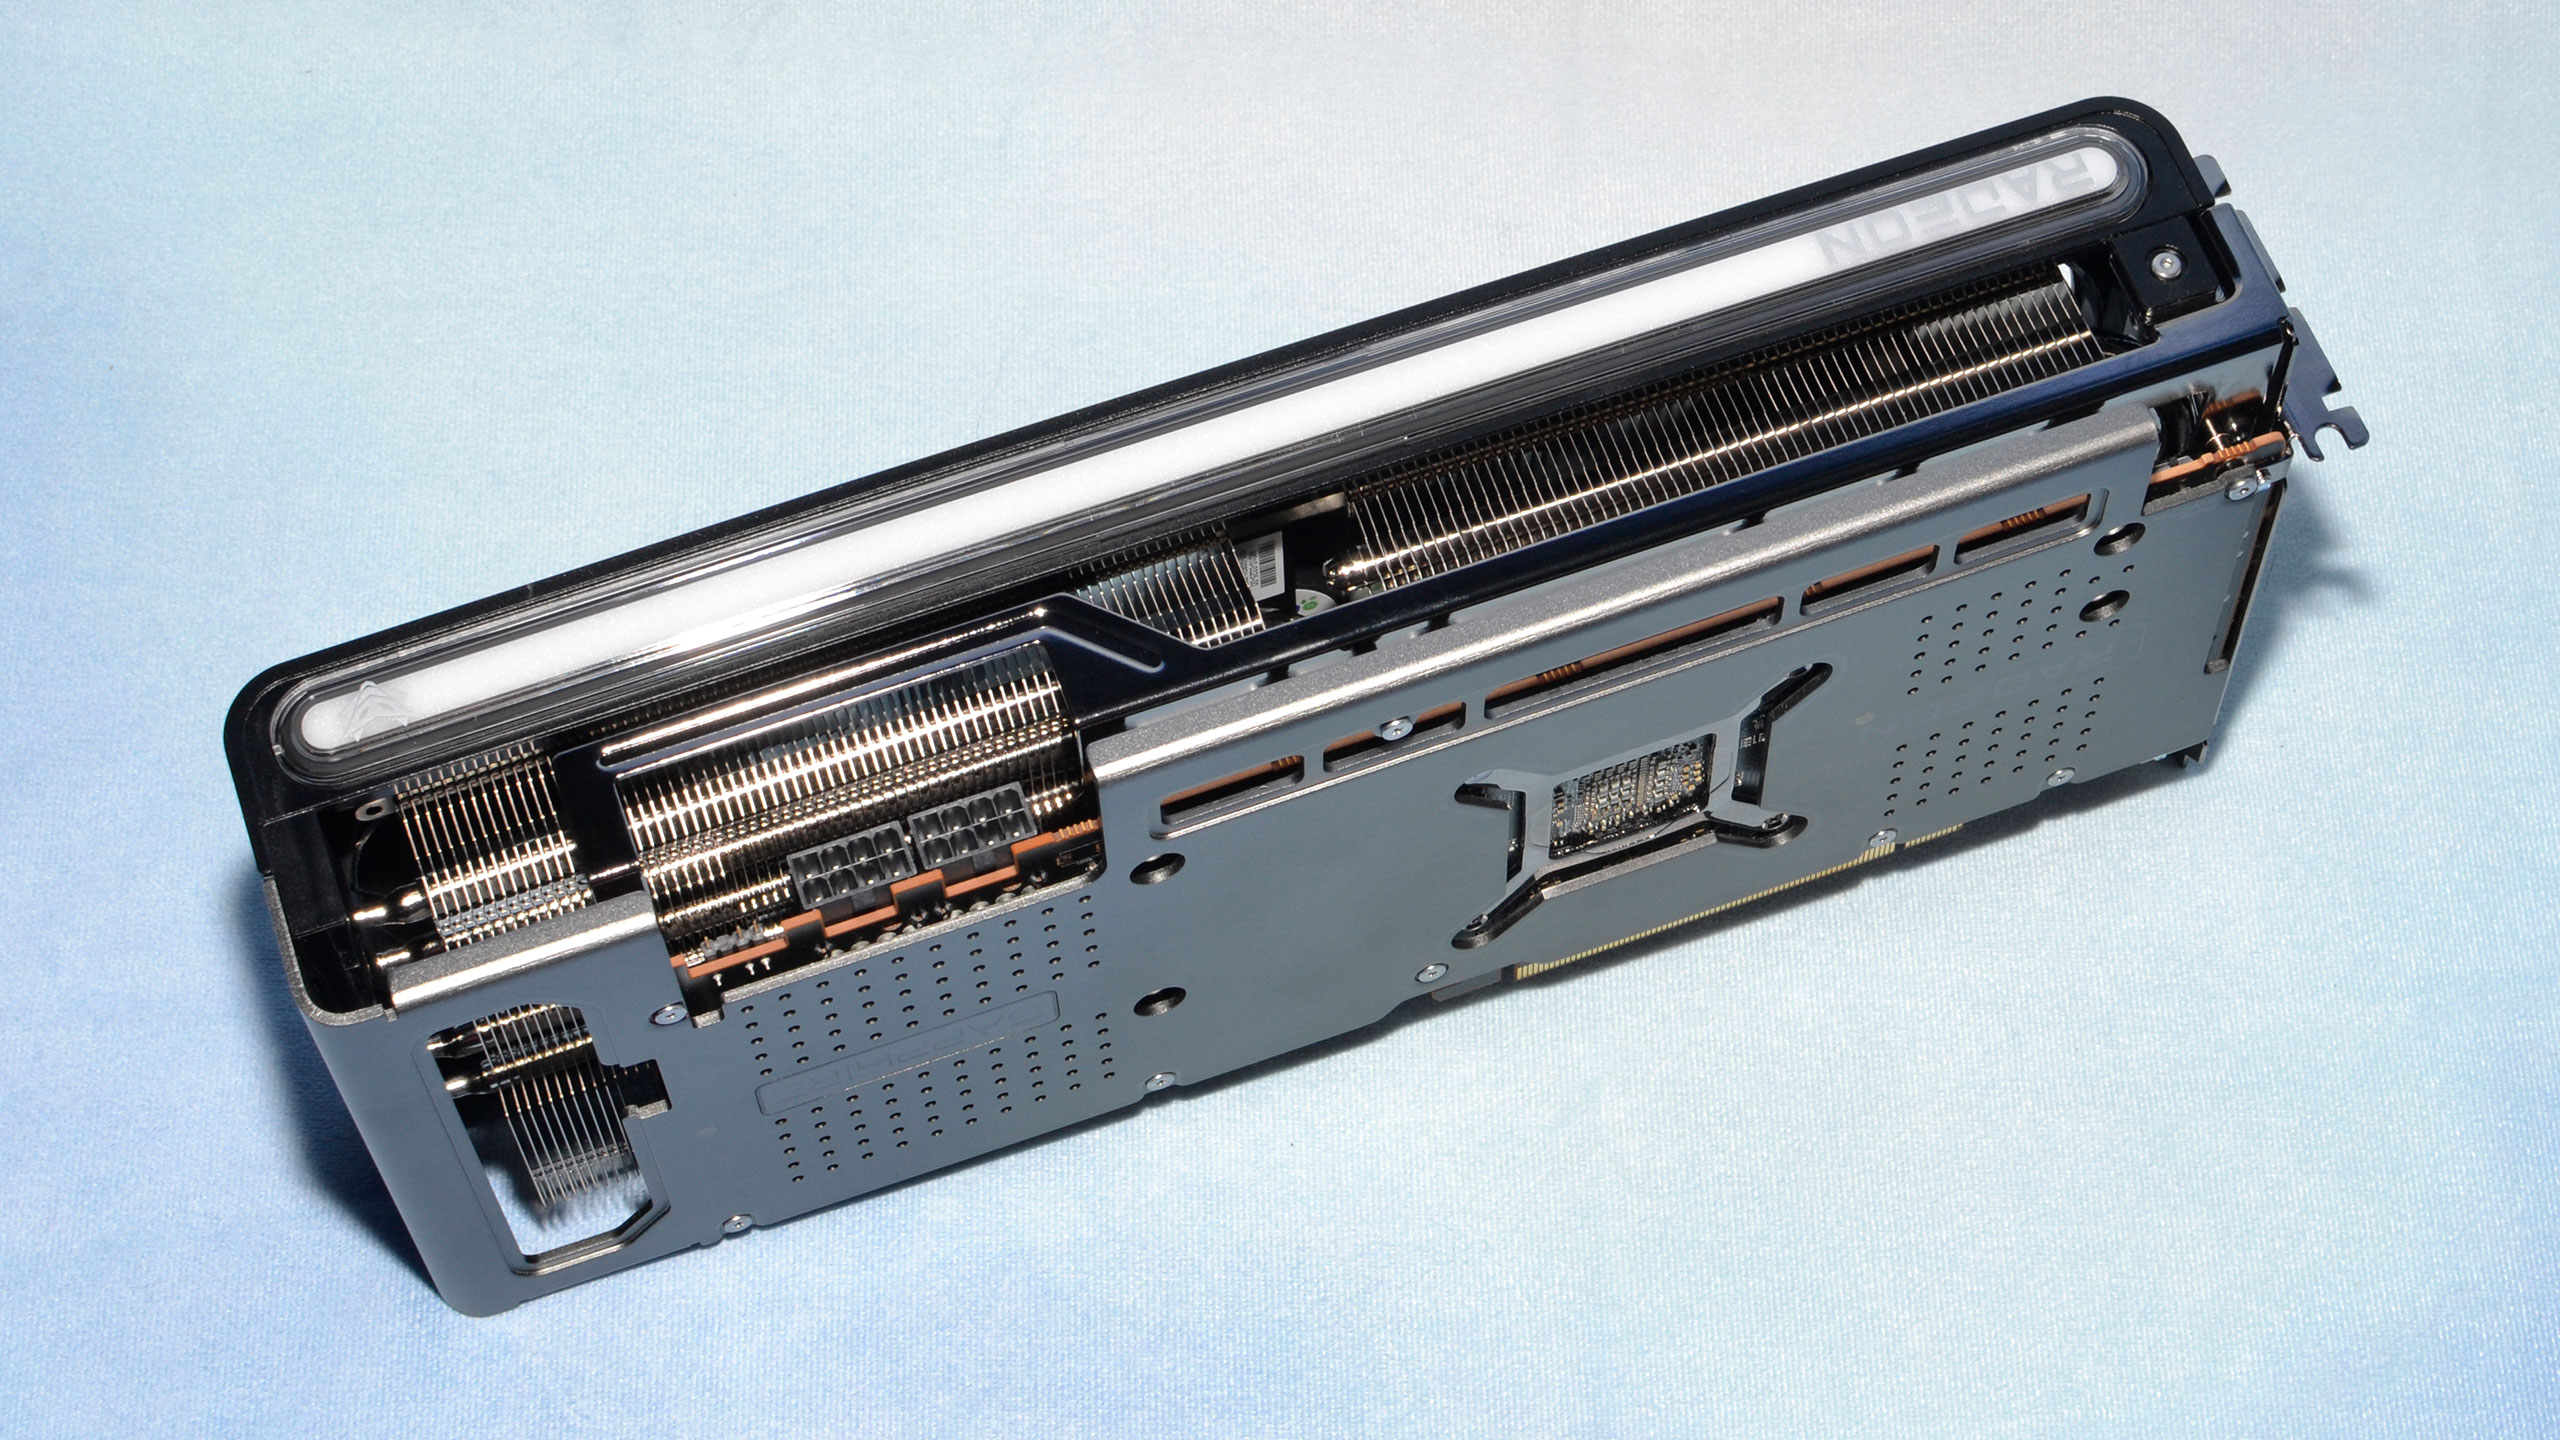
GPU temperatures and fan speeds go hand in hand, and most modern GPUs are perfectly fine at up to 90C, give or take. We don't have a good way of collecting fan speed data from our test suite, sadly, but we'll let noise levels stand in for that below. The Sapphire 7900 GRE Nitro+ is physically larger than the Pulse, mostly by being half a slot width thicker. That should result in lower temperatures, and that's precisely what we see.
We test in a 21C ambient, +/-2C, and the triple 95mm "Angular Velocity" fans combined with a large heatsink do a good job at keeping the 7900 GRE cool. Average temperatures across our test settings range from 62.5–64.1 degrees Celsius, but averages here aren't as meaningful — what we really want to know are the "worst-case" thermals.
As above, lighter games — including games that hit CPU bottlenecks — don't tend to heat up the GPU as much. Other factors also come into play, however, so that the "coldest" games aren't just the ones with the lowest core clocks. Far Cry 6 doesn't heat up the GPU as much due to CPU bottlenecks, but at the same time neither do Control and Cyberpunk 2077.
Peak average temps from across our test suite are around 68C, while in less demanding games the Nitro+ might land in the low 50s. Across our entire suite, the Nitro+ runs about 4C cooler than the Pulse on average. Curiously, the ASRock card runs cooler yet, beating the Nitro+ by 3C~4C depending on the settings used. But we need to check noise levels as well to see how that might factor into the equation.
Sapphire RX 7900 GRE Nitro+ Noise Levels
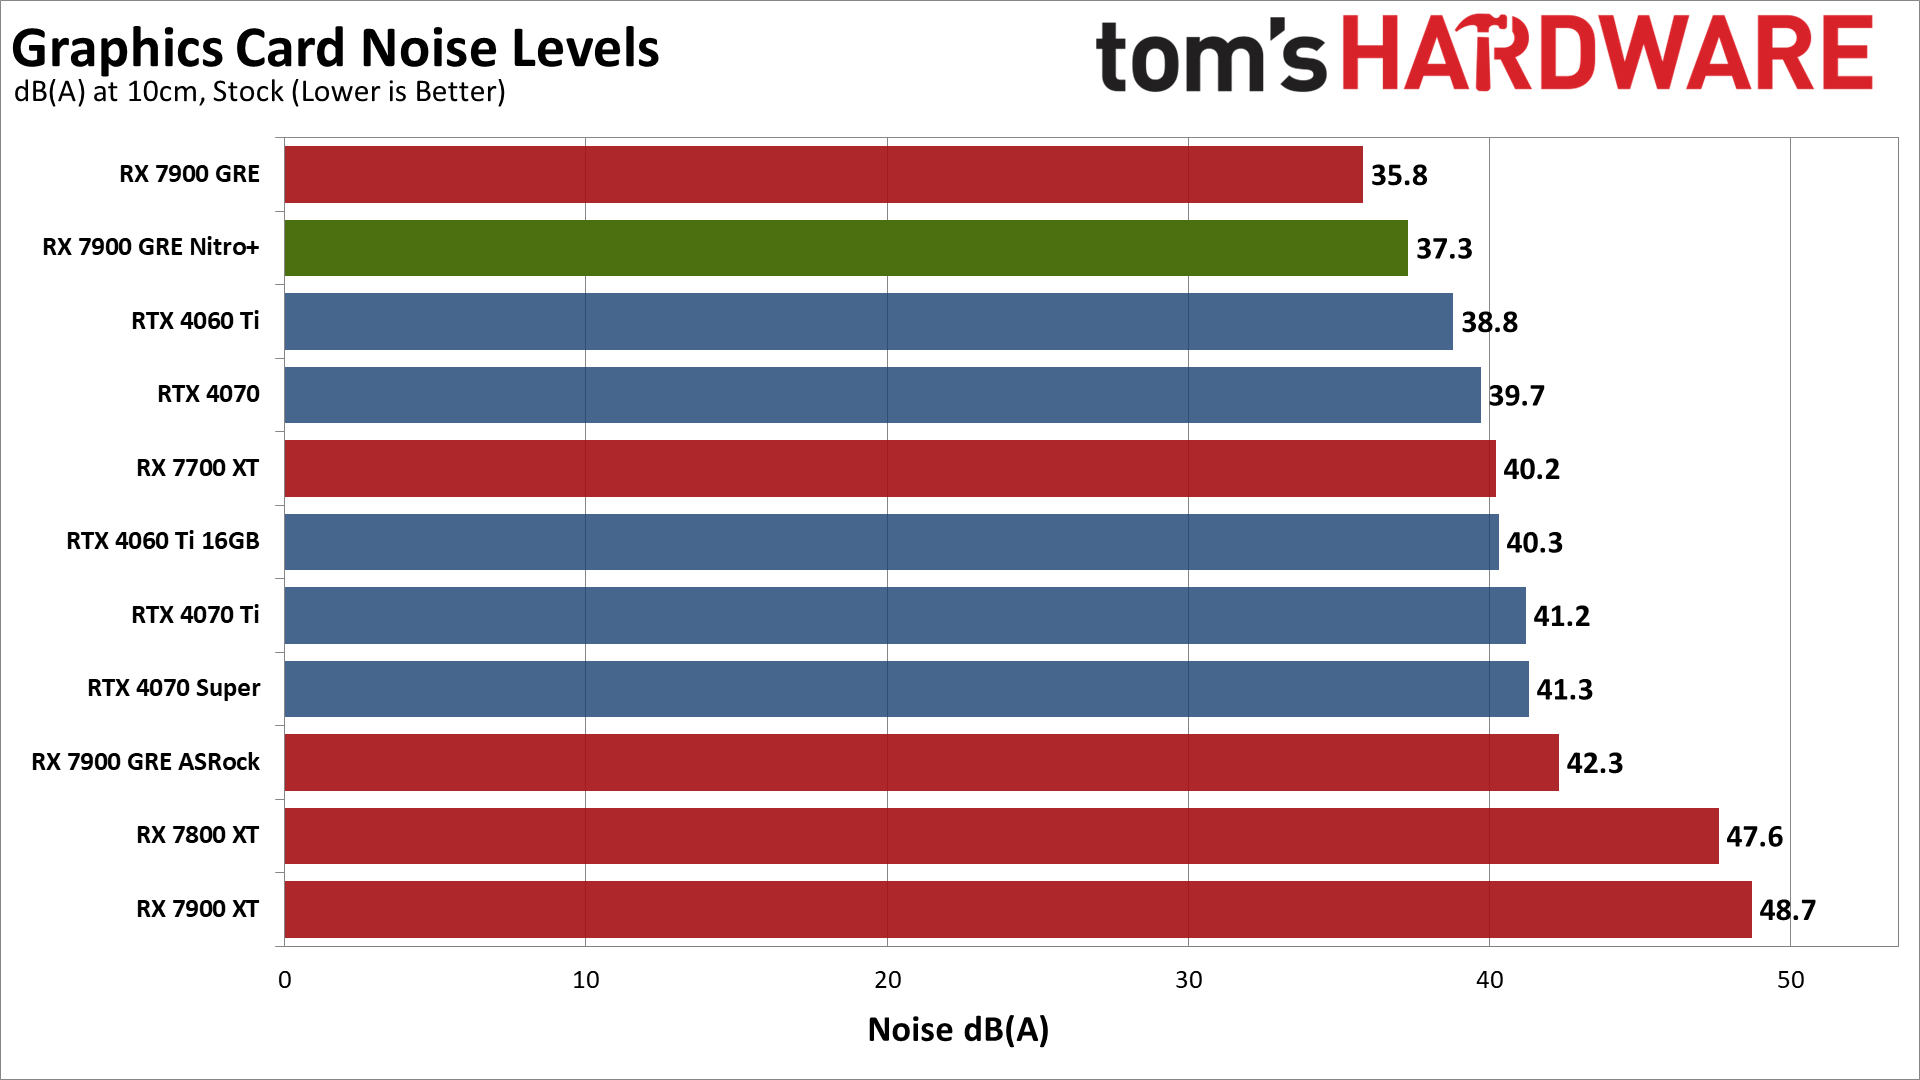
The Sapphire RX 7900 GRE Nitro+ runs very cool and quiet, and yet, it's not quite as quiet as the 7900 GRE Pulse card. It's 1.5 dB(A) noisier than the Pulse in our gaming test. At the same time, it's also 5 dB(A) quieter than the ASRock card, which explains why the temperatures were lower on the Steel Legend — faster fan speeds move more air and thus cool better, but they make more noise.
It looks like Sapphire may have tuned fan speeds to be a bit more aggressive (meaning, faster) due to the higher power draw of the Nitro+. That helps it run cooler but creates slightly more noise than the 'lesser' Pulse card.
Note that we measure noise levels at 10cm from the middle GPU fan, to better pick up any differences between the various cards. The noise floor of our test environment and equipment is around 31~32 dB(A). A result of 37.3 dB(A) while running a game is still very quiet and most people wouldn't notice it above the sound of the rest of the PC's fans. That corresponds to a 26% fan speed, so there's plenty of headroom remaining.
Nvidia's competing GPUs (at least the reference Founders Edition cards) are a bit louder, even though they use less power, though they're also more compact. Smaller cards generally don't have as much surface area to dissipate heat, which means they either run hotter, or need higher fan speeds, or both.
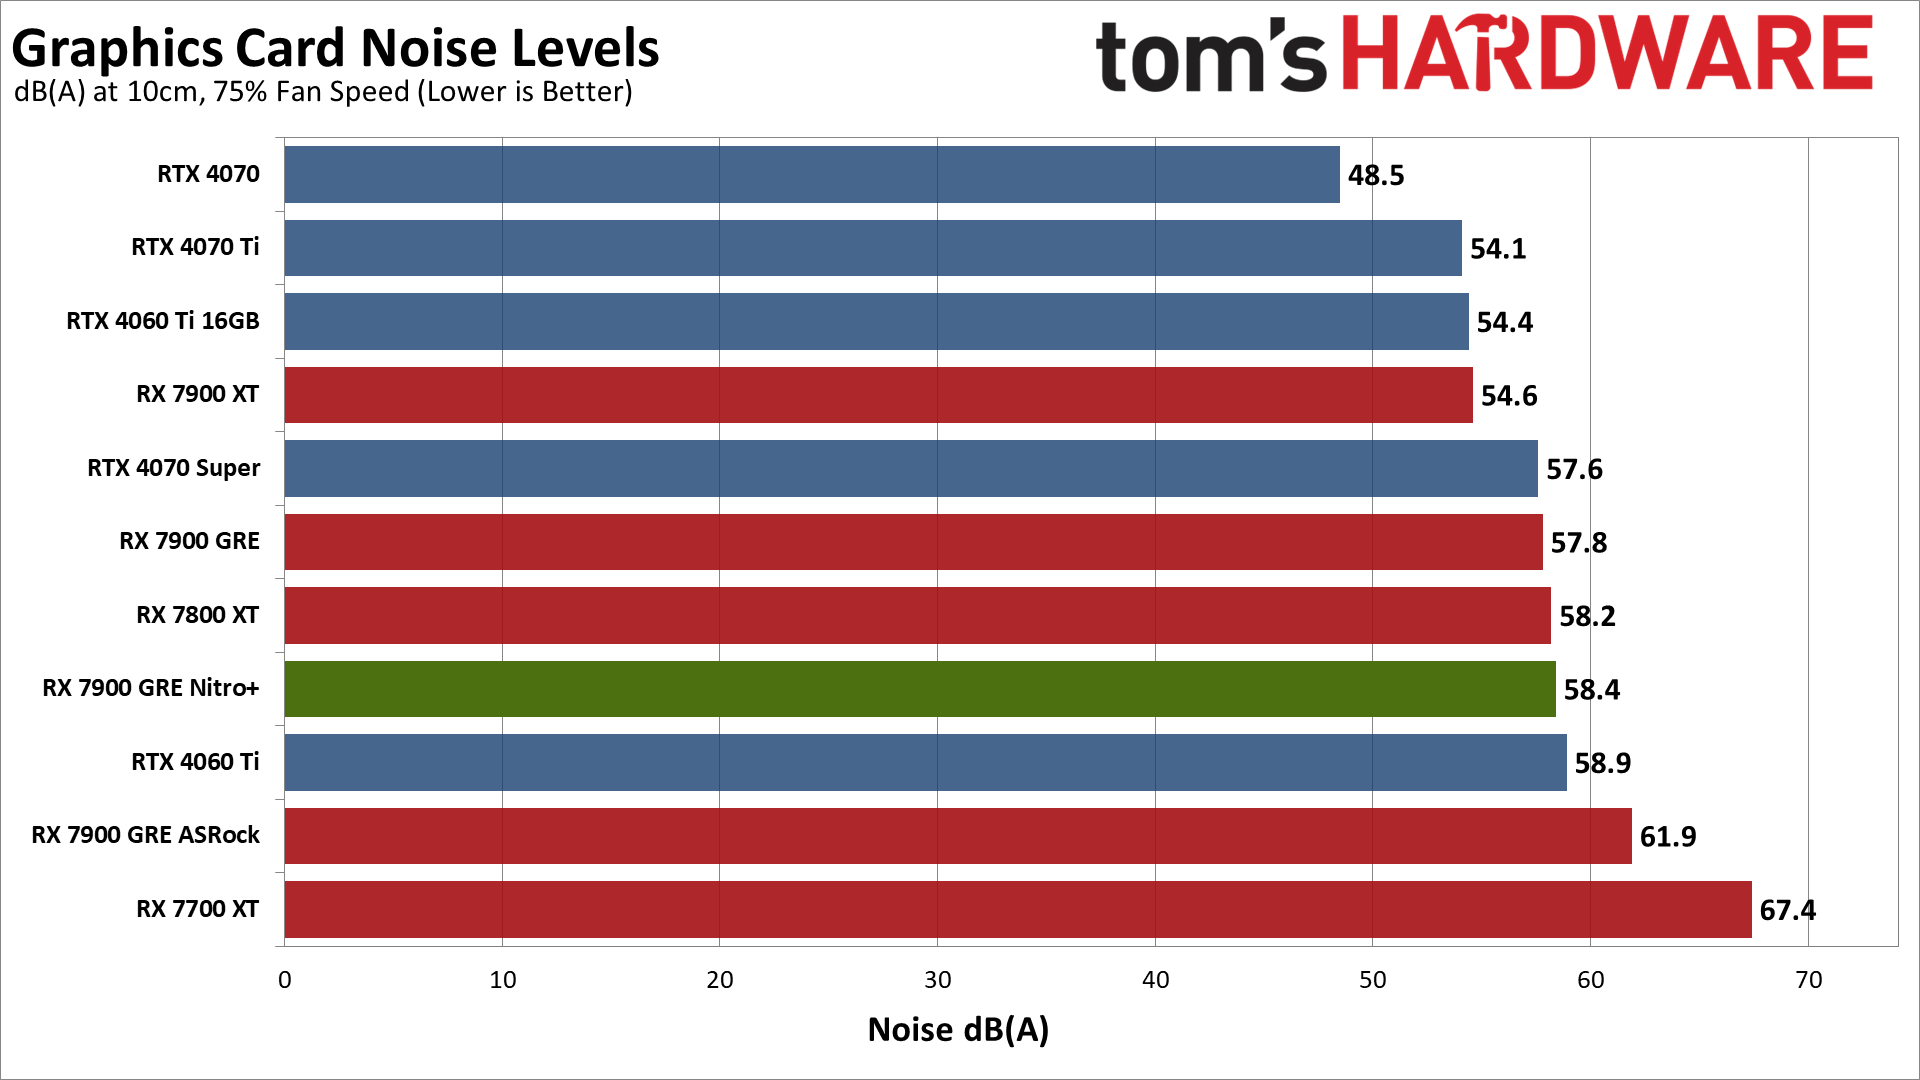
We also test with fan speed set to a static 75%, which is more about seeing how much headroom there is for additional cooling if needed. The Nitro+ generated a lot more noise, hitting 58.4 dB(A), but we don't expect most users will ever see fan speeds anywhere near that high.
Sapphire RX 7900 GRE Nitro+ Efficiency and Value
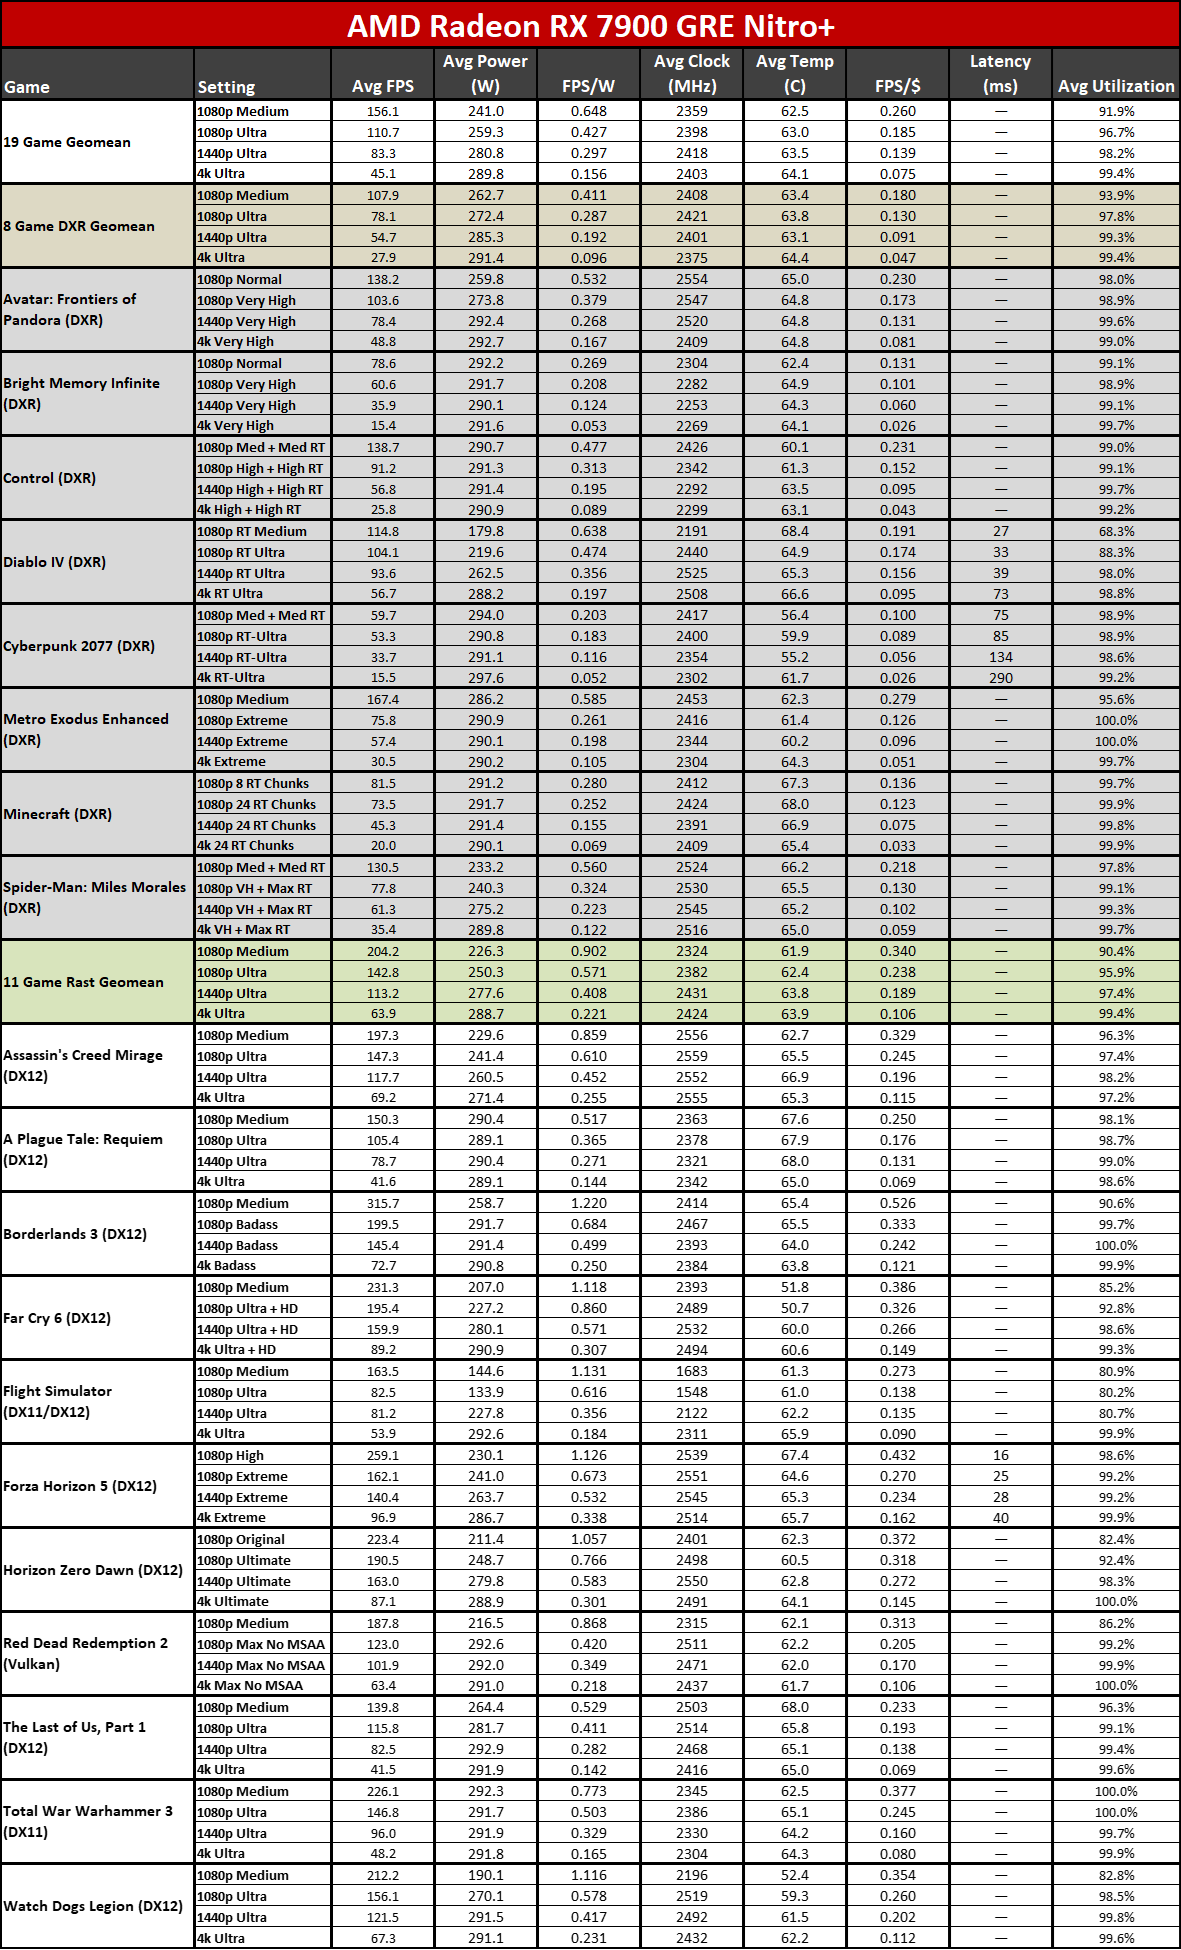
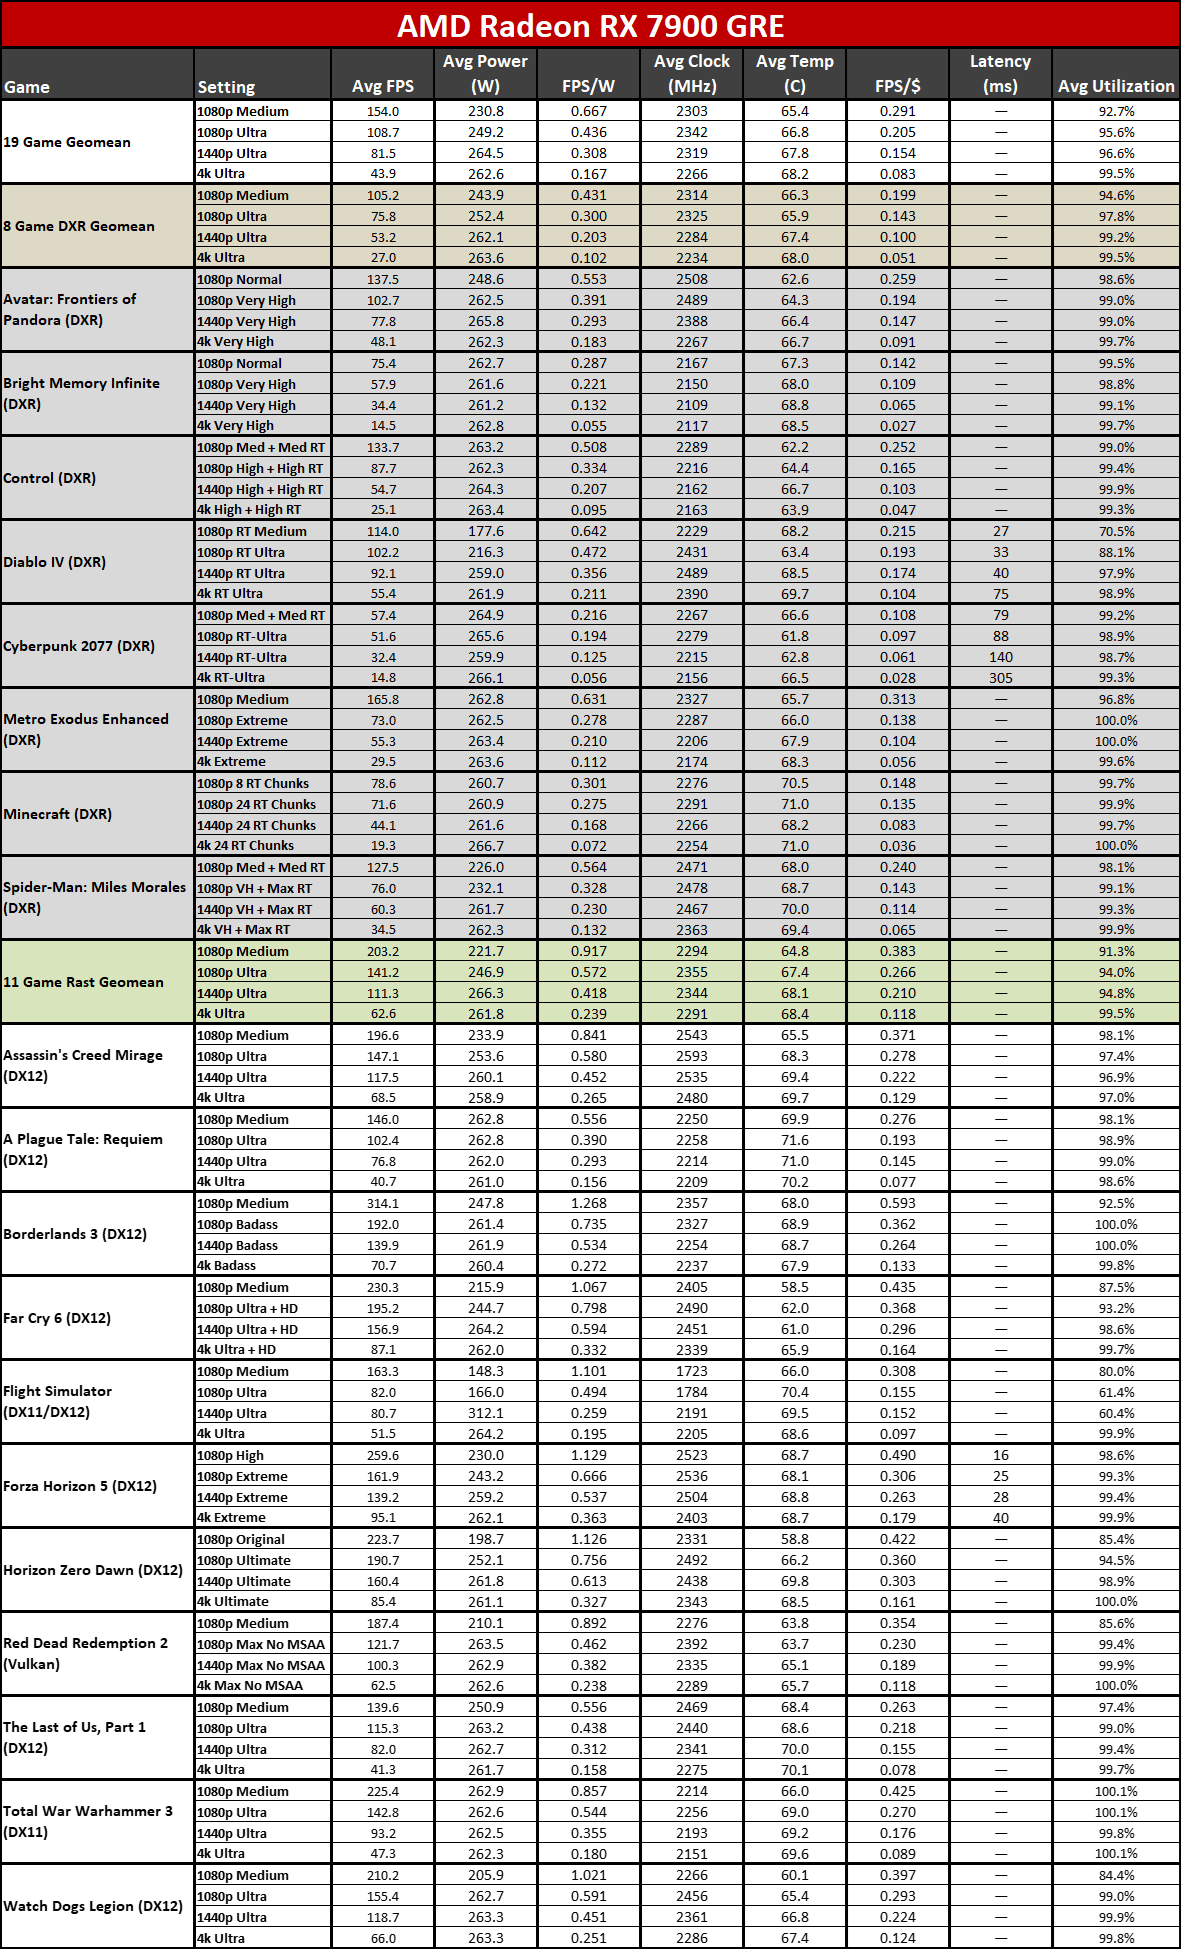
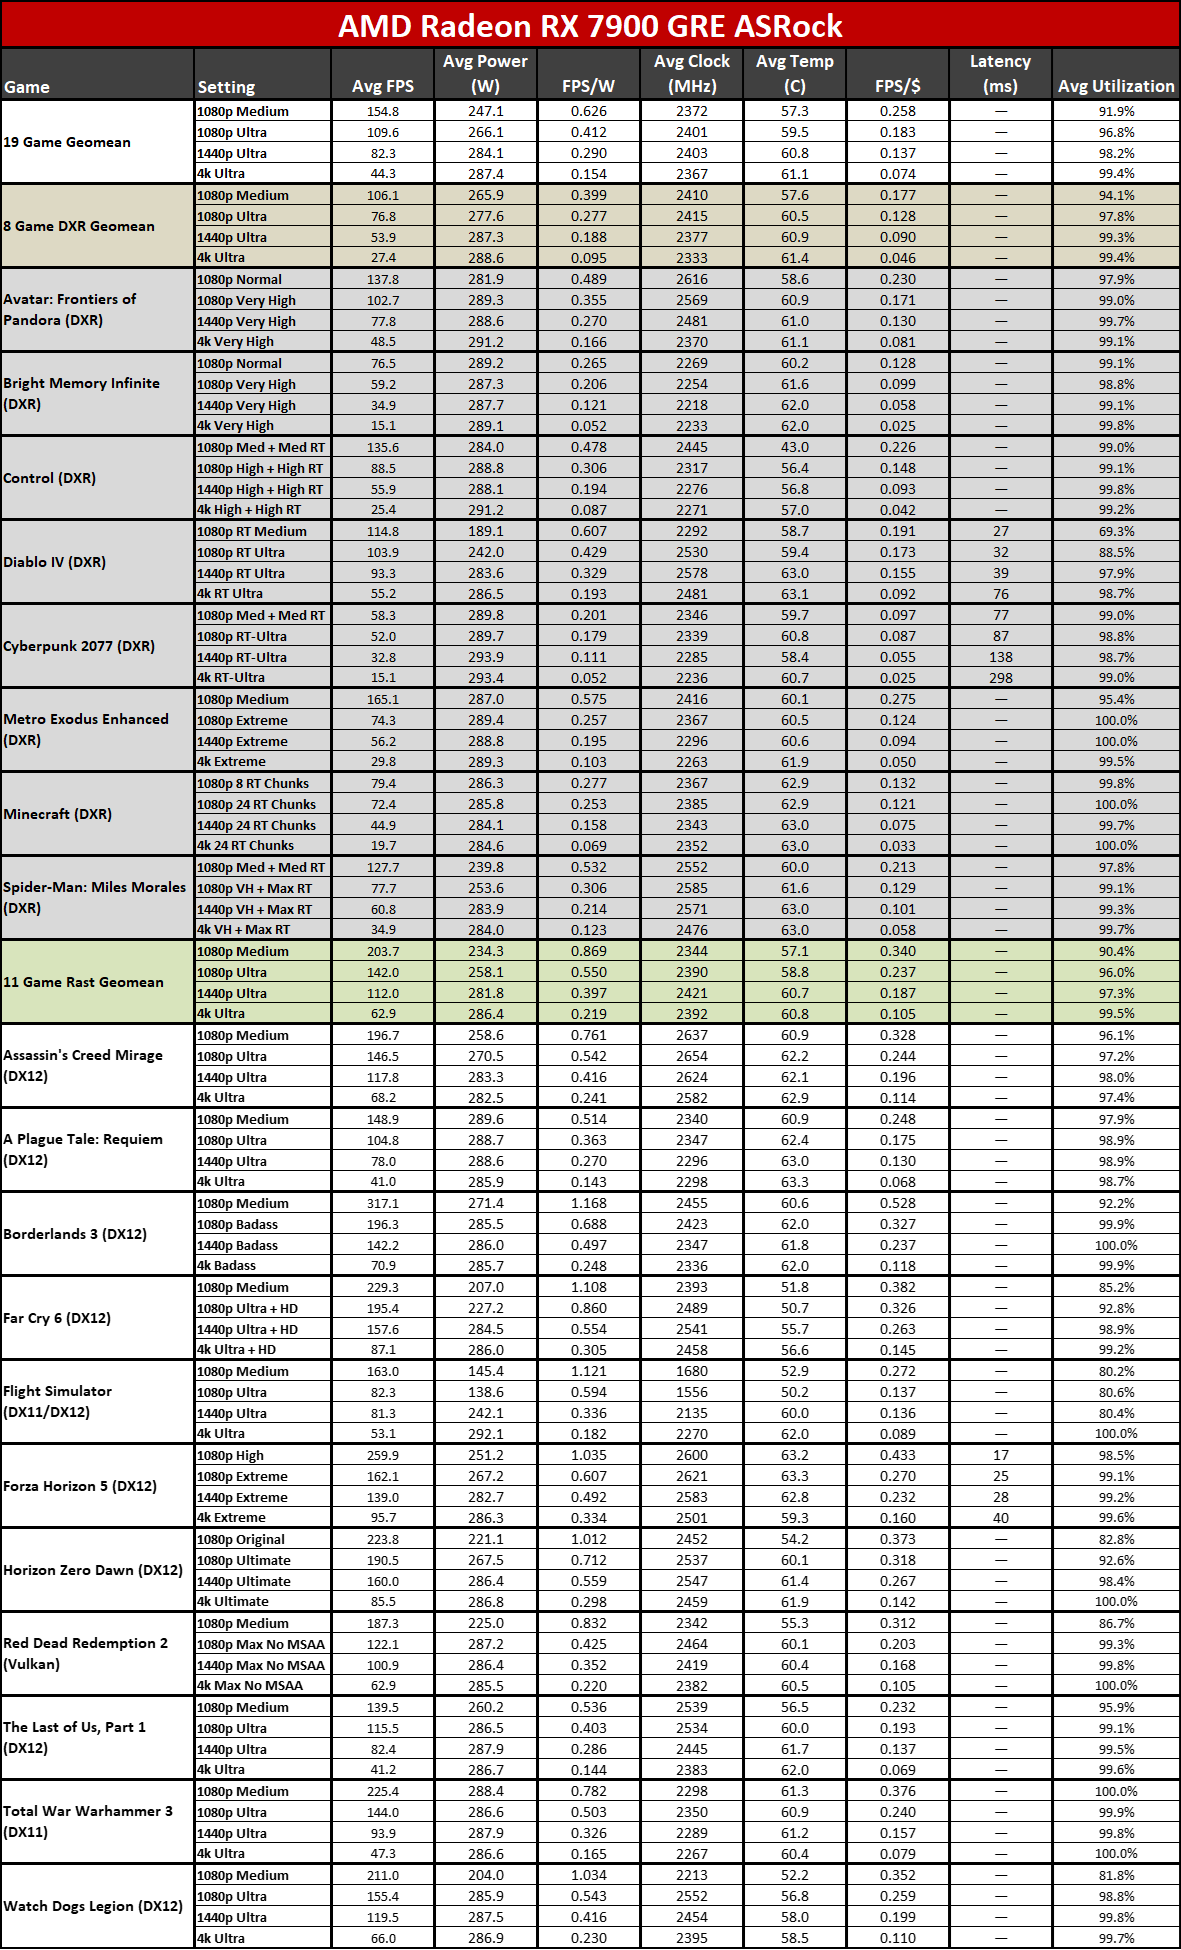
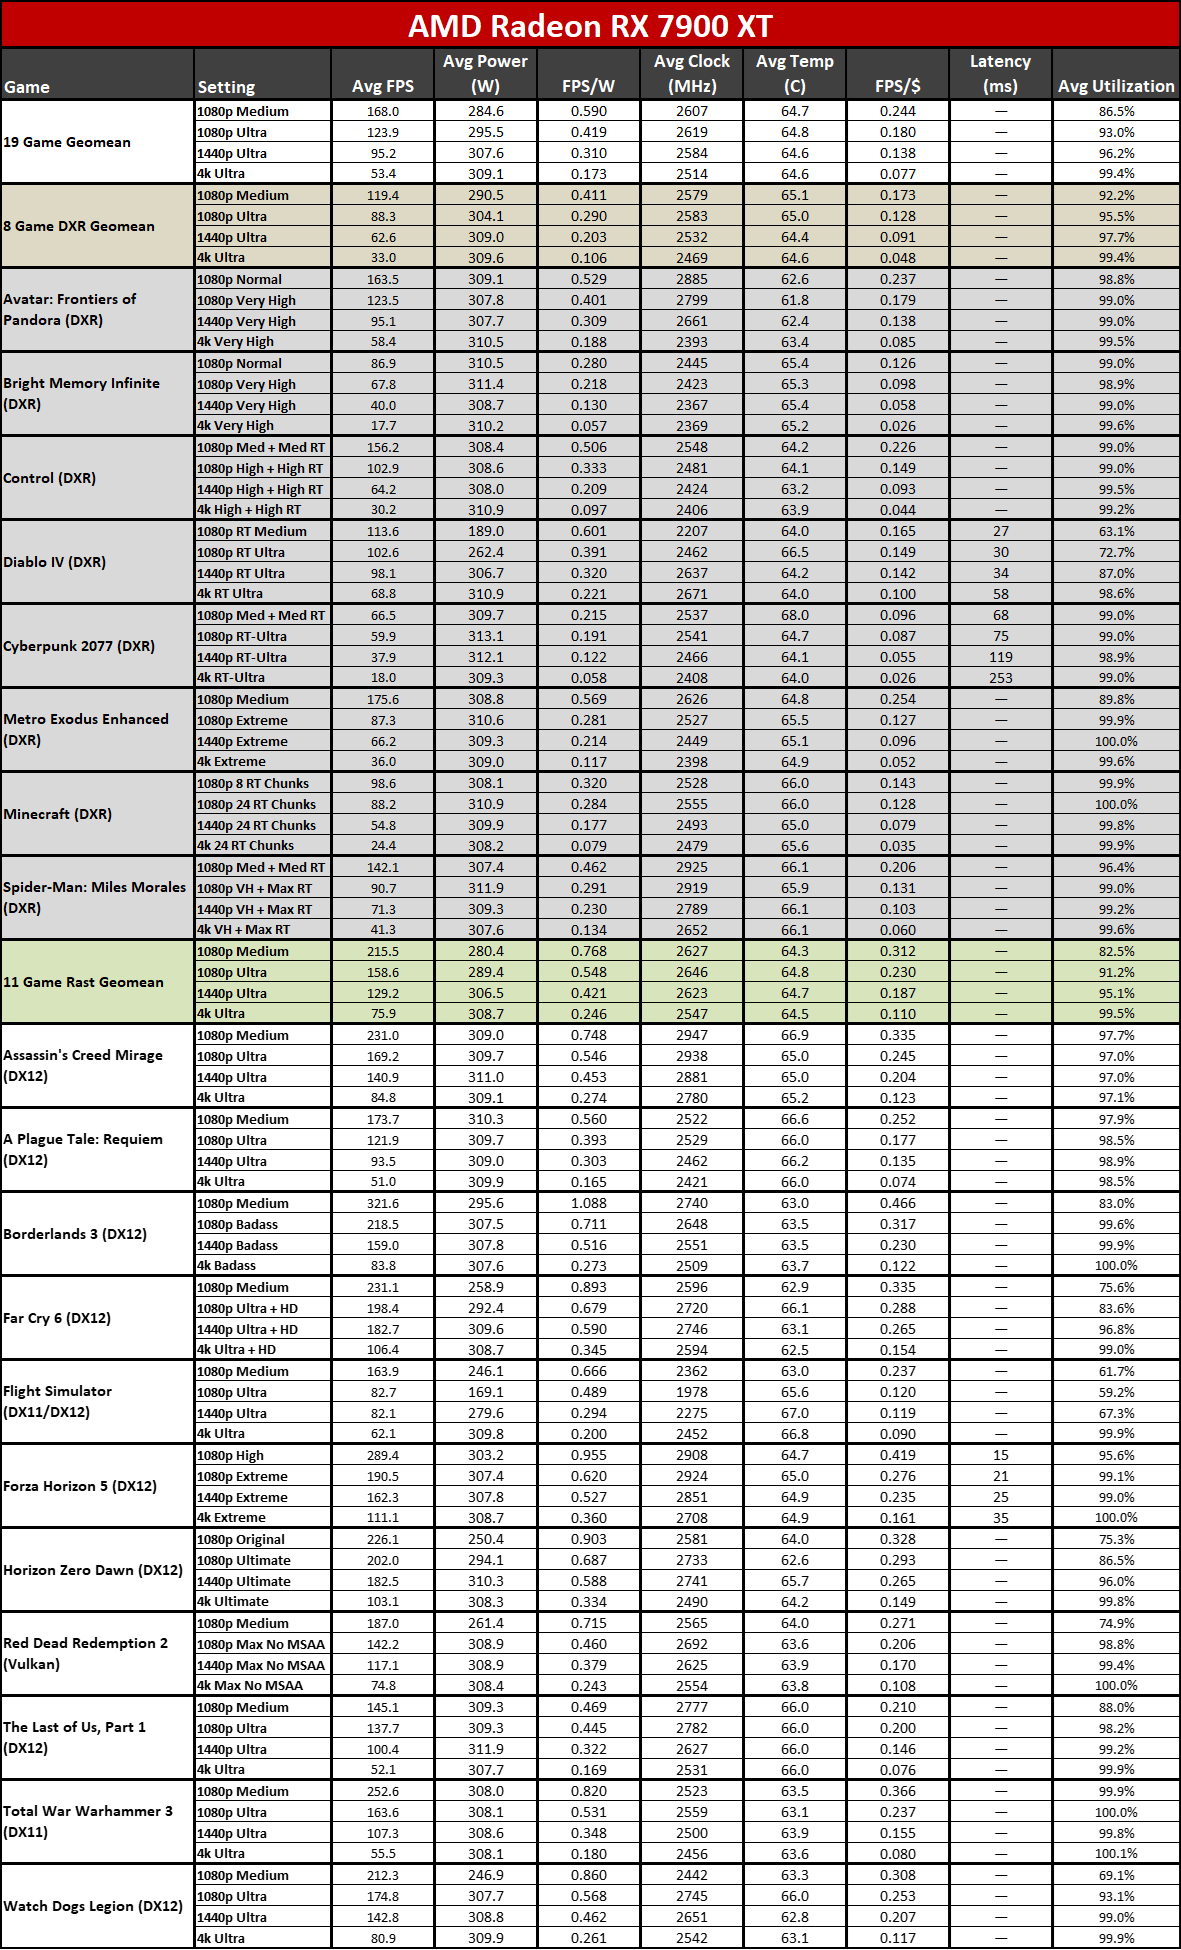
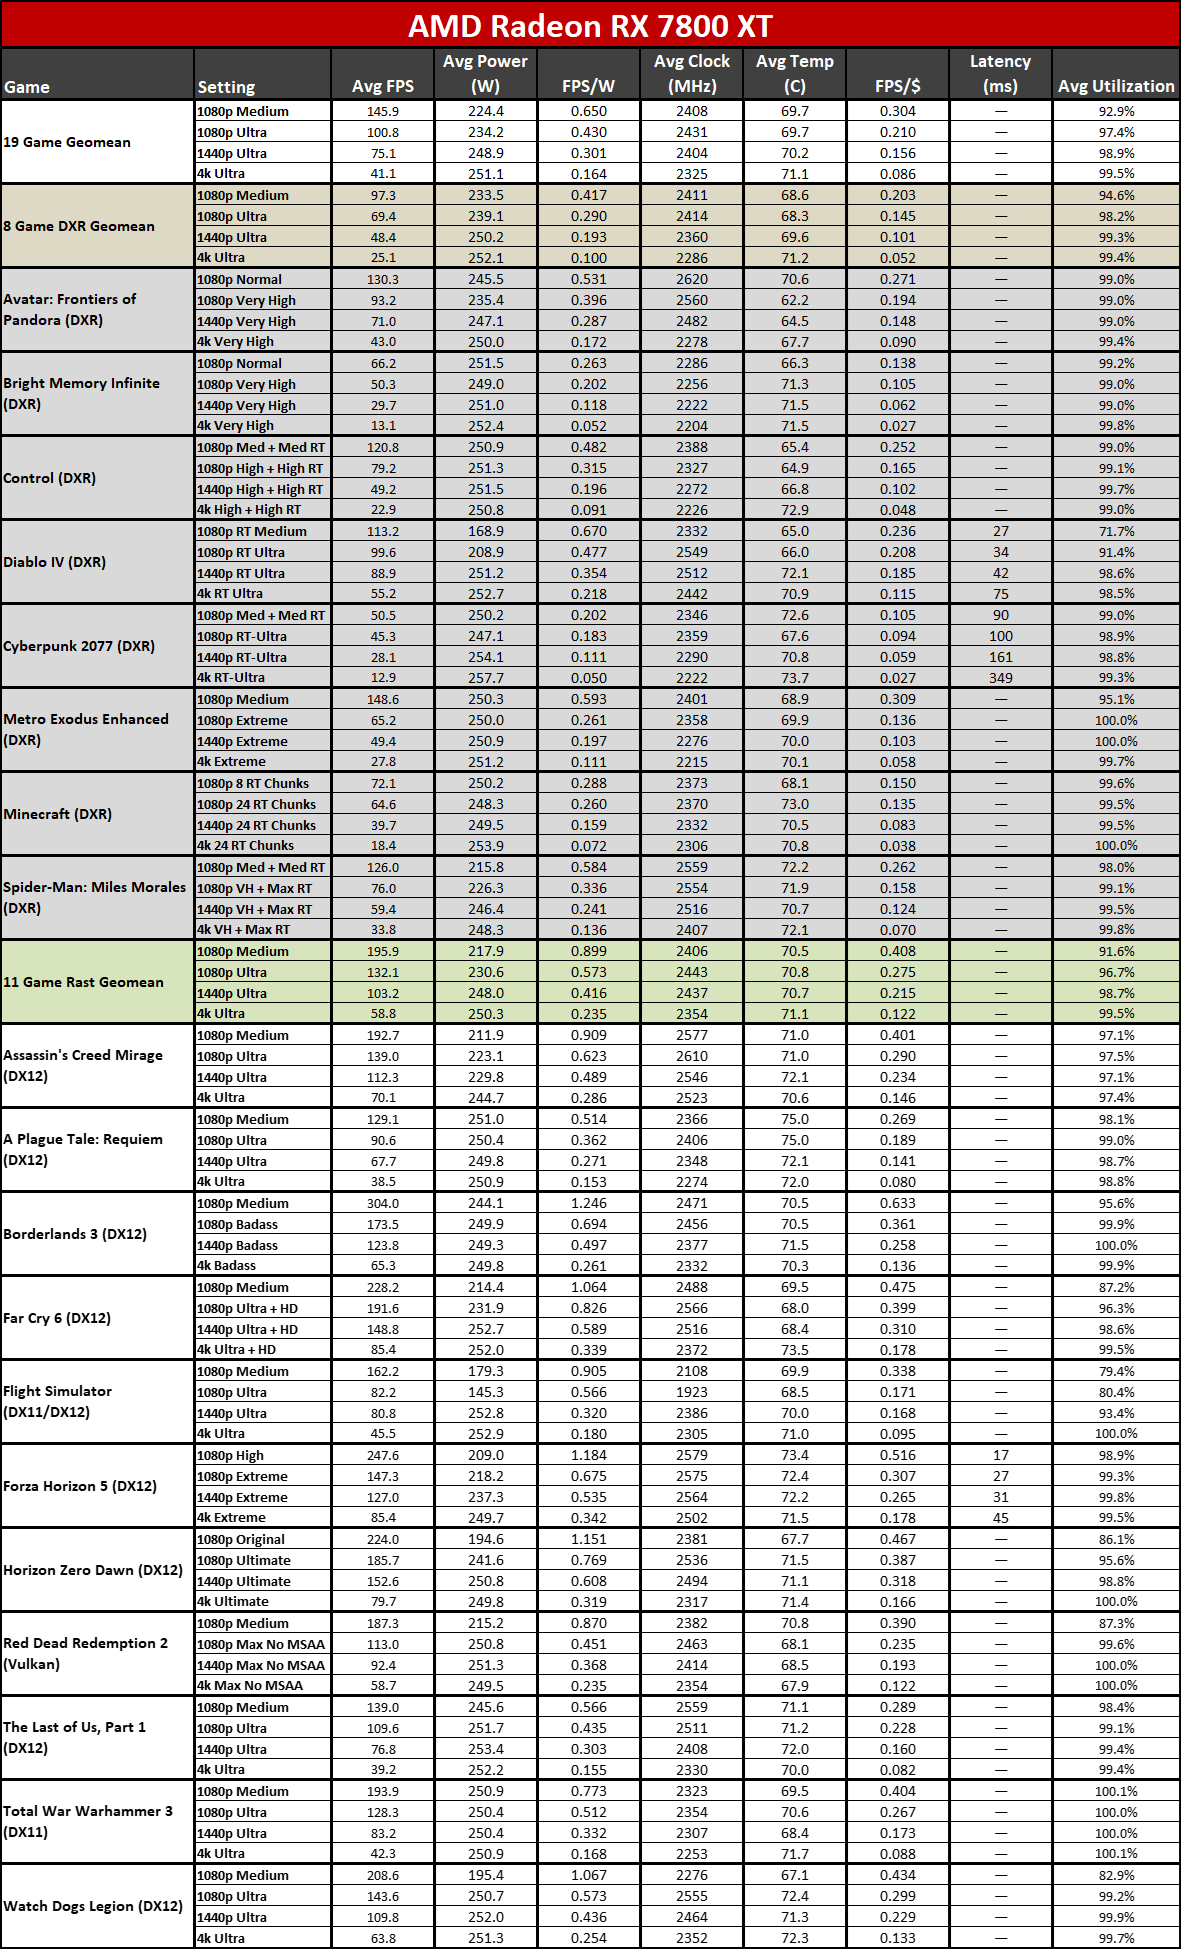
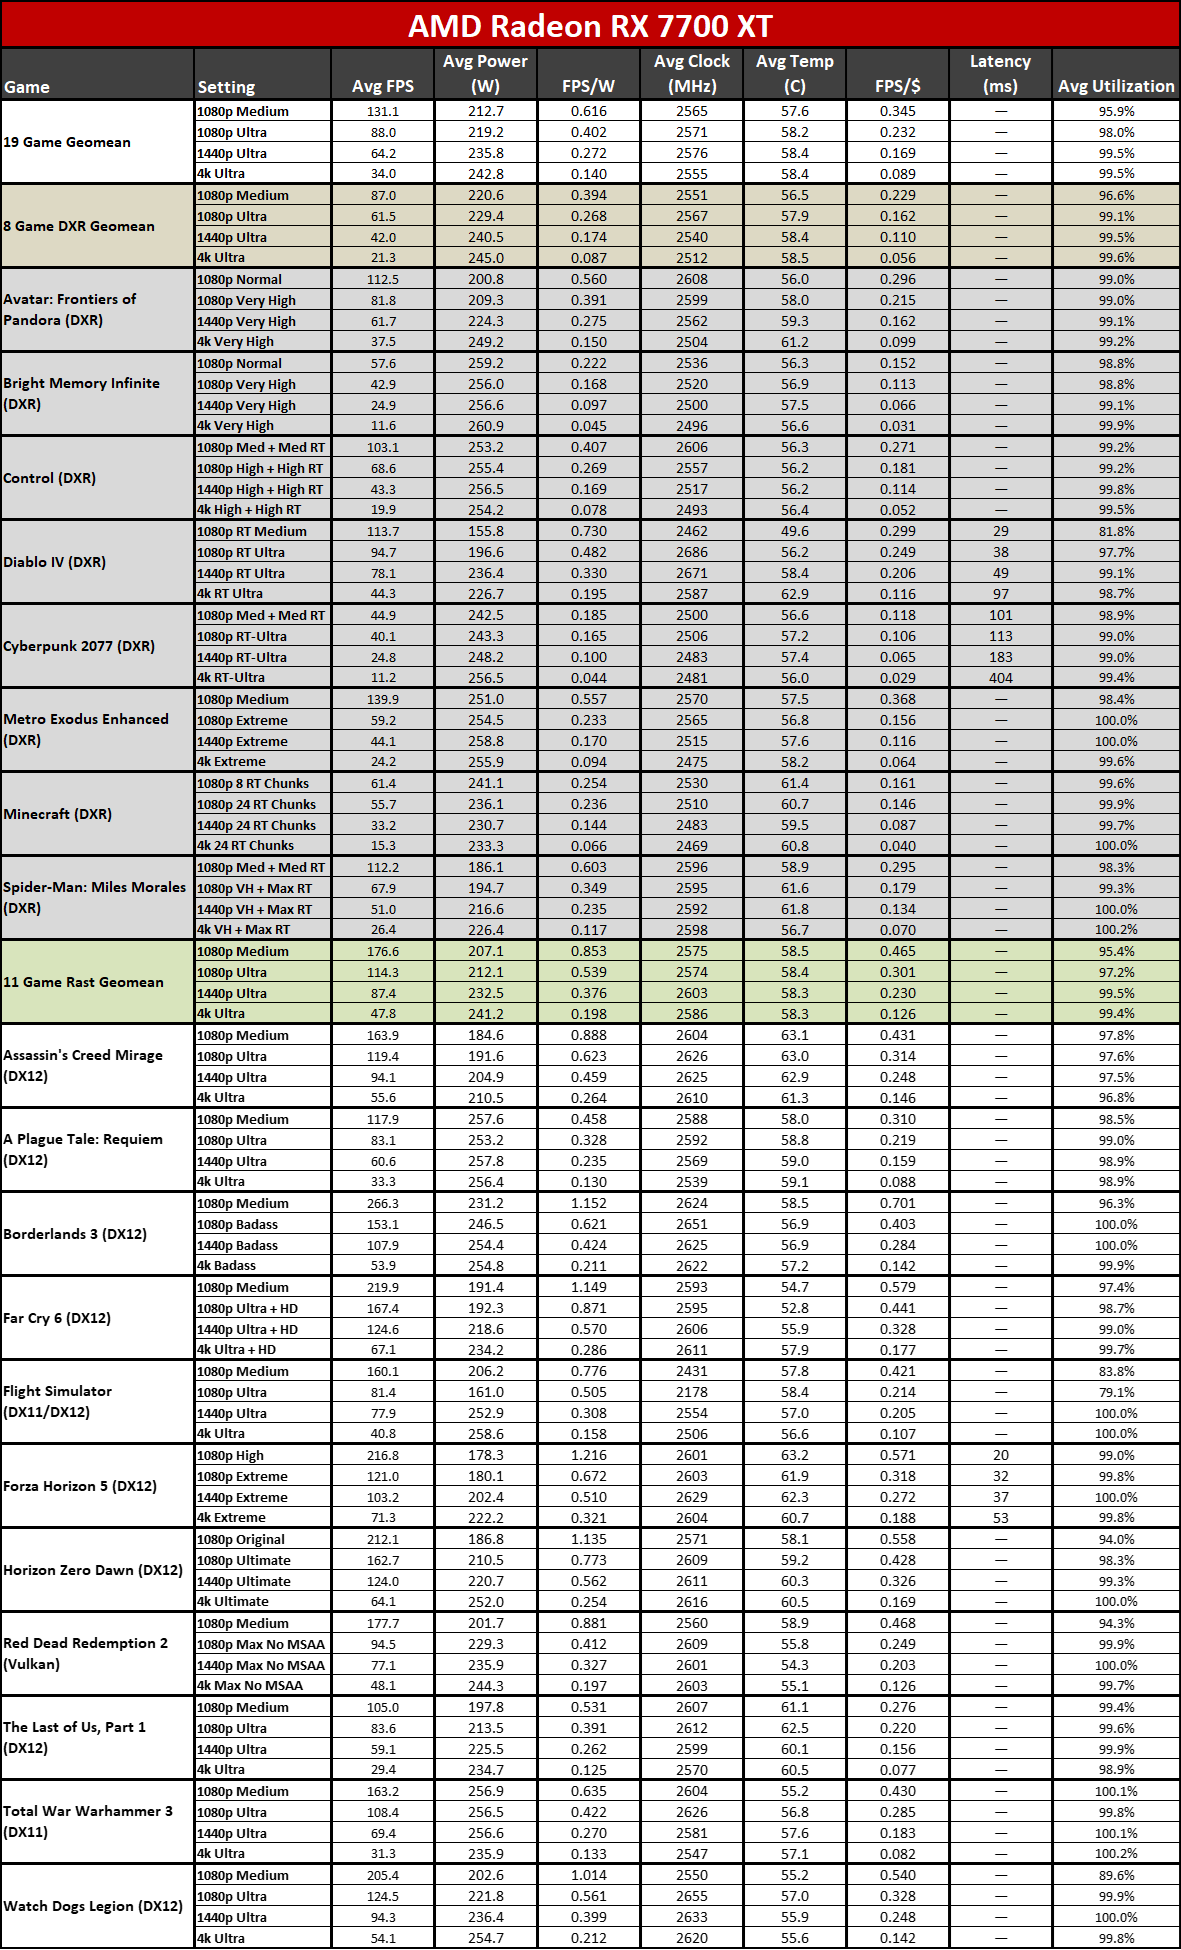
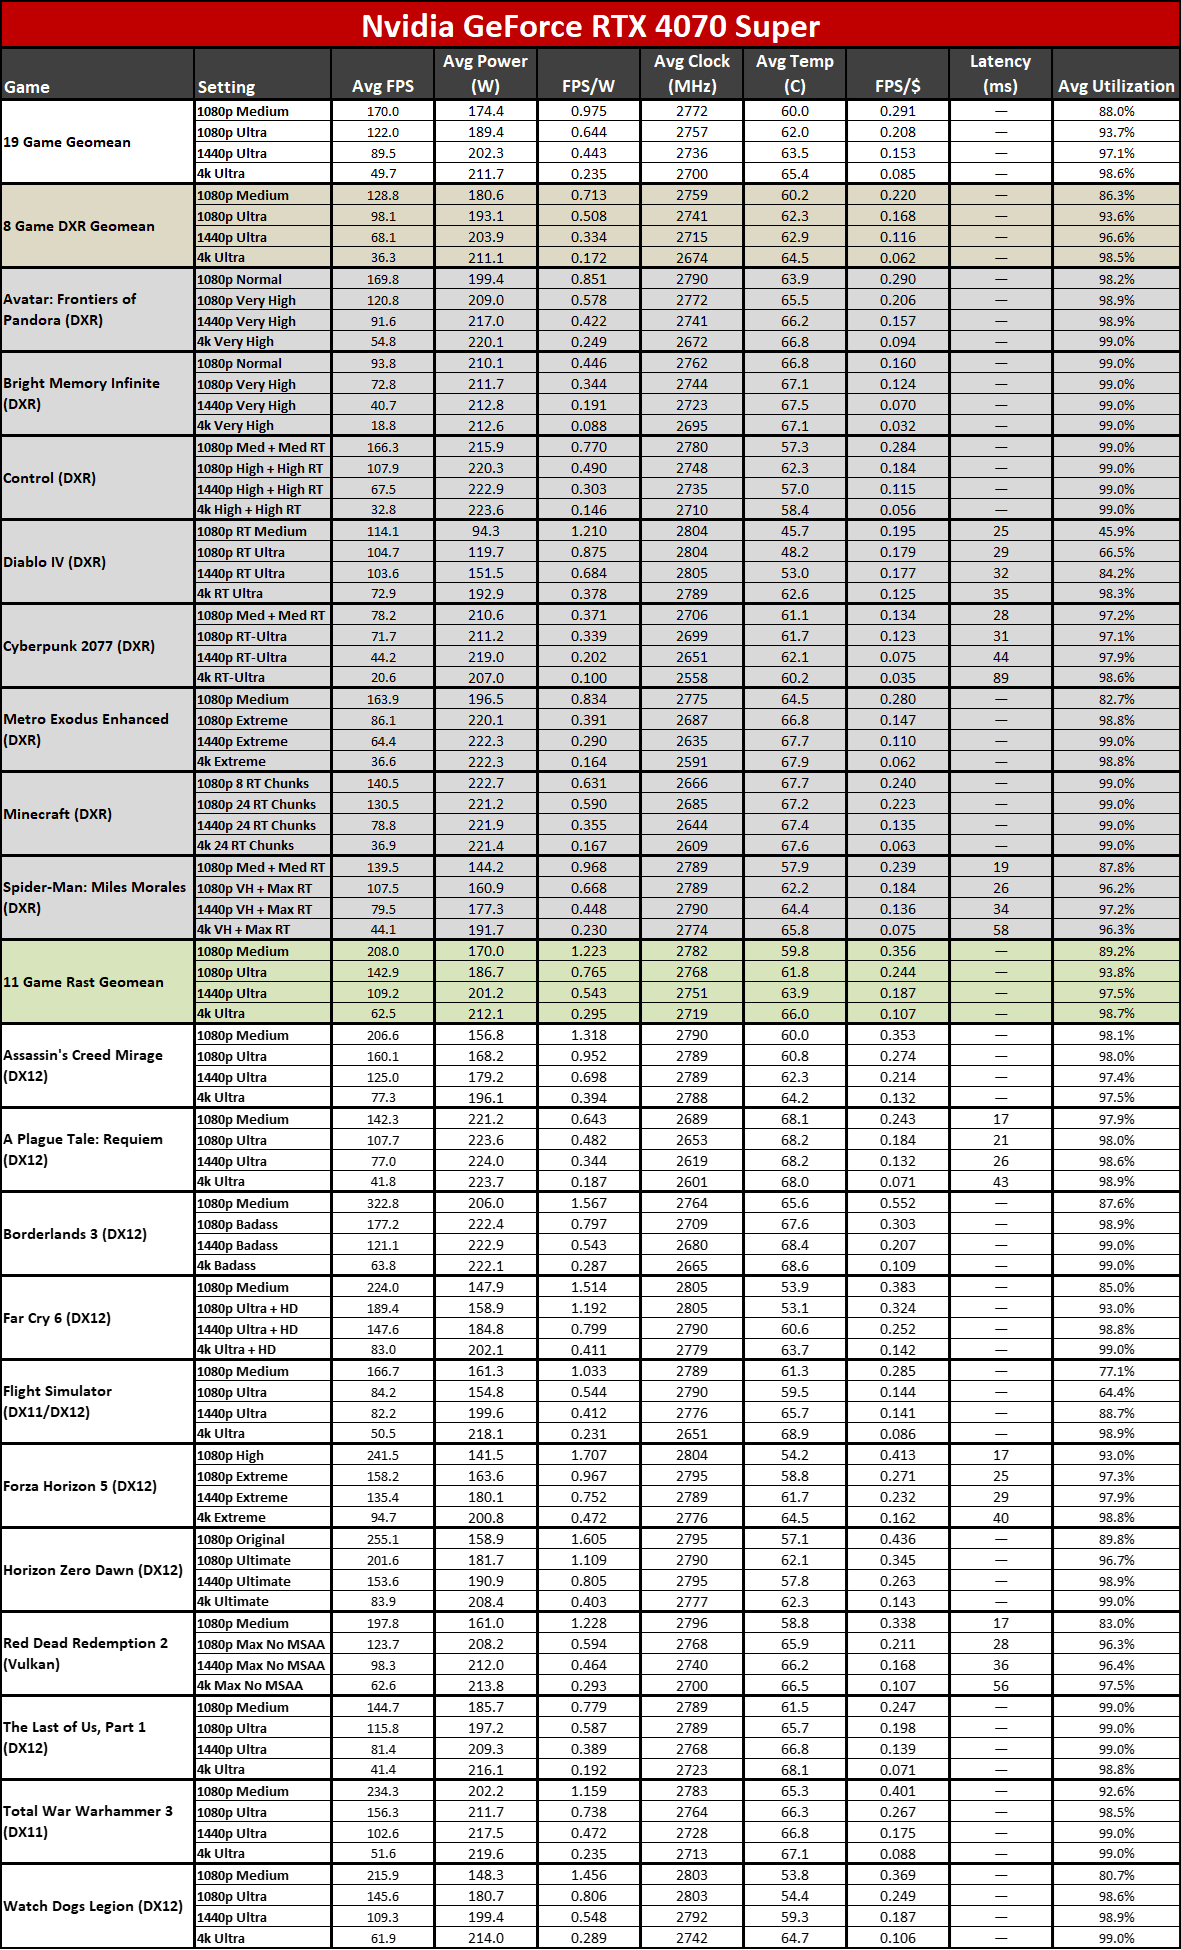
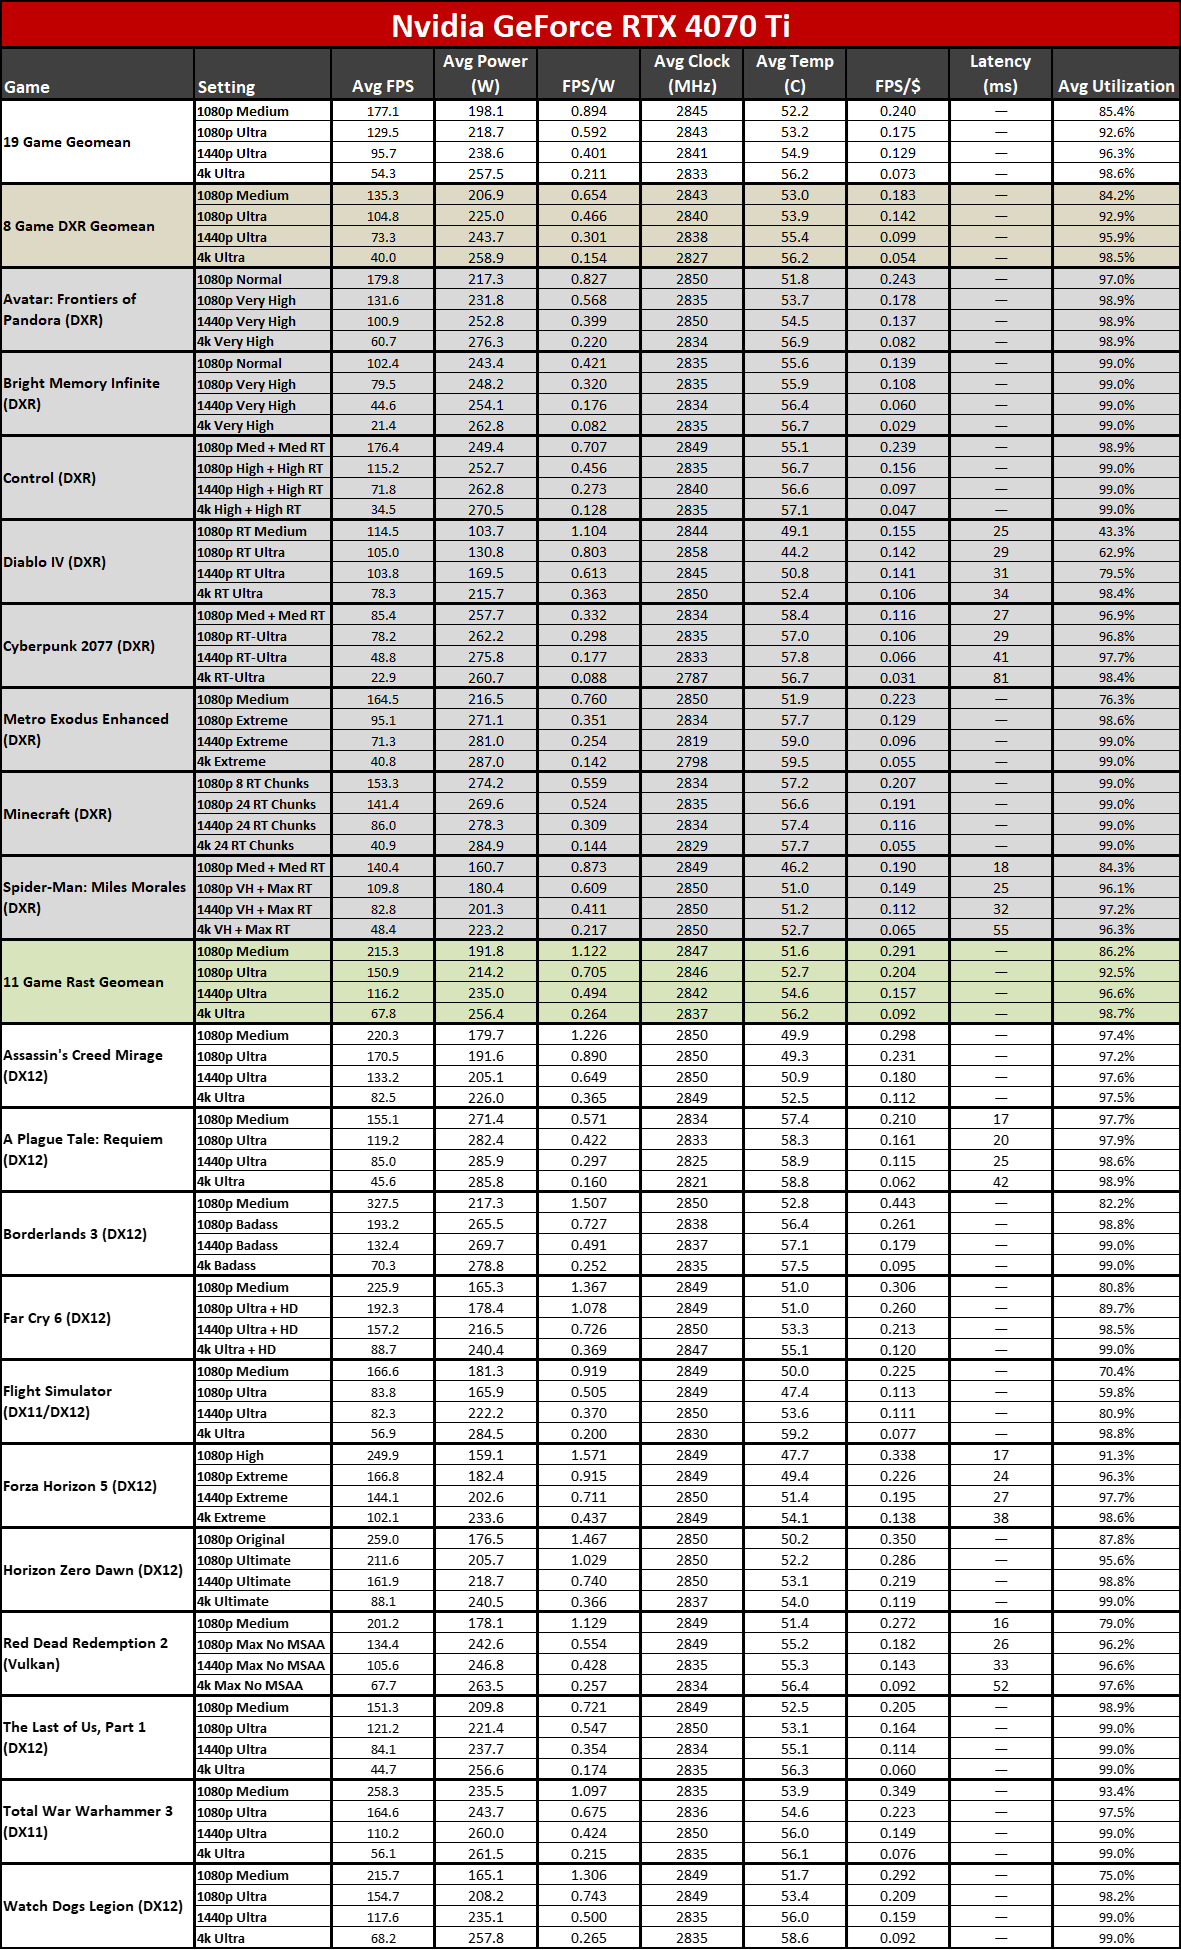
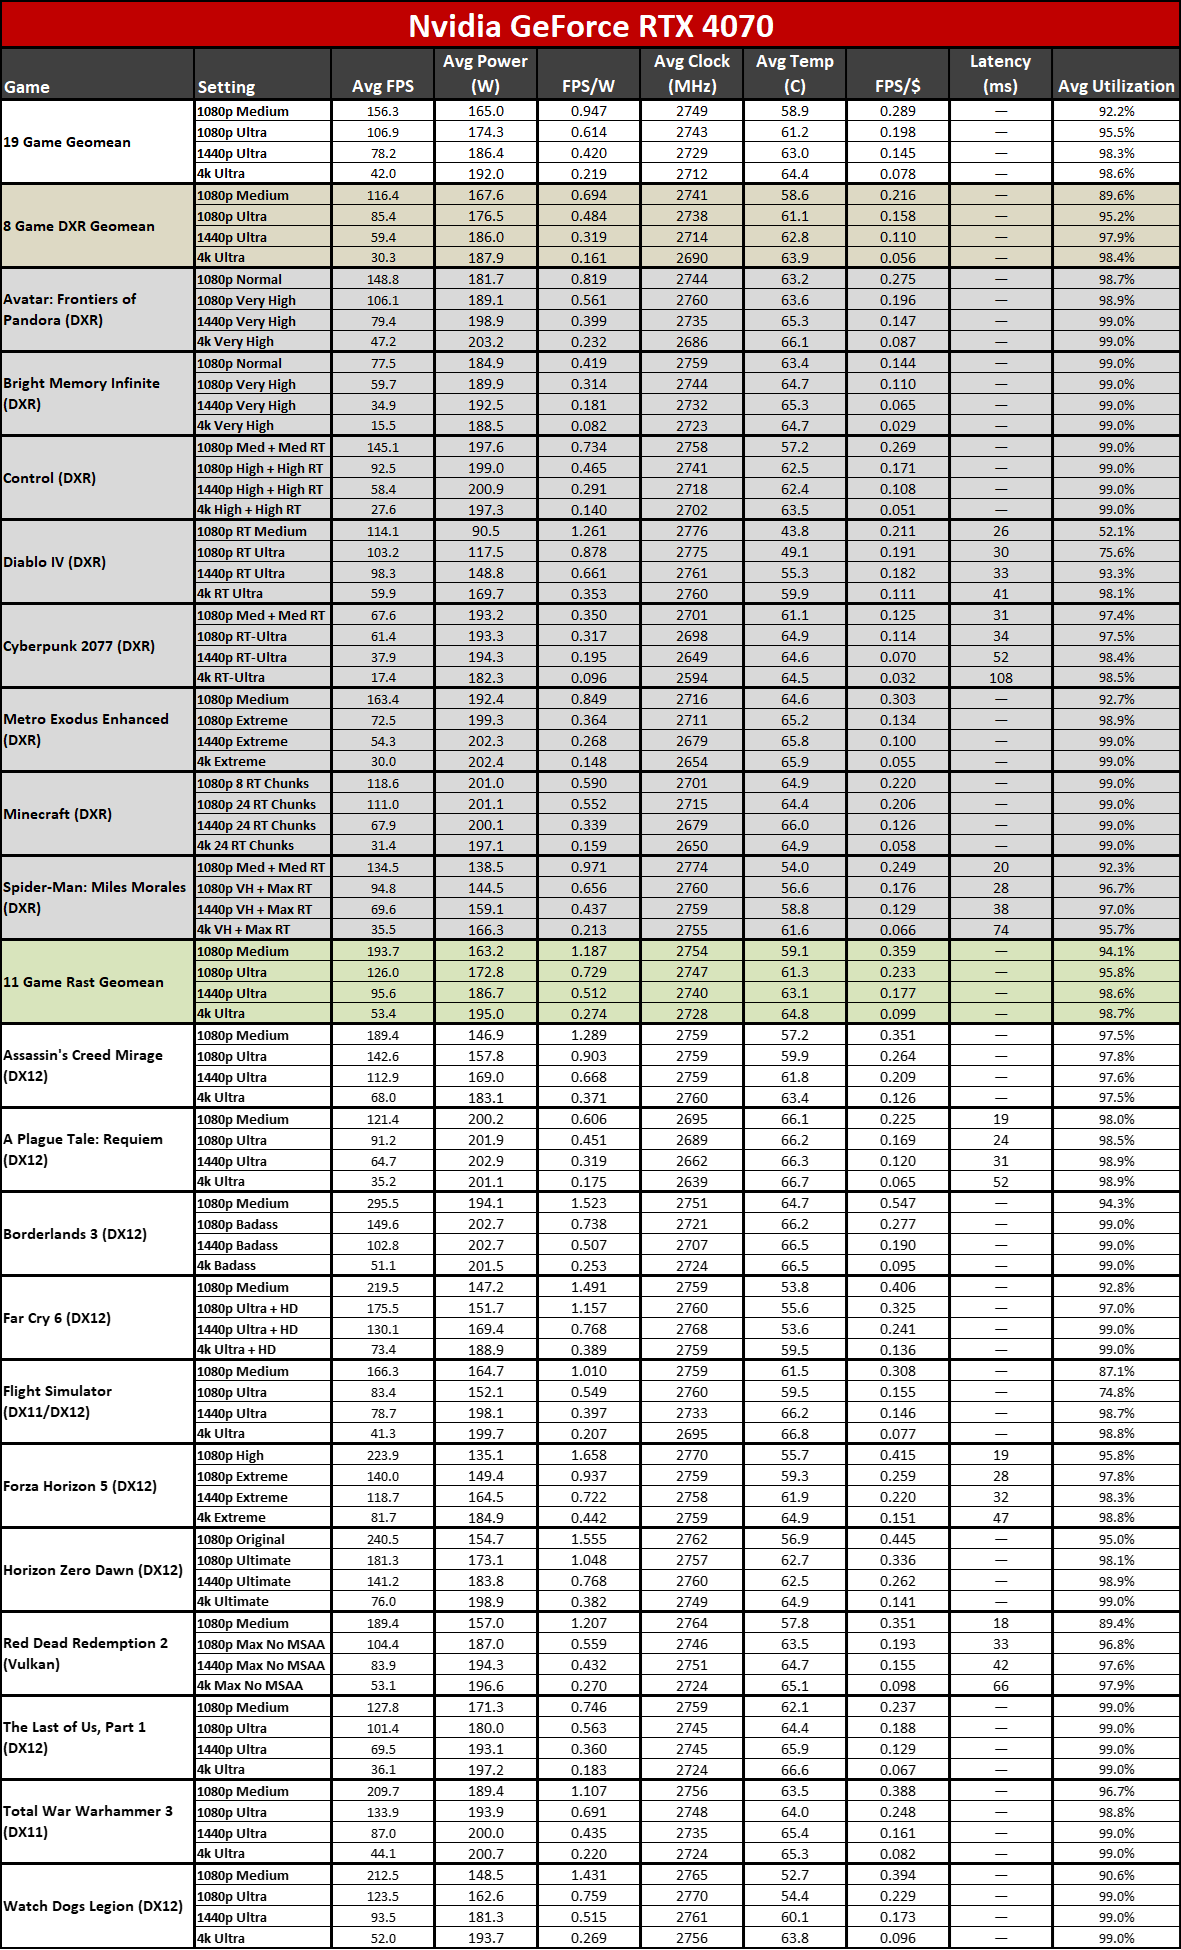
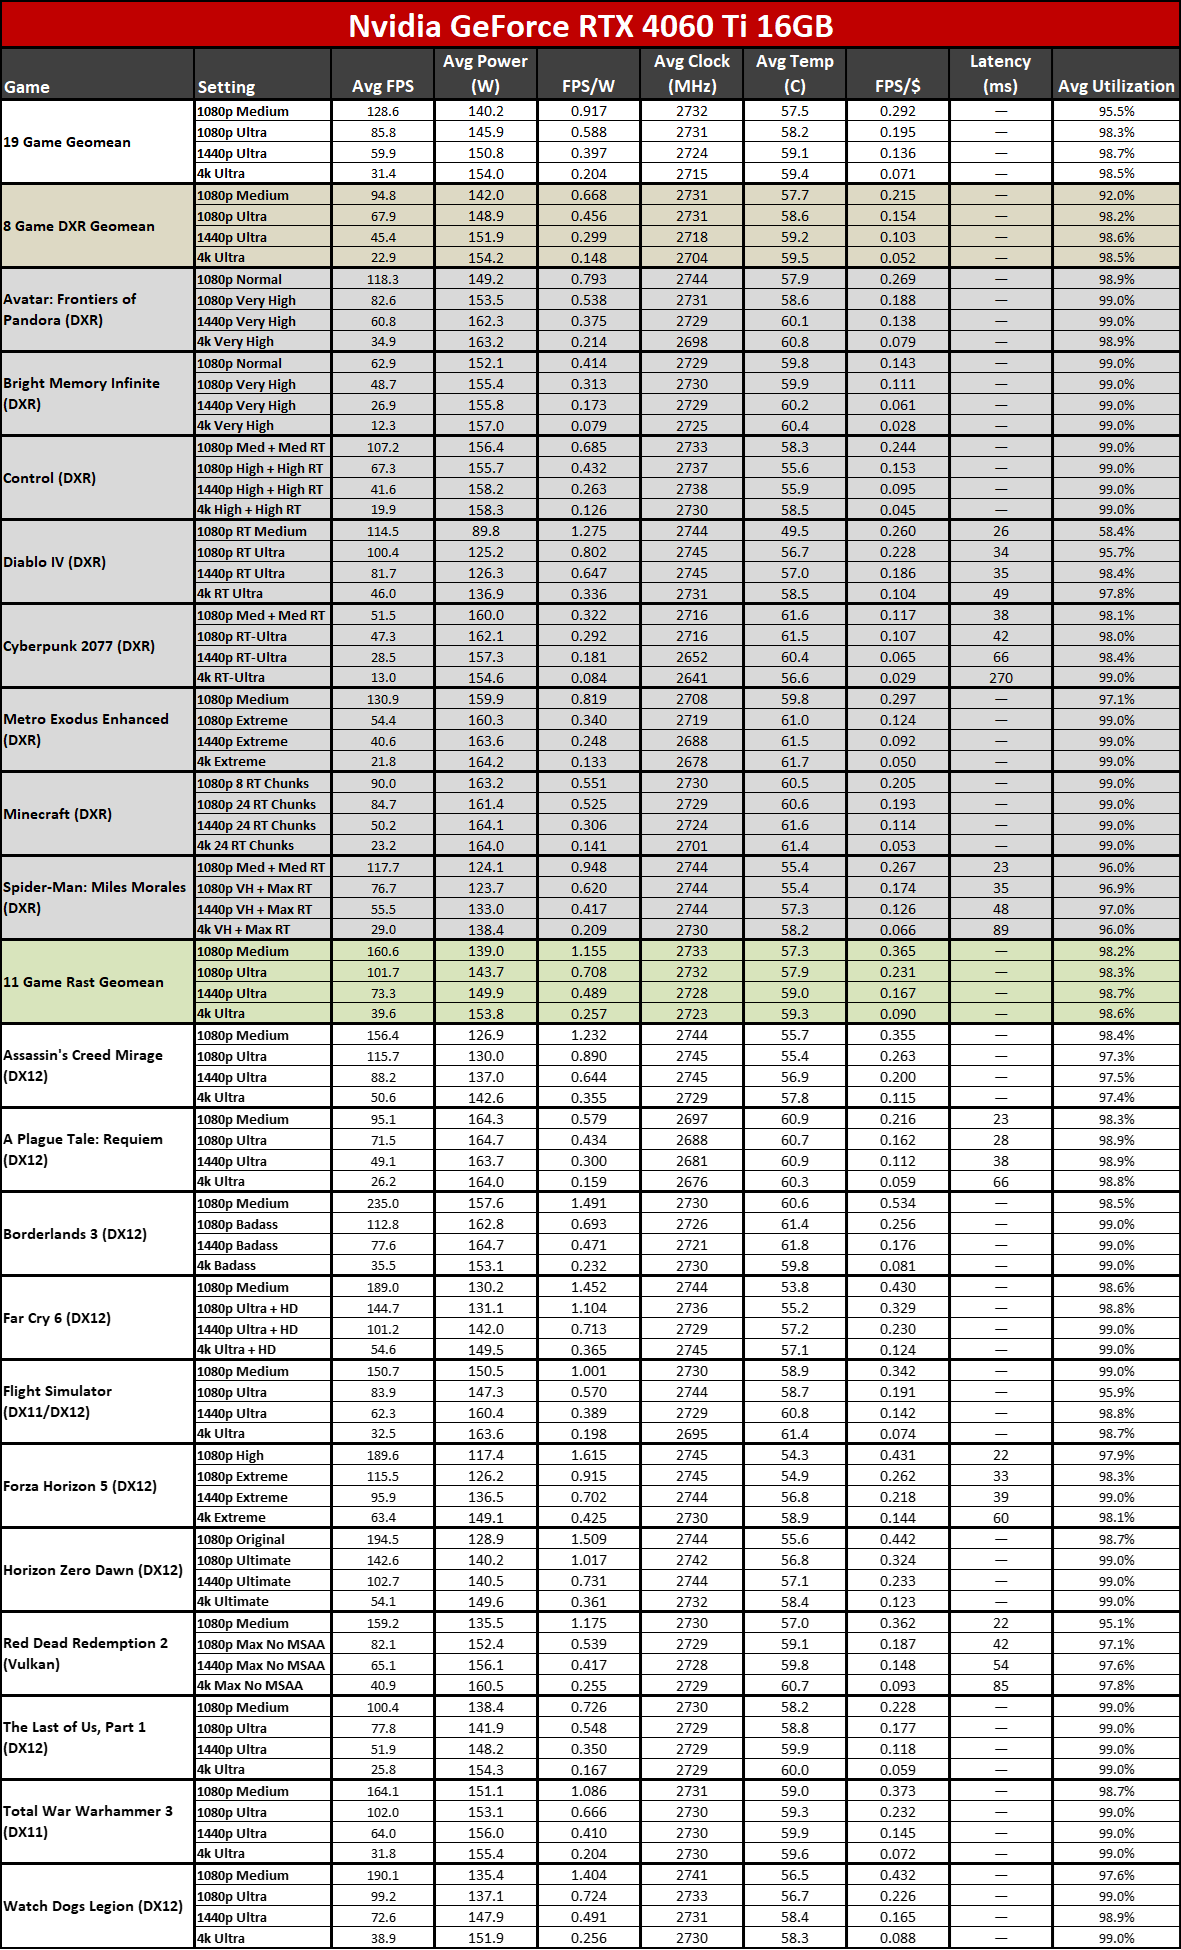
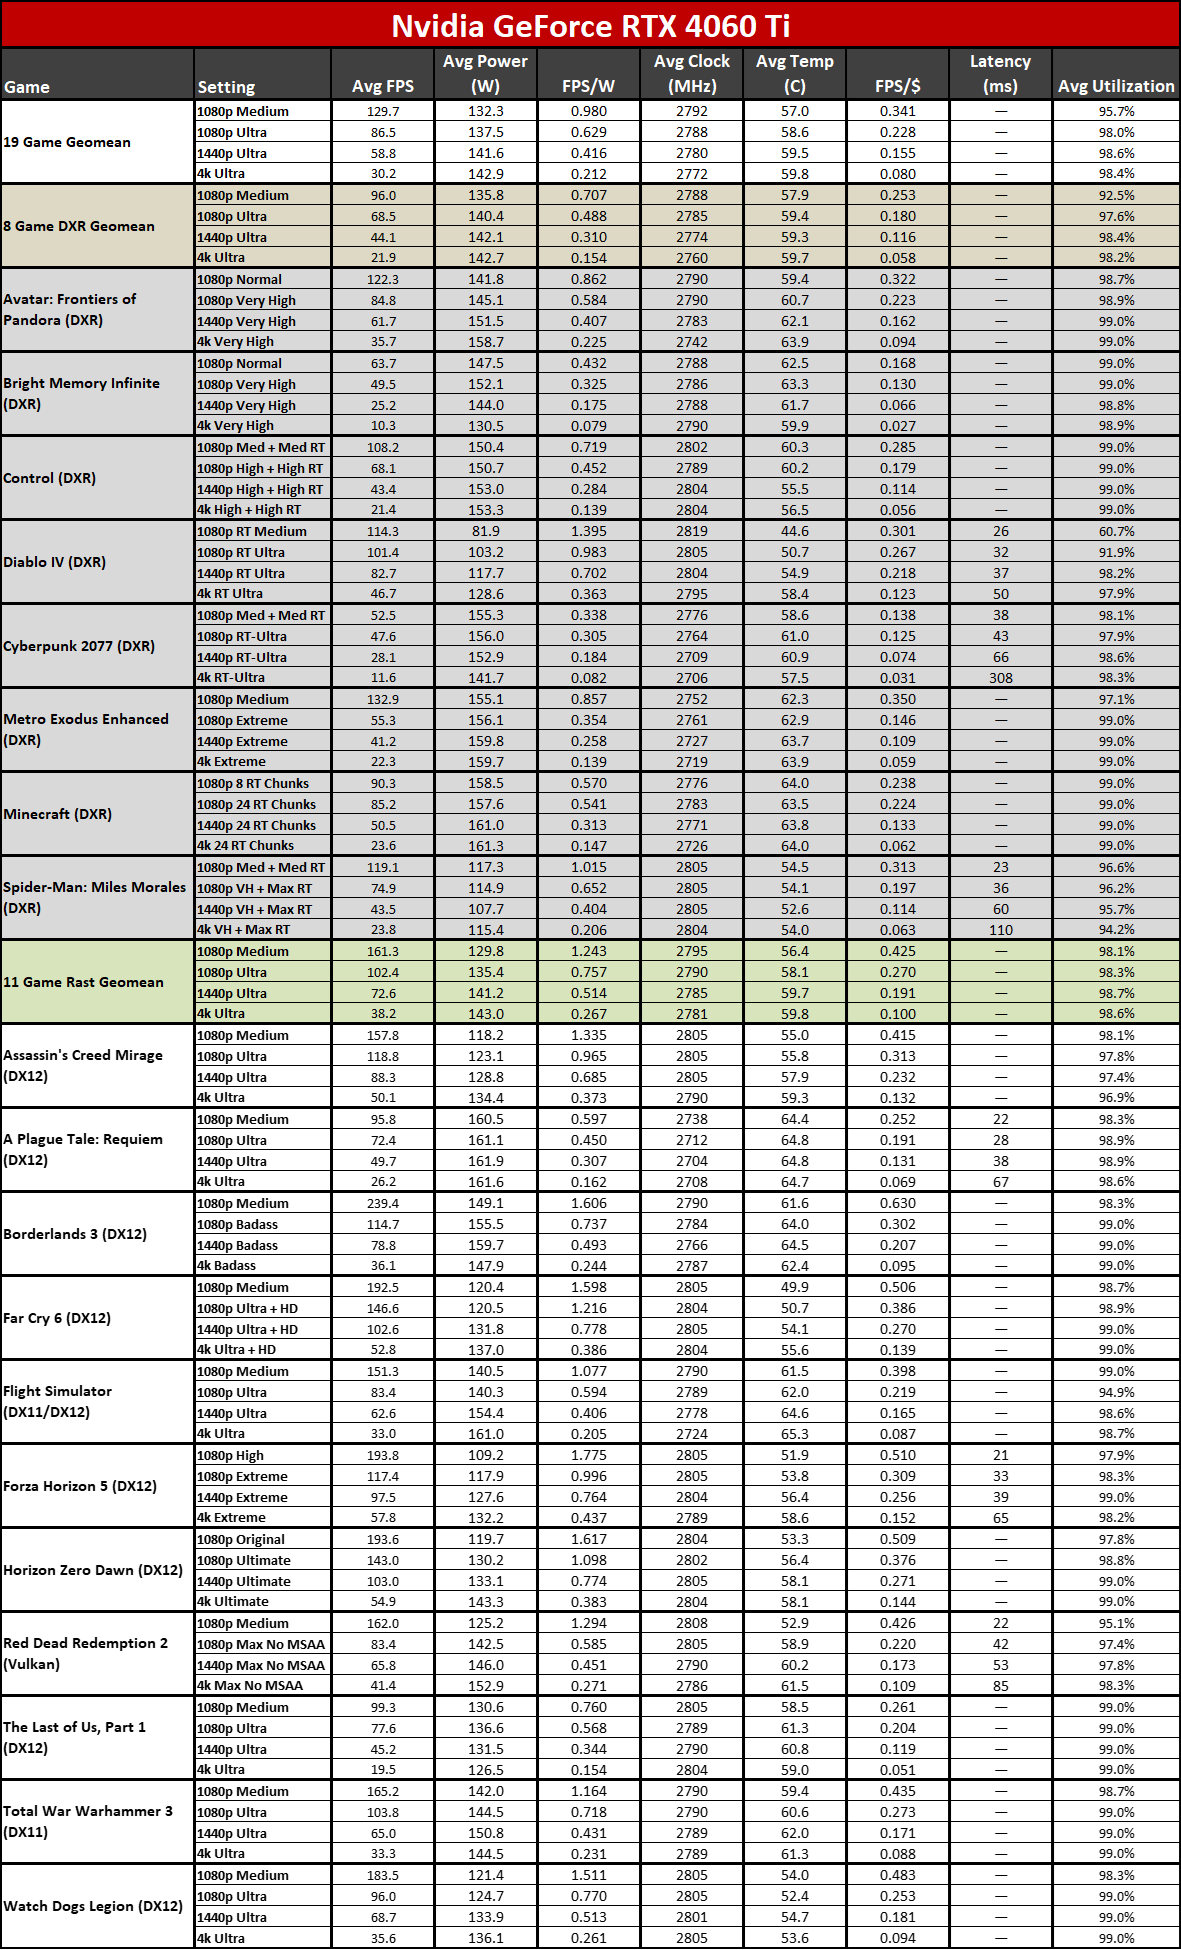
For those who like to look at the finer details, we've provided the above tables showing all of our gaming benchmarks, which include FPS/$ and FPS/W metrics. We use the best prices we can find at the time of writing, which can and do fluctuate on a daily basis.
More expensive cards generally have worse values, as measured by FPS/$. That applies even more to premium cards like the Nitro+, which costs $60 more than the Sapphire Pulse card but only improves performance a few percent. Of the cards we're looking at today, the best value award goes to the RX 7700 XT, thanks to recent price cuts. The 7900 GRE comes relatively close at 4K, but the Nitro+ model falls further behind and basically matches the FPS/$ score of the 7900 XT at higher resolutions.
As we've seen ever since Nvidia launched its RTX 40-series GPUs, efficiency isn't even close between AMD and Nvidia. For 1440p, the tested Nvidia GPUs fall in the 0.397–0.443 FPS/W range, while the AMD GPUs land in the 0.272–0.310 FPS/W range. The RTX 4070 Super ends up being around 50% more efficient than the Nitro+ card.
Get Tom's Hardware's best news and in-depth reviews, straight to your inbox.
- MORE: Best Graphics Cards
- MORE: GPU Benchmarks and Hierarchy
- MORE: All Graphics Content
Current page: Sapphire RX 7900 GRE Nitro+ Power, Clocks, Temps, and Noise
Prev Page Sapphire RX 7900 GRE Nitro+ Gaming Performance Next Page Sapphire RX 7900 GRE Nitro+: Big box aesthetics
Jarred Walton is a senior editor at Tom's Hardware focusing on everything GPU. He has been working as a tech journalist since 2004, writing for AnandTech, Maximum PC, and PC Gamer. From the first S3 Virge '3D decelerators' to today's GPUs, Jarred keeps up with all the latest graphics trends and is the one to ask about game performance.
-
NeoMorpheus I’m not sure if “no rgb fans” is a con.Reply
AMD marketing team has really done a mess with the naming convention.
Then again. Maybe its pure genius to dilute the 9x moniker.
