Do Antivirus Suites Impact Your PC's Performance?
Most of us are now fairly confident that our antivirus scanners are doing their main job of protecting our systems from malicious pests. But what are those scanners doing to system performance behind the scenes? Are some scanners better than others?
Get Tom's Hardware's best news and in-depth reviews, straight to your inbox.
You are now subscribed
Your newsletter sign-up was successful
How We Tested: Benchmarking
We used a 5400 RPM, 2.5” hard drive (rather than a more enthusiast-oriented) conventional SSD specifically to slow down our test times and magnify any differences that the AV products might be exerting on storage operations. In the same vein, this is also why needed a higher caliber of timing tools. A simple stopwatch is too imprecise for several of these tests. Instead, we turned to Microsoft’s Windows Performance Analysis toolkit. The need for this should be clear from the following Microsoft data (found in http://bit.ly/oOg71J):
| System Configuration | Manual Testing Variance | Automated Testing Variance |
|---|---|---|
| High-end desktop | 453 000 ms | 13 977 ms |
| Mid-range laptop | 710 246 ms | 20 401 ms |
| Low-end netbook | 415 250 ms | 242 303 ms |
We combined methodology suggestions from AVG, GFI, McAfee, and Symantec to arrive at our final test set as described below.
1. Install time. Using Windows PowerShell running with admin rights, we measured the installation time of LibreOffice 3.4.3 with this command:
Article continues below$libreoffice_time=measure-command {start-process "msiexec.exe" -Wait -NoNewWindow -ArgumentList "/i .\libreoffice34.msi /qn"}
$libreoffice_time.TotalSeconds
2. Boot time. We used Windows Performance Analyzer’s xbootmgr and xperf tools to measure time elapsed across five looping boot cycles. Our score shows the mean time of the five cycles. Our command was:
xbootmgr –trace boot –prepSystem –numruns 5
Get Tom's Hardware's best news and in-depth reviews, straight to your inbox.
3. Standby time. We used Windows Performance Analysis xbootmgr and xperf tools to measure time elapsed across five looping standby cycles. Our score shows the mean time of the five cycles. Our command was:
xbootmgr –trace standby –numruns 5
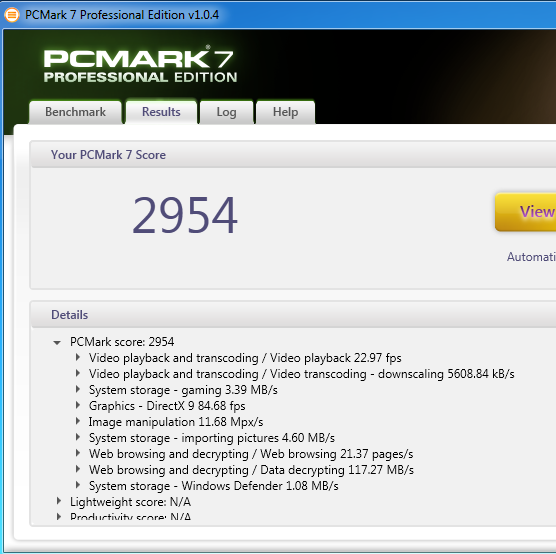
4. Synthetic performance. Our only conventional benchmark in this group, we used PCMark 7 to illustrate performance across a range of conventional computing tasks.
5. Page loads. We selected the following element-dense pages and used HTTPWatch to measure their load times in Internet Explorer 9.
6. Scan time.
This time, a simple stopwatch would do, although most AV vendors display their scanning run times within the application. Given the time scale involved, we felt confident simply using these rougher tools. Because many vendors cache scanned files, we’ve broken out data for the first full scan and a mean value of three subsequent scans. The test system was rebooted between each scan.
Current page: How We Tested: Benchmarking
Prev Page How We Tested: Configuration Next Page Application Installation-
dogman_1234 Regardless what anyone says: Using McAfee is like using a Glad garbage bag as a condom.Reply -
Martell77 I've been using Trend Micros AV since y2k and haven't had a reason to switch. Because of the systems my clients have I never recommend Norton or McAfee and if they have it I always recemmend they switch. Its truely amazing how the performance of their systems increases after getting rid of those AVs, especially Norton.Reply -
soccerdocks On the scanning time page there is an error in the second graph. It also says first run.Reply
Also, the timing of this article was excellent. I had just been doing some research about what anti-virus software I should switch to, mainly based on performance, but I guess I just got all the information I needed. -
compton Some of the results seem mysterious, like all the times the no-AV configuration scored lower in many tests than it should be faster in. Is it possible that using the Wildfire as the system drive instead of the platter would have eliminated this behavior? In general, I hope there is a second part to this that does include SSD runs. I would think any advantage AV products have vs. the no-AV config would evaporate.Reply
I stopped using AV products on my personal systems back in 2003. Norton back then was god-awful on a Pentium 4 systems, seemingly crushing the life out of a system. Even with a first generation WD Raptor 36GB my P4 2.6 would choke not only with Norton, but also McAfee. I might not use AV software, but I do put it on my family members' systems when it doesn't kill performance. In that respect these modern solutions seem much better.
-
ChiefTexas_82 On my Pentium D I have to run McAfee when I'm gone for a good while or sleeping as my computer slows to a crawl during the scan. Even bringing up the menus to stop the scan take way too long.Reply -
darkstar845 Why didn't they test this on a computer with average specs? The 8gb ram and very fast CPU might be offsetting the impact that the AVs put on the computer.Reply -
bit_user Thanks for this. I remember the bad old days when AV could make software builds take several times longer.Reply
-
cdhollan While my comment is completely tangential, but my inner chemical engineer can't resist making a small correction in what is otherwise a great article:Reply
>>Apparently, this is somewhat like saying you can boil water at 230 degrees Fahrenheit instead of 260 degrees. As long as the water is at 212 degrees or higher, no one really cares. -
rottingsheep installing vipre speeds up your computer?Reply
i think something is wrong with your numbers. -
Amazed ESET is not being tested considering it sells itself on its performance over the competition while maintaining the same levels of protection.....Reply
