Why you can trust Tom's Hardware
To learn more about our PSU tests and methodology, please check out How We Test Power Supply Units.
Primary Rails and 5VSB Load Regulation
The following charts show the main rails' voltage values recorded between a range of 40W up to the PSU's maximum specified load, along with the deviation (in percent). Tight regulation is an important consideration every time we review a power supply because it facilitates constant voltage levels despite varying loads. Tight load regulation also, among other factors, improves the system’s stability, especially under overclocked conditions and, at the same time, it applies less stress to the DC-DC converters that many system components utilize.
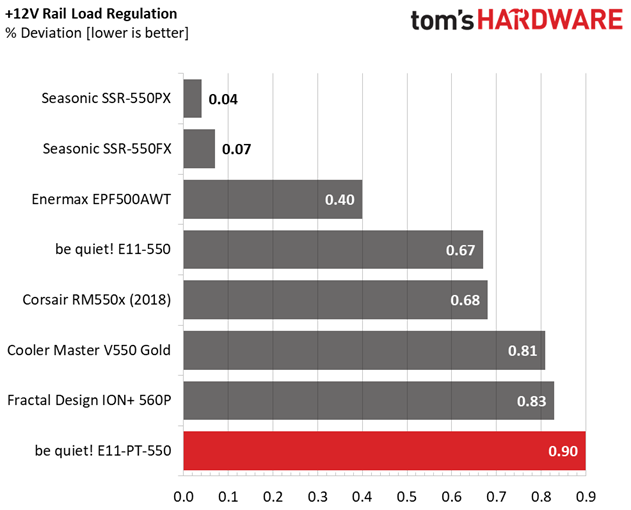
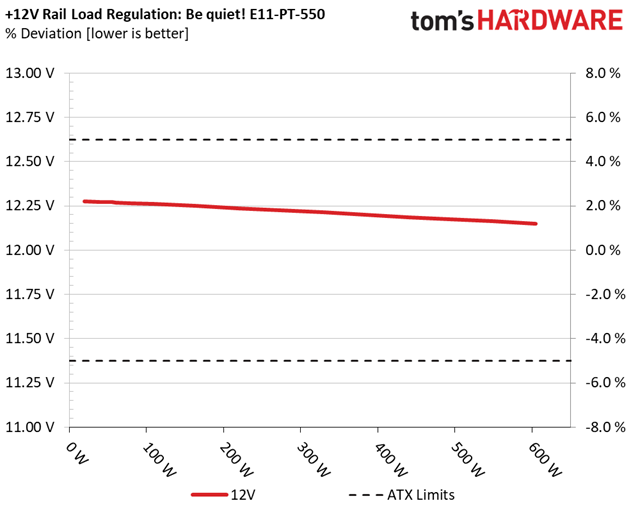
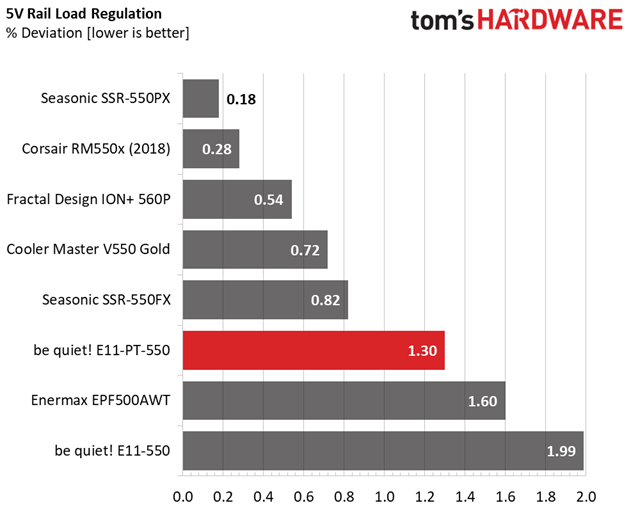
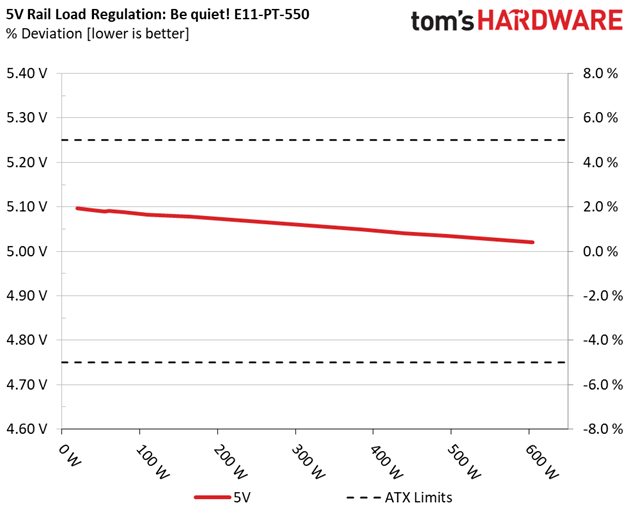
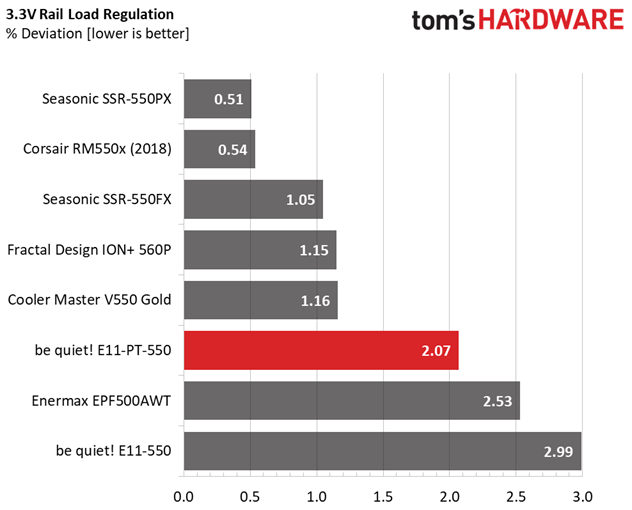
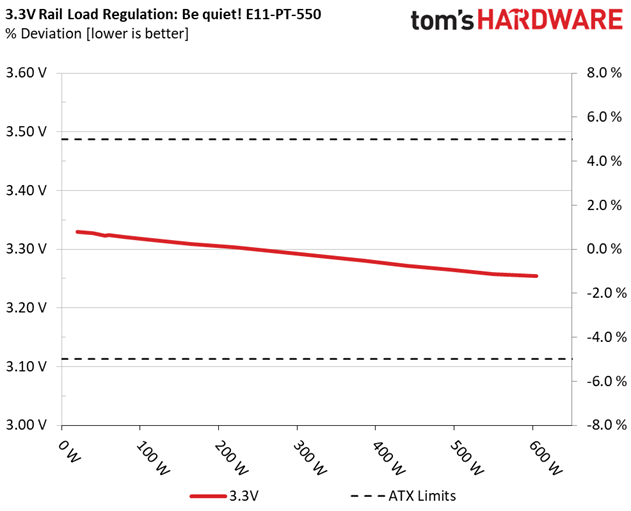
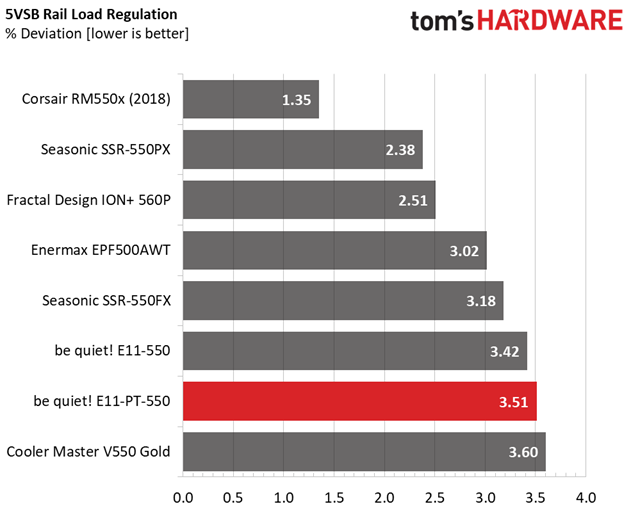
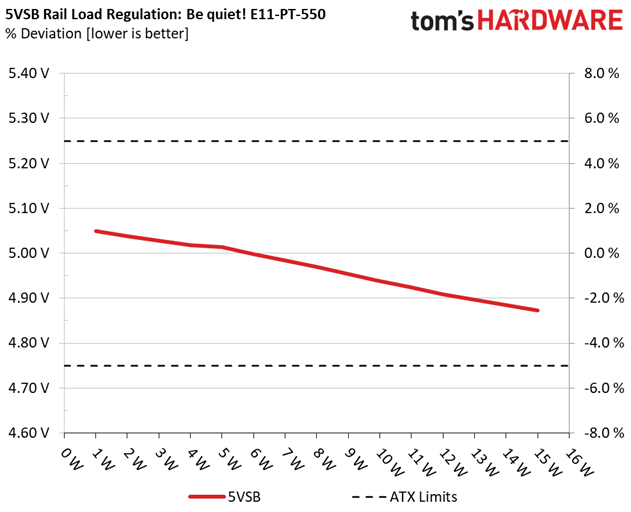
The load regulation at +12V is within 1%, but the competition performs notably better. The situation is about the same on the other rails, as well.
Hold-Up Time
Put simply; hold-up time is the amount of time that the system can continue to run without shutting down or rebooting during a power interruption.
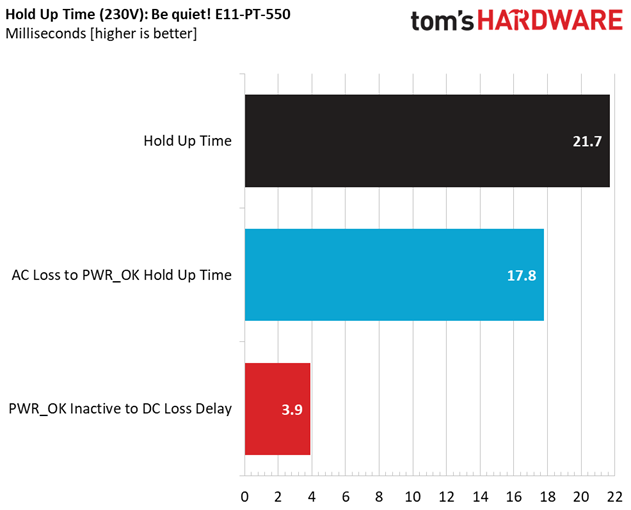
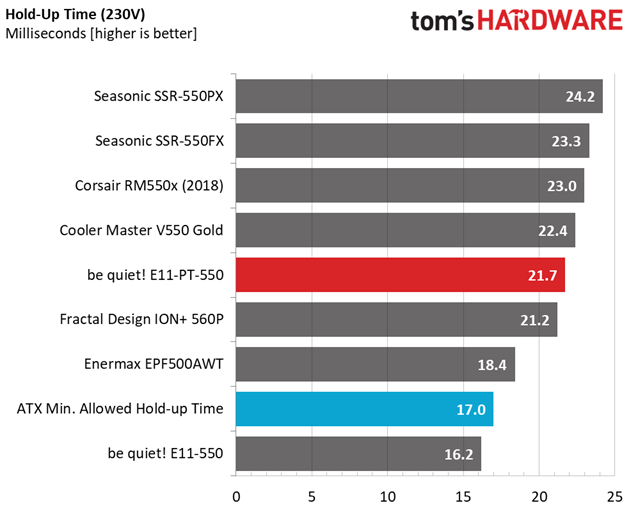
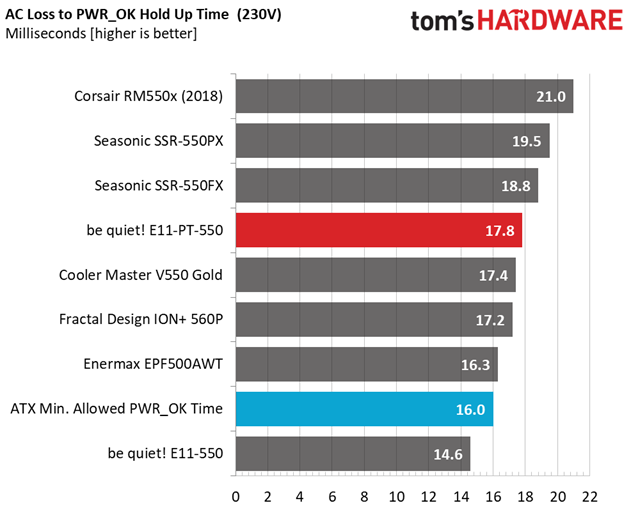
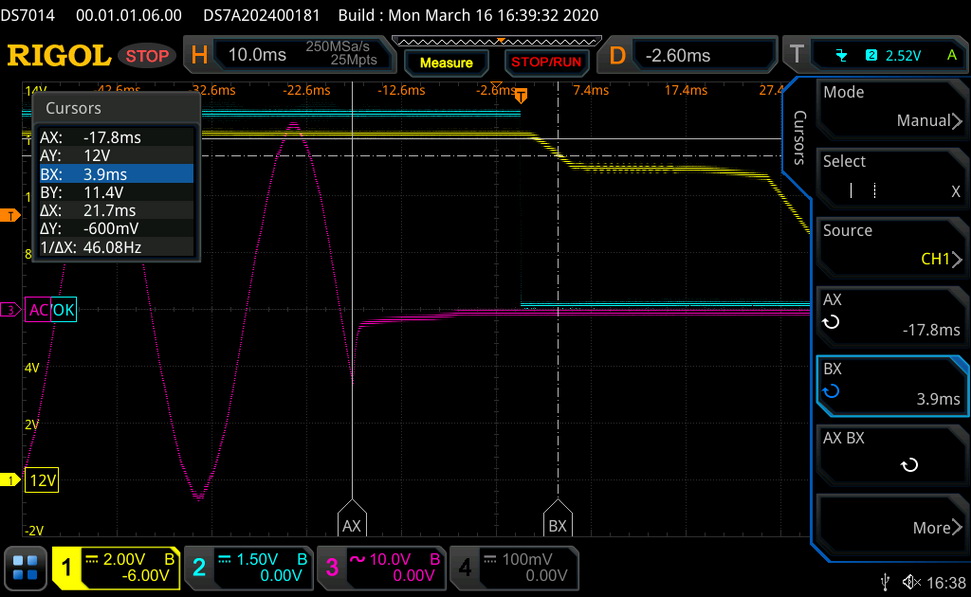
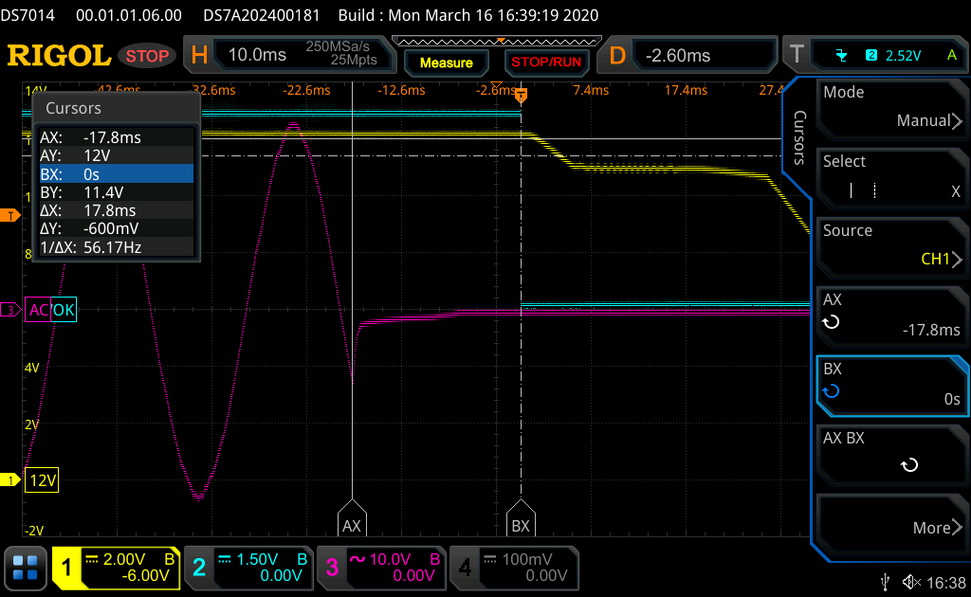
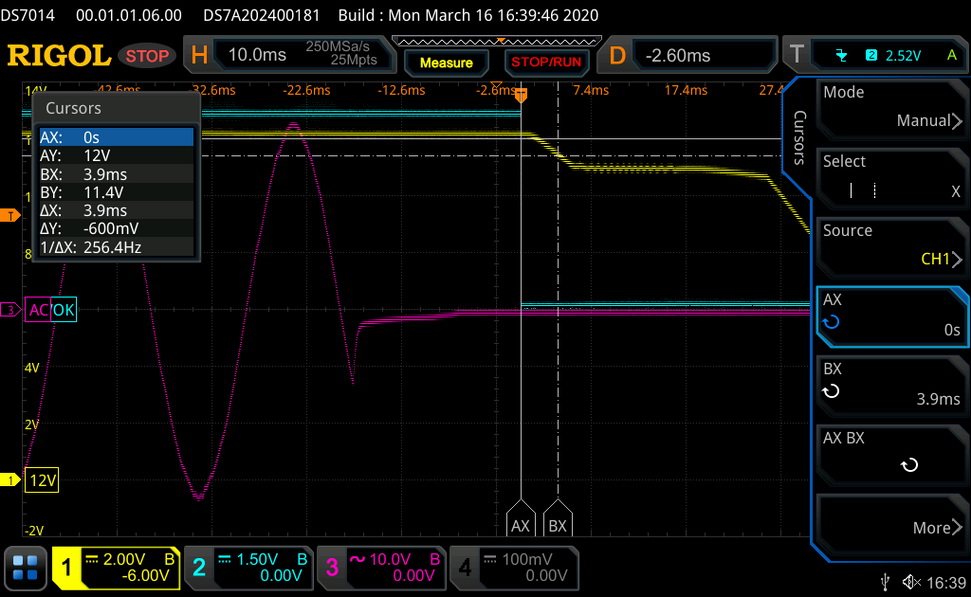
The hold-up time is longer than 20ms and the power-ok signal is accurate.
Inrush Current
Inrush current, or switch-on surge, refers to the maximum, instantaneous input current drawn by an electrical device when it is first turned on. A large enough inrush current can cause circuit breakers and fuses to trip. It can also damage switches, relays, and bridge rectifiers. As a result, the lower the inrush current of a PSU right as it is turned on, the better.
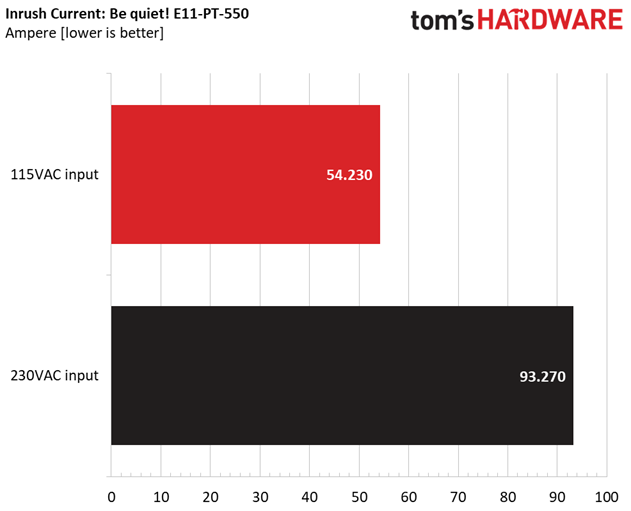
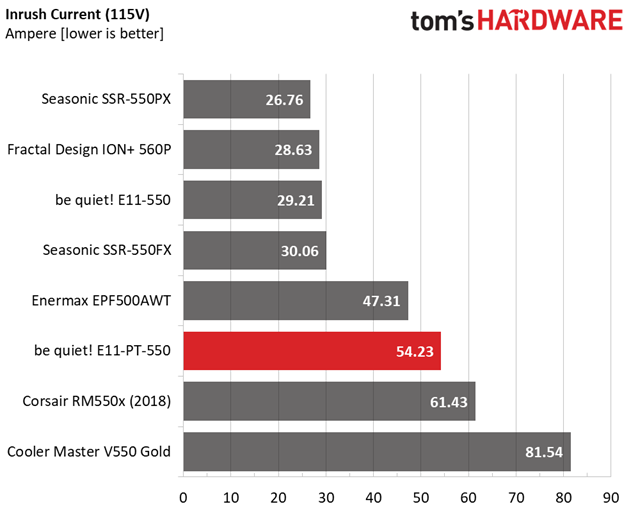
The inrush currents are on the high side, especially with 230V input. A bypass relay for the NTC thermistor, would enhance the inrush current protection.
Get Tom's Hardware's best news and in-depth reviews, straight to your inbox.
10-110% Load Tests
These tests reveal the PSU's load regulation and efficiency levels under high ambient temperatures. They also show how the fan speed profile behaves under increased operating temperatures.
| Test # | 12V | 5V | 3.3V | 5VSB | DC/AC (Watts) | Efficiency | Fan Speed (RPM) | PSU Noise (dB[A]) | Temps (In/Out) | PF/AC Volts |
|---|---|---|---|---|---|---|---|---|---|---|
| 1 | 2.718A | 1.964A | 1.988A | 0.998A | 54.962 | 85.011% | 178 | 6.4 | 40.07°C | 0.975 |
| 12.272V | 5.090V | 3.323V | 5.013V | 64.653 | 43.27°C | 115.11V | ||||
| 2 | 6.453A | 2.952A | 2.985A | 1.201A | 110.026 | 89.658% | 180 | 6.5 | 40.91°C | 0.981 |
| 12.261V | 5.083V | 3.316V | 4.998V | 122.717 | 44.64°C | 115.11V | ||||
| 3 | 10.529A | 3.446A | 3.491A | 1.405A | 165.023 | 91.170% | 181 | 6.5 | 41.41°C | 0.986 |
| 12.249V | 5.078V | 3.309V | 4.984V | 181.005 | 45.48°C | 115.11V | ||||
| 4 | 14.614A | 3.944A | 3.998A | 1.610A | 220.024 | 91.703% | 182 | 6.5 | 41.74°C | 0.990 |
| 12.236V | 5.071V | 3.303V | 4.970V | 239.930 | 46.31°C | 115.11V | ||||
| 5 | 18.366A | 4.937A | 5.007A | 1.817A | 275.012 | 91.737% | 184 | 6.5 | 42.20°C | 0.993 |
| 12.224V | 5.064V | 3.296V | 4.954V | 299.784 | 47.86°C | 115.14V | ||||
| 6 | 22.123A | 5.935A | 6.023A | 2.000A | 329.885 | 91.439% | 199 | 6.9 | 42.98°C | 0.994 |
| 12.213V | 5.057V | 3.288V | 4.940V | 360.770 | 49.04°C | 115.10V | ||||
| 7 | 25.899A | 6.933A | 7.044A | 2.235A | 385.082 | 90.841% | 397 | 13.7 | 43.18°C | 0.995 |
| 12.200V | 5.049V | 3.280V | 4.924V | 423.907 | 49.74°C | 115.14V | ||||
| 8 | 29.680A | 7.937A | 8.070A | 2.445A | 440.098 | 90.325% | 516 | 15.5 | 43.83°C | 0.996 |
| 12.186V | 5.041V | 3.272V | 4.909V | 487.238 | 50.93°C | 115.09V | ||||
| 9 | 33.848A | 8.443A | 8.574A | 2.449A | 494.609 | 89.887% | 632 | 17.9 | 44.23°C | 0.996 |
| 12.175V | 5.035V | 3.265V | 4.902V | 550.258 | 52.06°C | 115.09V | ||||
| 10 | 37.826A | 8.953A | 9.115A | 3.079A | 549.781 | 89.500% | 632 | 17.9 | 44.51°C | 0.997 |
| 12.163V | 5.027V | 3.258V | 4.872V | 614.281 | 52.95°C | 115.09V | ||||
| 11 | 42.411A | 8.965A | 9.128A | 3.084A | 604.961 | 89.128% | 633 | 17.8 | 44.88°C | 0.997 |
| 12.149V | 5.020V | 3.254V | 4.865V | 678.753 | 53.69°C | 115.10V | ||||
| CL1 | 0.121A | 12.998A | 13.000A | 0.000A | 110.077 | 85.258% | 198 | 6.9 | 42.23°C | 0.982 |
| 12.265V | 5.064V | 3.290V | 5.019V | 129.111 | 47.57°C | 115.11V | ||||
| CL2 | 45.835A | 1.000A | 1.000A | 1.000A | 570.420 | 90.378% | 677 | 19.6 | 44.27°C | 0.997 |
| 12.155V | 5.045V | 3.283V | 4.967V | 631.146 | 52.94°C | 115.10V |
With 20% and 50% load the efficiency is a little lower than the required 80 PLUS Platinum thresholds, because of the higher temperatures that we applied. With full load, the registered efficiency level is higher than the required 89%, even at 44.5°C.
20-80W Load Tests
In the following tests, we measure the PSU's efficiency at loads significantly lower than 10% of its maximum capacity (the lowest load the 80 PLUS standard measures). This is important for representing when a PC is idle with power-saving features turned on.
| Test # | 12V | 5V | 3.3V | 5VSB | DC/AC (Watts) | Efficiency | Fan Speed (RPM) | PSU Noise (dB[A]) | PF/AC Volts |
|---|---|---|---|---|---|---|---|---|---|
| 1 | 1.209A | 0.491A | 0.494A | 0.198A | 19.990 | 73.742% | 174 | 6.3 | 0.939 |
| 12.277V | 5.096V | 3.330V | 5.049V | 27.108 | 115.09V | ||||
| 2 | 2.418A | 0.983A | 0.991A | 0.397A | 39.980 | 82.790% | 175 | 6.3 | 0.965 |
| 12.273V | 5.093V | 3.327V | 5.038V | 48.291 | 115.09V | ||||
| 3 | 3.632A | 1.472A | 1.489A | 0.597A | 60.010 | 86.429% | 177 | 6.3 | 0.979 |
| 12.270V | 5.091V | 3.324V | 5.028V | 69.433 | 115.09V | ||||
| 4 | 4.839A | 1.966A | 1.988A | 0.797A | 79.959 | 88.290% | 178 | 6.4 | 0.981 |
| 12.266V | 5.088V | 3.321V | 5.018V | 90.564 | 115.18V |
The efficiency levels are high in this load range (20-80W), while the fan spins at very low speeds, with the noise output bring close to the noise floor of our hemi-anechoic chamber.
2% or 10W Load Test
Intel plans on raising the ante at efficiency levels under ultra-light loads. So from July 2020, the ATX spec will require 70% and higher efficiency with 115V input. The applied load is only 10W for PSUs with 500W and lower capacities, while for stronger units we dial 2% of their max-rated-capacity.
| Test # | 12V | 5V | 3.3V | 5VSB | DC/AC (Watts) | Efficiency | Fan Speed (RPM) | PSU Noise (dB[A]) | PF/AC Volts |
|---|---|---|---|---|---|---|---|---|---|
| 1 | 0.743A | 0.216A | 0.216A | 0.049A | 11.175 | 61.973% | 159 | 6.1 | 0.874 |
| 12.260V | 5.090V | 3.331V | 5.052V | 18.032 | 115.09V |
With 2%, of the max-rated-capacity, load the PSU's efficiency barely exceeds 60%. It should be above 70%.
Efficiency
Next, we plotted a chart showing the PSU's efficiency at low loads, and loads from 10 to 110% of its maximum-rated capacity. The higher a PSU’s efficiency, the less energy goes wasted, leading to a reduced carbon footprint and lower electricity bills.
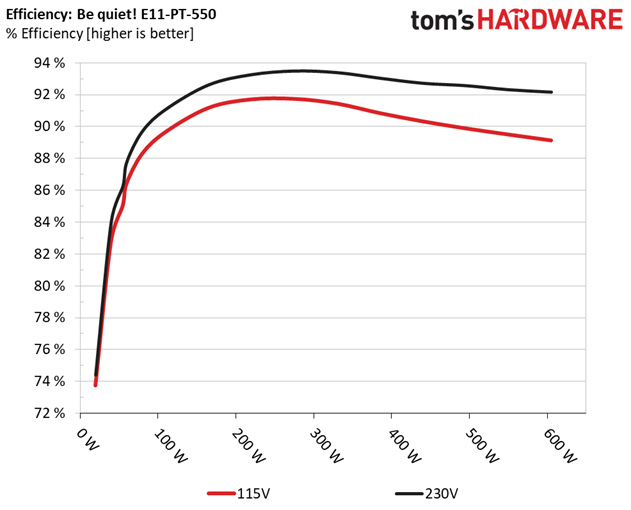
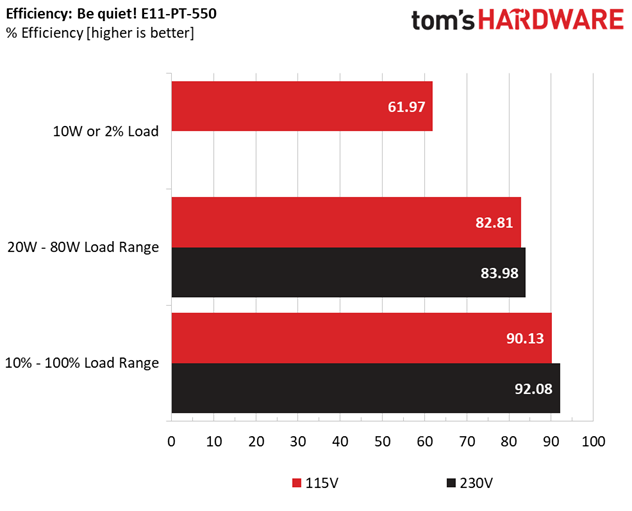
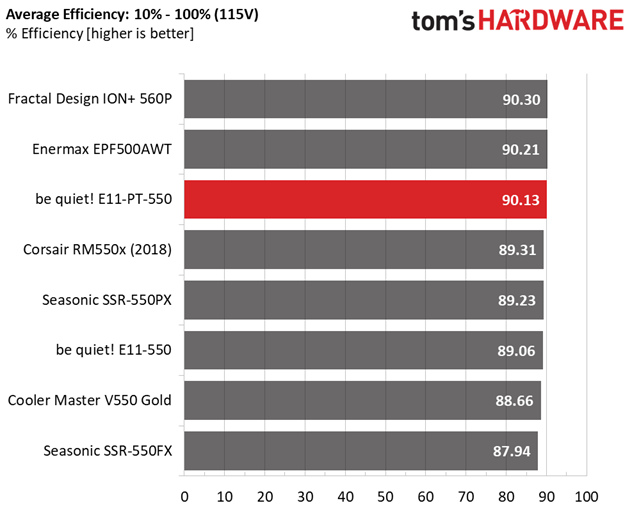
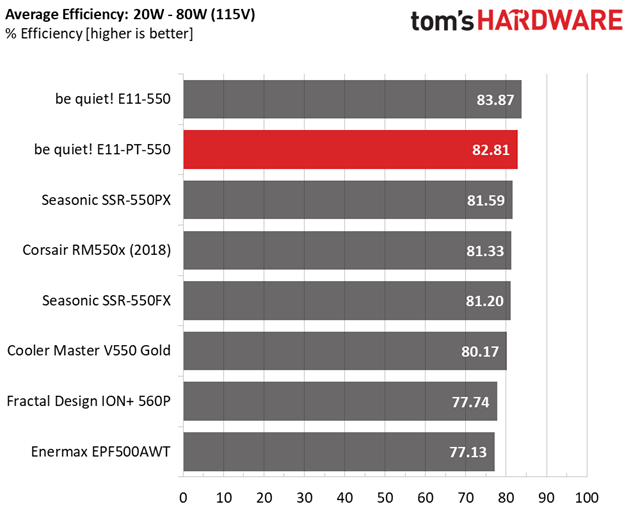
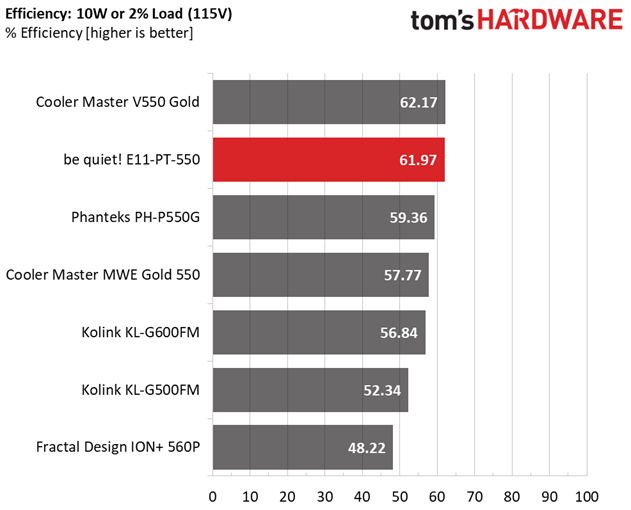
For the standards of this category, the efficiency that the be quiet! unit achieves, is pretty high, in all load ranges. Nonetheless, as we already stated, with 2% load Intel asks for higher than 70% efficiency levels.
5VSB Efficiency
| Test # | 5VSB | DC/AC (Watts) | Efficiency | PF/AC Volts |
|---|---|---|---|---|
| 1 | 0.100A | 0.505 | 67.244% | 0.107 |
| 5.054V | 0.751 | 115.14V | ||
| 2 | 0.250A | 1.262 | 77.423% | 0.201 |
| 5.048V | 1.630 | 115.14V | ||
| 3 | 0.550A | 2.771 | 80.905% | 0.307 |
| 5.037V | 3.425 | 115.14V | ||
| 4 | 1.000A | 5.022 | 81.792% | 0.374 |
| 5.021V | 6.140 | 115.13V | ||
| 5 | 1.500A | 7.506 | 81.543% | 0.411 |
| 5.003V | 9.205 | 115.13V | ||
| 6 | 3.000A | 14.848 | 80.652% | 0.463 |
| 4.949V | 18.410 | 115.11V |
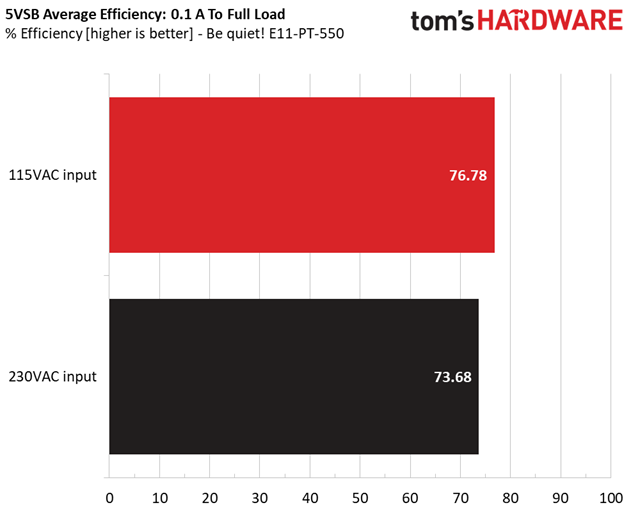
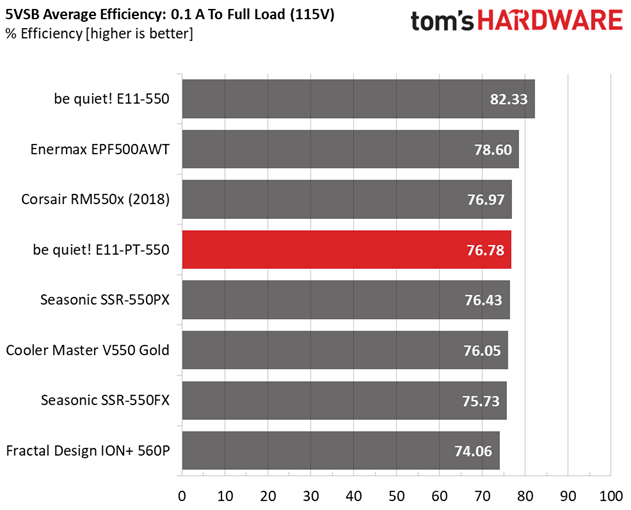
The older model achieves much higher efficiency levels at 5VSB!
Power Consumption In Idle And Standby
| Mode | 12V | 5V | 3.3V | 5VSB | Watts | PF/AC Volts |
|---|---|---|---|---|---|---|
| Idle | 12.271V | 5.090V | 3.330V | 5.057V | 6.398 | 0.604 |
| 115.1V | ||||||
| Standby | 0.144 | 0.021 | ||||
| 115.1V |
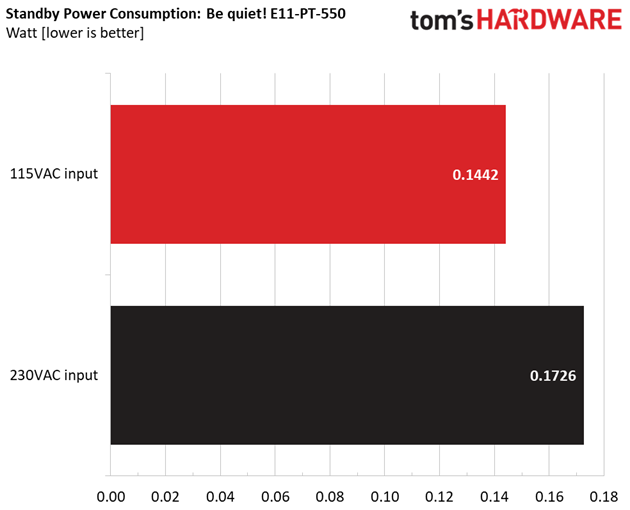
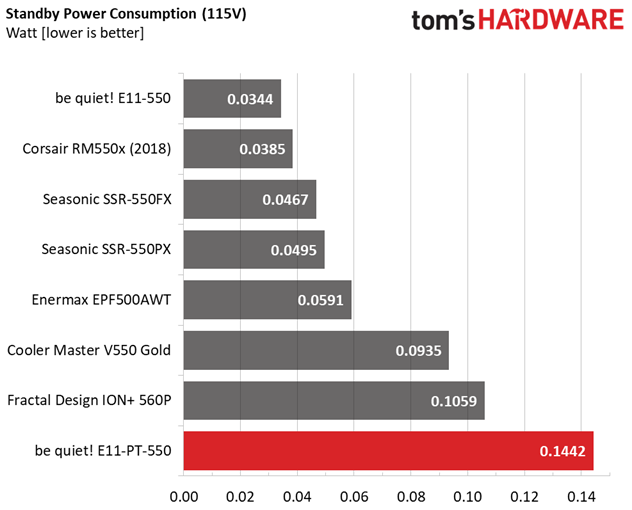
The vampire power is increased, especially with 230V.
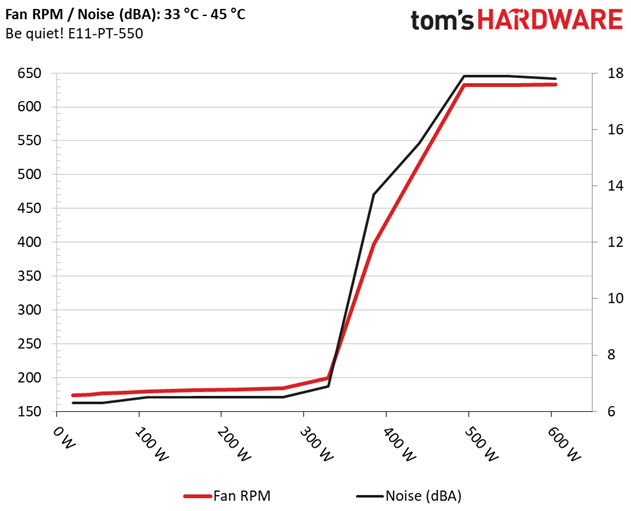
Fan RPM, Delta Temperature, And Output Noise
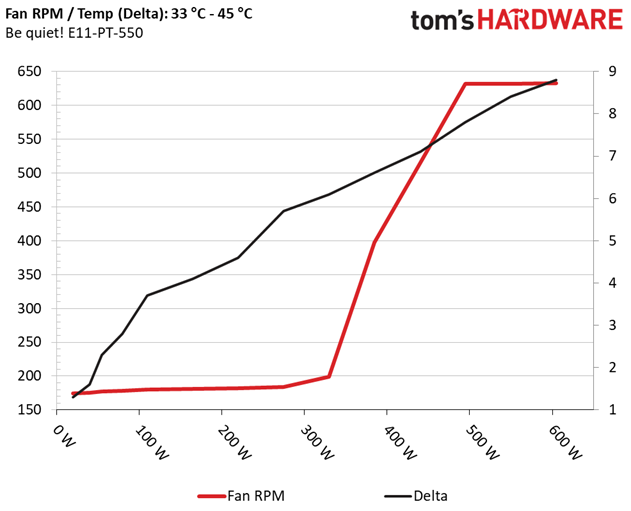
All results are obtained between an ambient temperature of 33 to 45 degrees Celsius (91.4 to 113 degrees Fahrenheit).
The fan speed profile is super relaxed, even under high operating temperatures.
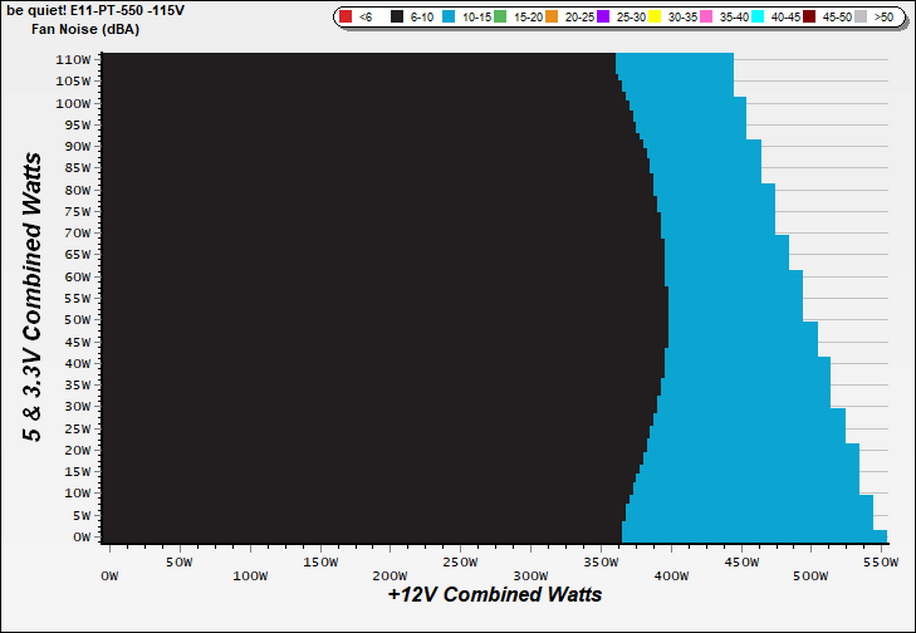
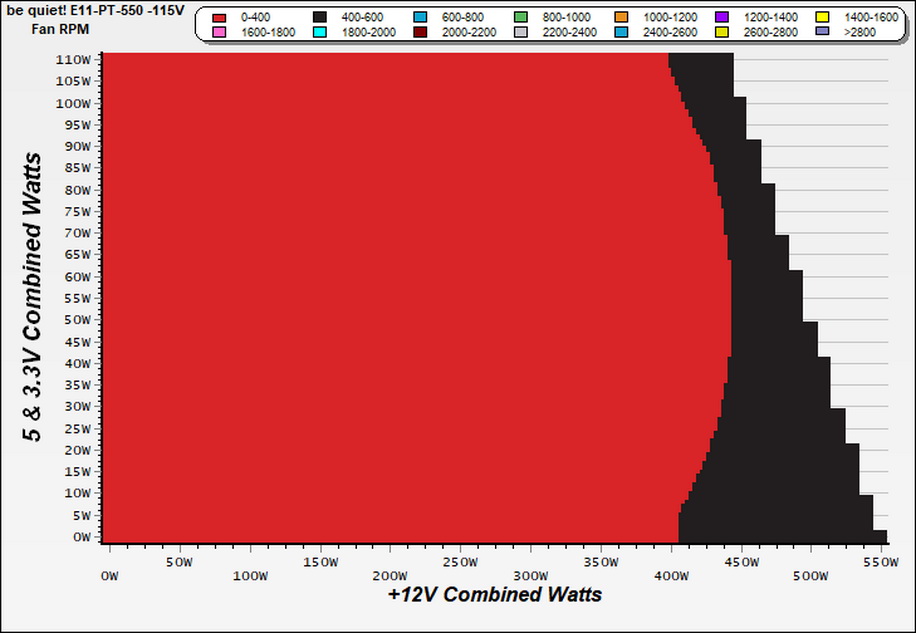
The following results were obtained at 30 to 32 degrees Celsius (86 to 89.6 degrees Fahrenheit) ambient temperature.
The PSU's fan spins at very low speeds so, most of the time, you won't hear it at all.
MORE: Best Power Supplies
MORE: How We Test Power Supplies
MORE: All Power Supply Content
Current page: Load Regulation, Hold-Up Time, Inrush Current, Efficiency and Noise
Prev Page Specifications and Part Analysis Next Page Protection Features, DC Power Sequencing, Cross-Load Tests and Infrared Images
Aris Mpitziopoulos is a contributing editor at Tom's Hardware, covering PSUs.
-
JohnBonhamsGhost how can it be both;Reply
+ FORCompatible with the alternative sleep mode
&
- AGAINSTNot compatible with the alternative sleep mode
?? -
chaz_music Great write up, Aris.Reply
I was not aware that the Intel PSU specs were coming out this summer (July 2020), which is great. BTW, take a look at the ripple graph on page 3. I think the Y axis is labelled wrong. Also, why no data on the 115VAC holdup? That is critical for people using this PSU with a standard UPS. Most of desktop UPS systems (think: inexpensive) are standby / line interactive and have a change over relay with transfer times in the 4-20mSec time range. Any PSU that is lower than that will have problems keeping the CPU alive during an outage. Too bad there is not a signal from the PSU to the CPU to power back. That signal could be used everywhere to cause SSDs and RAID arrays to go into save mode, and other subsystems to power down (Ethernet, USB, audio, etc.).
The Cybernetics Labs testing methods are spot on for the "how and why". There are minor tweaks that I would make, but overall, excellent testing methodology. The UPS market has cheated on efficiency for decades by testing a cold UPS for the product documentation. Everything should be at thermal steady state for true efficiency numbers, and at realistic operating conditions. The only parts that benefit from being warm are the electrolytic caps, except for their lifetime. I believe it is still true that all electrolytic caps have a decrease in ESR as they get warmer, up to a point depending on the electrolyte used. Everything else gets worse efficiency with heat: MOSFETS, XFMR, filter inductors, etc.
It is good to see better efficiency numbers in lower power PSUs. I searched for along time on my NAS build for at least a 80+ gold rated 200-250W PSU. I finally found an FSP 250W unit that was in an SFX package. A great article would be one who has the better/best low power PSUs especially in the area of efficiency.
Several points that I believe get overlooked in thinking about efficiency:
How much energy are you going to use to cool the building that the PSU is in? Usually around 50% of the total PSU power used for the months that HVAC is being used. This also gets overlooked with cost comparisons for LED bulbs versus incandescent bulbs. The HVAC savings is enormous.
The concept that the payback period for a higher cost efficient PSU does not give good ROI. I reuse most of my PSUs unless the caps look poor or I have had it being used at over 50-60% rated power for much of its life. With PSU getting warranties of 5years+, the added cost should be amortized over a longer period. Maybe over two chassis builds?
Thanks for the great article.
BR,
Charles -
Aris_Mp Reply
this is an obvious error. It IS compatible with the alternative sleep mode. Already asked to fix this.JohnBonhamsGhost said:how can it be both;
+ FORCompatible with the alternative sleep mode
&
- AGAINSTNot compatible with the alternative sleep mode
?? -
Aris_Mp Replychaz_music said:Great write up, Aris.
I was not aware that the Intel PSU specs were coming out this summer (July 2020), which is great. BTW, take a look at the ripple graph on page 3. I think the Y axis is labelled wrong. Also, why no data on the 115VAC holdup? That is critical for people using this PSU with a standard UPS. Most of desktop UPS systems (think: inexpensive) are standby / line interactive and have a change over relay with transfer times in the 4-20mSec time range. Any PSU that is lower than that will have problems keeping the CPU alive during an outage. Too bad there is not a signal from the PSU to the CPU to power back. That signal could be used everywhere to cause SSDs and RAID arrays to go into save mode, and other subsystems to power down (Ethernet, USB, audio, etc.).
The Cybernetics Labs testing methods are spot on for the "how and why". There are minor tweaks that I would make, but overall, excellent testing methodology. The UPS market has cheated on efficiency for decades by testing a cold UPS for the product documentation. Everything should be at thermal steady state for true efficiency numbers, and at realistic operating conditions. The only parts that benefit from being warm are the electrolytic caps, except for their lifetime. I believe it is still true that all electrolytic caps have a decrease in ESR as they get warmer, up to a point depending on the electrolyte used. Everything else gets worse efficiency with heat: MOSFETS, XFMR, filter inductors, etc.
It is good to see better efficiency numbers in lower power PSUs. I searched for along time on my NAS build for at least a 80+ gold rated 200-250W PSU. I finally found an FSP 250W unit that was in an SFX package. A great article would be one who has the better/best low power PSUs especially in the area of efficiency.
Several points that I believe get overlooked in thinking about efficiency:
How much energy are you going to use to cool the building that the PSU is in? Usually around 50% of the total PSU power used for the months that HVAC is being used. This also gets overlooked with cost comparisons for LED bulbs versus incandescent bulbs. The HVAC savings is enormous.
The concept that the payback period for a higher cost efficient PSU does not give good ROI. I reuse most of my PSUs unless the caps look poor or I have had it being used at over 50-60% rated power for much of its life. With PSU getting warranties of 5years+, the added cost should be amortized over a longer period. Maybe over two chassis builds?Thanks for the great article.
BR,
Charles
Hi Charles, and thank you for your comments.
The hold-up time is almost identical between 115V and 230V. The change is in the inrush current. I agree with you, the hold-up time is of immense importance.
CL ripple graph in page 3, I cannot find anything out of order.
If you have any suggestions on how to improve the Cybenetics methodology, they always hear opinions and are ready to make changes, if those are for the best.
About efficiency, diodes have lower voltage drops at increased temperatures as well, and this plays a major role especially in bridge rectifiers.
Thank you for the other two points you mention. Indeed the cost of dealing with the added thermal load of lower efficiency PSUs is significant. -
Co BIY Interesting cross-hatching (in solder?) on the back of the board in the FET and VRM photo.Reply
Can someone explain the purpose of that ? Heat Sink ? Heat dissipation ?
