Core i7: 4-Way CrossFire, 3-way SLI, Paradise?
Benchmark Results: 3DMark Vantage
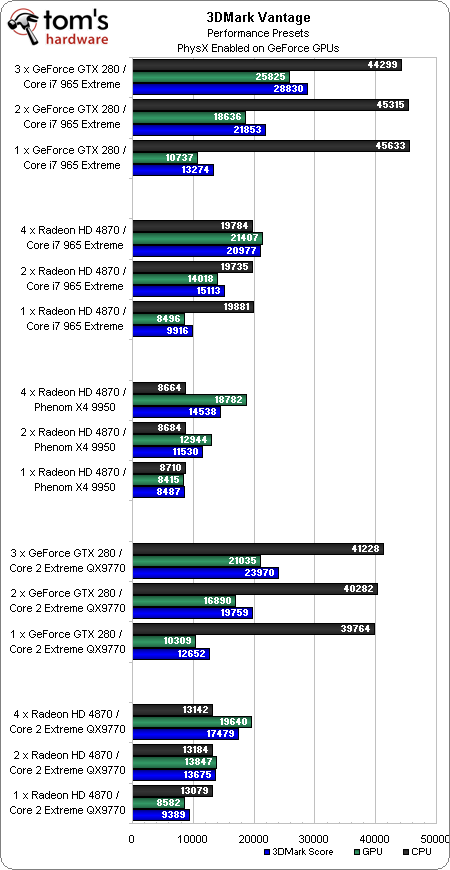
You’ll have to take these scores with a grain of salt and compare the GeForce GTX 280 results separately from AMD’s Radeon HD 4870, since a default run with PhysX artificially inflates these scores. We say the boost is artificial because there are a limited number of titles optimized for PhysX technology, including just one of the titles in our benchmark suite. Nevertheless, 3DMark assigns a huge gain to the inclusion of hardware physics acceleration—the black bars in our chart. When someone can show us real-world gains as proportionately large, we’ll change our tune on this one.

From Core 2 Extreme to Core i7 965 Extreme, the GeForce GTX 280s see a distinct performance increase in the processing and overall scores. Yet we’re forced to suspect that Nvidia’s drivers aren’t even fully-optimized yet, since the GPU score actually falls. Either that or the x16/x8/x8 PCI Express configuration really does negatively impact graphics performance. Should PCI Express throughput turn out to be the limiting factor here, we’d expect to see motherboard vendors actually hopping on board with nForce 200 before long now that their native solutions are done and ready to meet launch demand.
Likewise, AMD’s Radeon HD 4870s in any quantity—1, 2, and 4—perform even better when we shift from Core 2 to Core i7. First, the CPU score goes up. We’d suspect this to be a result of threading enhancements in the metric. Secondly, the GPU scores increase. Not likely a result of drivers, this probably has more to do with Intel’s platform architecture. Finally, the overall score goes up in response to the other two benchmark results demonstrating great performance.
Get Tom's Hardware's best news and in-depth reviews, straight to your inbox.
Current page: Benchmark Results: 3DMark Vantage
Prev Page Benchmark Results Far Cry 2 Next Page Averaging It All Out-
DFGum Yep, i hafta say being able to switch brands of graphics cards on a whim and selling off the old is great. Knowing im going to be getting the preformance these cards are capable of (better price to preformance ratio) is nice also.Reply -
cangelini randomizerSLI scales so nicely on X58.Reply
Hey you even got a "First" in there Randomizer! -
randomizer cangeliniHey you even got a "First" in there Randomizer!And modest old me didn't even mention it. :lol:Reply -
enewmen Still waiting for the 4870 X2s to be used in these bechmarks. I thought THG got a couple for the $4500 exteme system. But still happy to see articles like this so early!Reply -
cangelini enewmenStill waiting for the 4870 X2s to be used in these bechmarks. I thought THG got a couple for the $4500 exteme system. But still happy to see articles like this so early!Reply
Go check out the benchmark pages man! Every one with 1, 2, 4 4870s. The 2x and 4x configs are achieved with X2s, too.
Oh, and latest drivers all around, too. Crazy, I know! =) -
enewmen cangeliniI found it, just read the article too quickly. - My bad.Reply
"A single Radeon HD 4870 X2—representing our 2 x Radeon HD 4870 scores—is similarly capable of scaling fan speed on its own. "
Hope to see driver updates like you said. -
spyde Hi there, my question regarding these benchmarks with the HD card is, "was a 2G card use or a 1G". I am about to buy a new system and was looking to buy 2 x HD4870X2 2G cards, but with these results its looking a bit ify. I hope you can answer my question.Reply
Cheers. -
Proximon That's a nice article. I especially like the way the graphs are done. everything is scaled right, and you get an accurate representation.Reply
