Corsair Force MP510 SSD Review: A Force to Be Reckoned With
Why you can trust Tom's Hardware
960GB Performance Results
Comparison Products
In today’s test pool we have included the Plextor M9Pe, Adata XPG Gammix S11, WD Black, and Samsung 970 EVO for comparison against the Force MP510. Additionally, we added the Intel 660p, the cheapest NVMe SSD in the market and a Crucial MX500 to show the performance difference if you step up from SATA to NVMe.
Trace Testing – PCMark 8 Storage Test 2.0
PCMark 8 is a trace-based benchmark that utilizes Microsoft Office, Adobe Creative Suite, World of Warcraft and Battlefield 3 to expose the performance differences between storage devices in real-world scenarios.
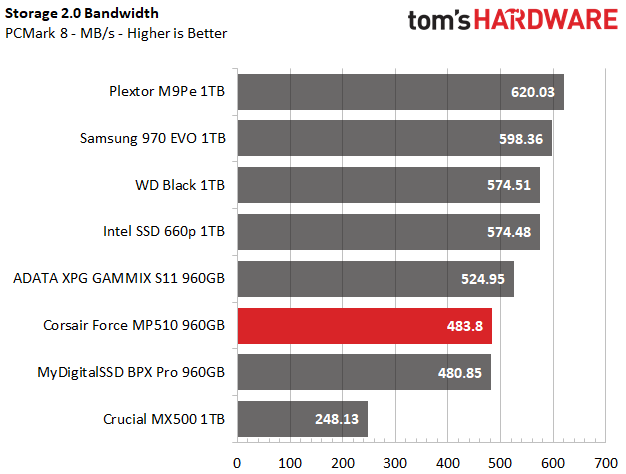
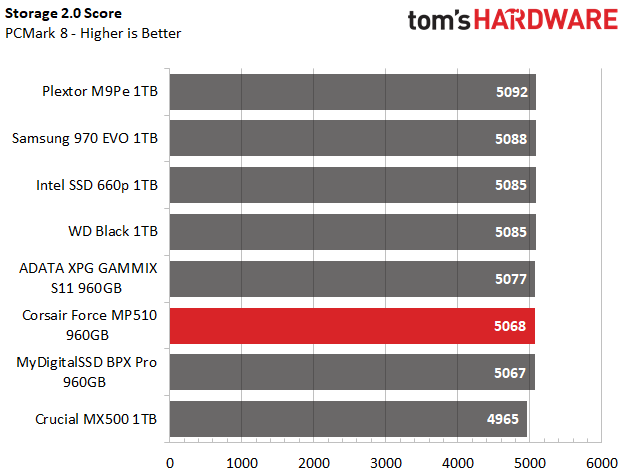
Corsair’s Force 510 scored nearly identically to the MyDigitalSSD’s BPX Pro in PCMark 8. With a score of 5068 points and an average bandwidth of 483MB/s. However, this ranks the MP510 third to last.
Game Scene Loading - Final Fantasy XIV
The Final Fantasy XIV StormBlood benchmark is a free to use, real-world game benchmark that enables us to easily and accurately compare game scene load times of storage devices without the use of a stopwatch.
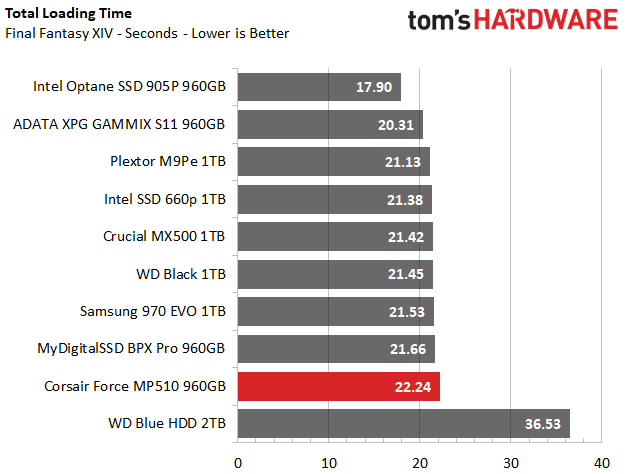
The total load time results are fairly fast for all the drives in the test pool, with most averaging about 21 seconds. The Corsair Force MP510, however, breaks out of this average and had a total load time of 22 seconds, landing in last place. It did still beat the HDD we’ve included, however, by about 14 seconds, or a result that is 33% faster.
Transfer Rates – DiskBench
Developed by Nodesoft, DiskBench is a storage benchmarking tool that allows us to test the copy performance of a storage device with our own 31,227-file, 50GB data set. After we do a copy test, we follow up with a read test of a 6GB file within the folder.
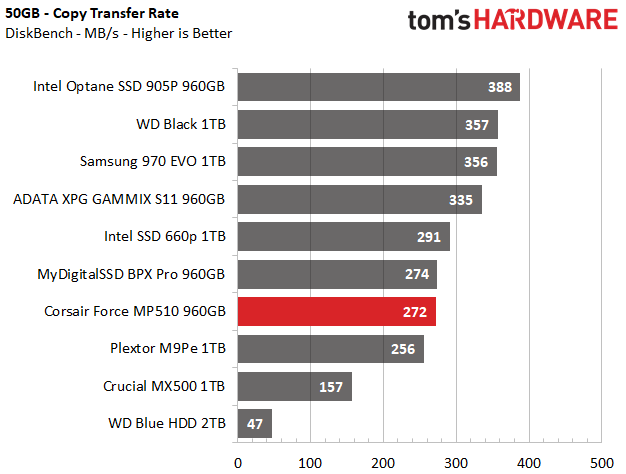
While copying the 50GB file folder, Corsair’s MP510 averaged 272MB/s. This gave it a slight lead over the M9Pe, and it absolutely smashes the SATA based Crucial MX500 score, but it is slower than the BPX Pro here, which outperformed it ever so slightly, by 2MB/s.
Get Tom's Hardware's best news and in-depth reviews, straight to your inbox.
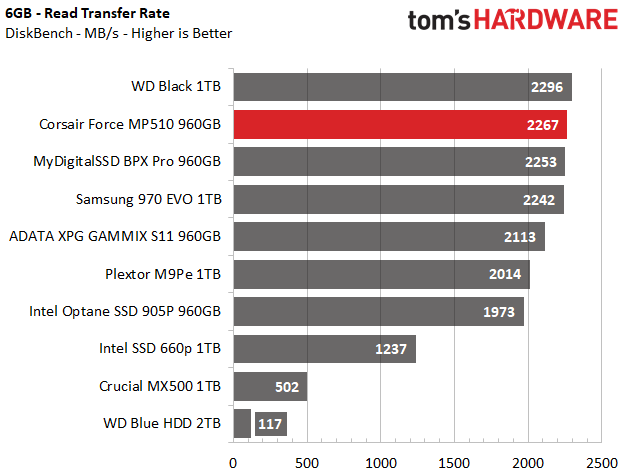
During the 6GB read test, the MP510 read the test file at over 2.2GB/s, which is faster than most of our comparison pool, second only to the WD Black.
SYSmark 2014 SE
Like PCMark, SYSmark uses real applications to measure system performance. SYSmark takes things much further, however. It utilizes fourteen different applications to run real user workloads with real data sets to measure how overall system performance impacts user experience, including how responsive the system is. It also gives us the opportunity to compare the software installation time on different storage devices, as the installation consists of over 18GB of applications.
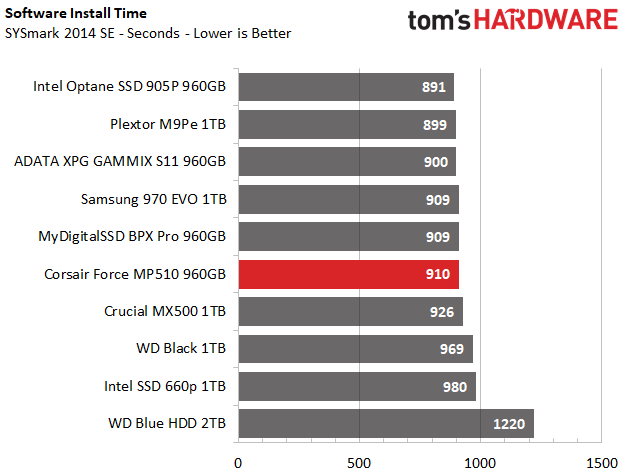
Like the MyDigitalSSD BPX Pro, Corsairs Force MP510 installed SYSmark 2014 SE in a bit over 15 minutes and was faster than the Crucial MX500. It ranked 6th overall.
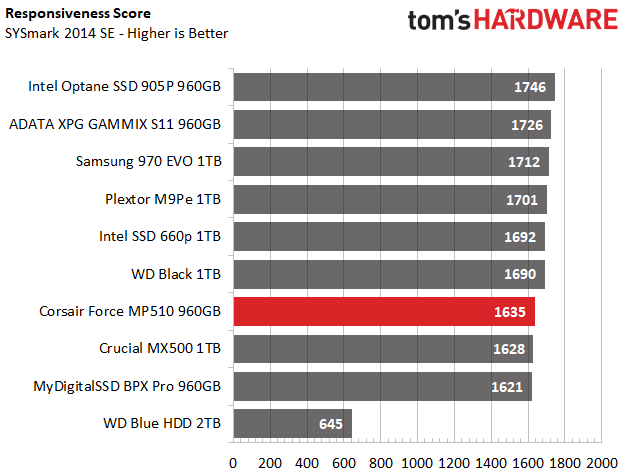
When we ran SYSmark, the MP510 scored 1635 points, which placed it ahead of the BPX Pro, but left a gap in performance between it and the other drives in the test pool. Here, the WD black took back 6th place and left the MP510 in 7th place overall.
ATTO
ATTO is a popular storage benchmarking suite. It is often used by manufacturers to establish a storage device’s rated sequential performance and gives us insight into how fast the device can read and write different sized files.
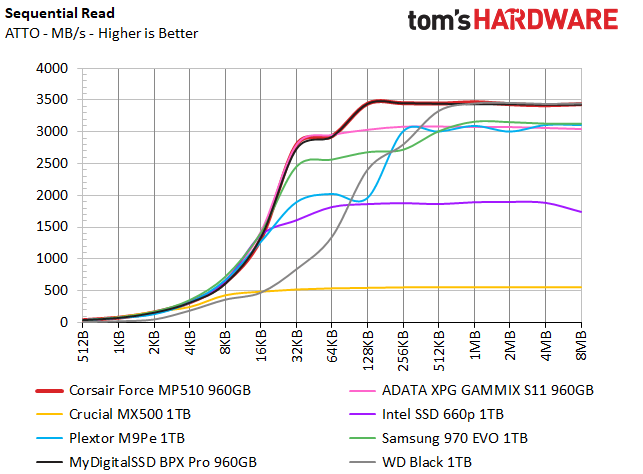
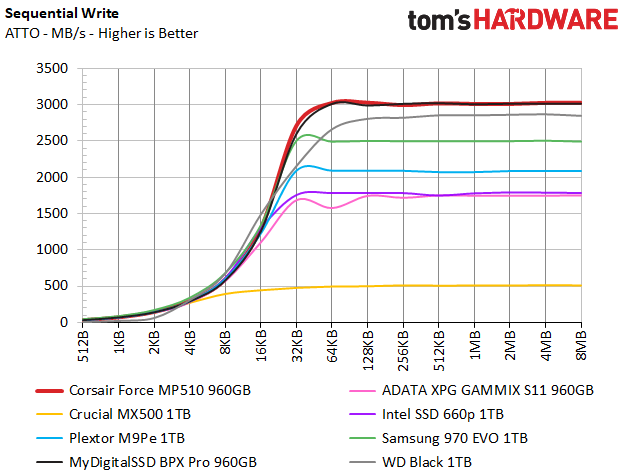
With speeds of 3.5/3.0GB/s read/write, both the Phison E12 powered drives, the BPX Pro and MP510, delivered the highest sequential performance out of all the drives in our test pool.
Anvil's Storage Utilities
Anvil Storage Utilities is an easy-to-use benchmark built on Iometer. In contrast to Iometer, ASU’s intuitive GUI lets anyone quickly benchmark their storage device without frustration.
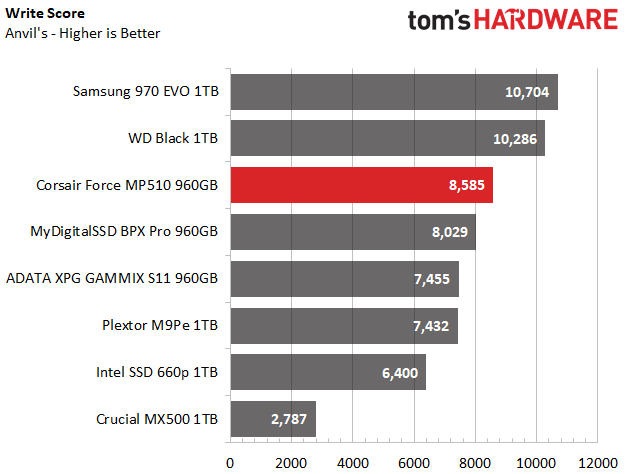
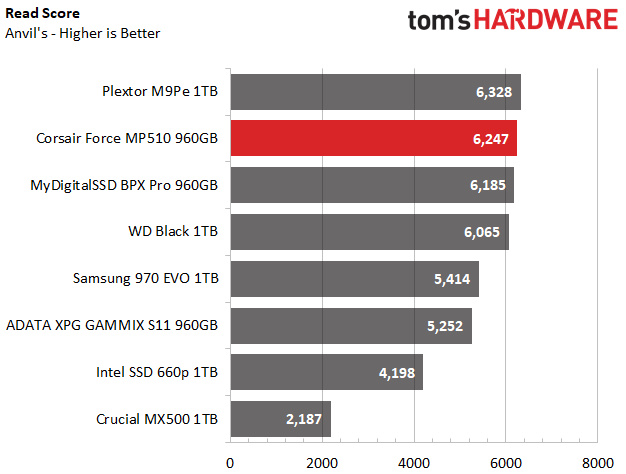
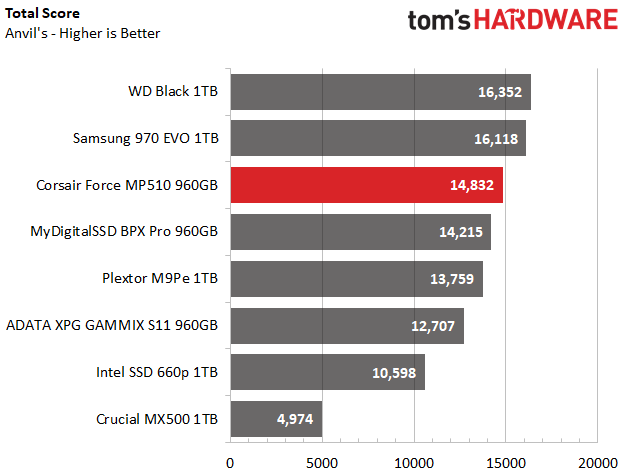
In Anvil, the MP510 came in second place in read performance, third in write performance, and third overall. These scores are all three times greater than the SATA-based Crucial MX500 and rank the MP510 just above the BPX Pro. Both the WD Black and Samsung 970 EVO outperform the MP510 here.
CrystalDiskMark
CDM is a simple and intuitive file size benchmarking tool. Anyone can download it and get easy-to-read performance numbers out of any drive.
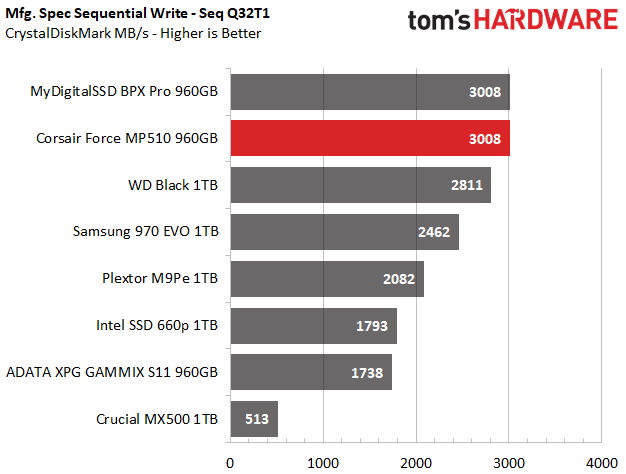
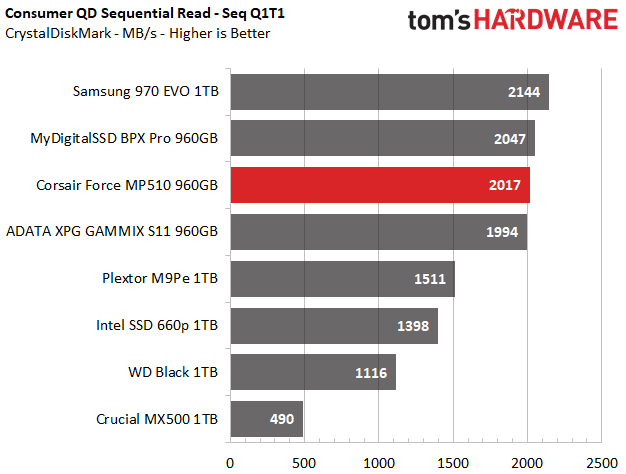
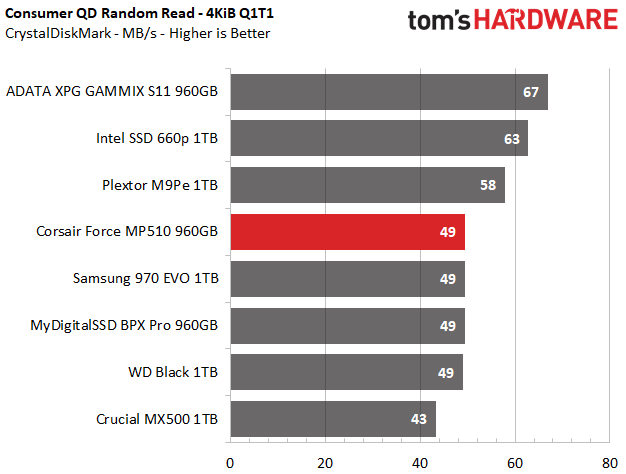
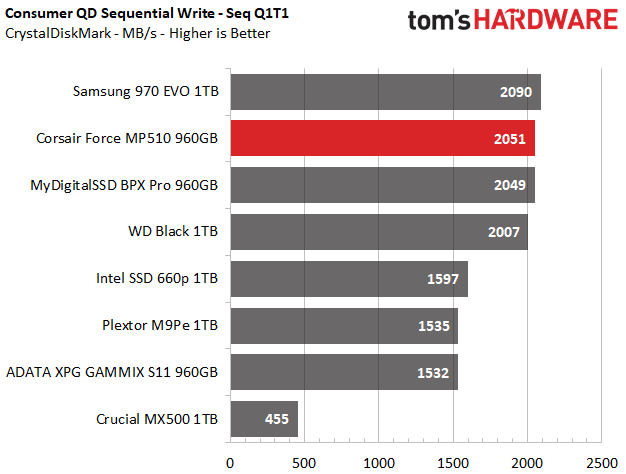
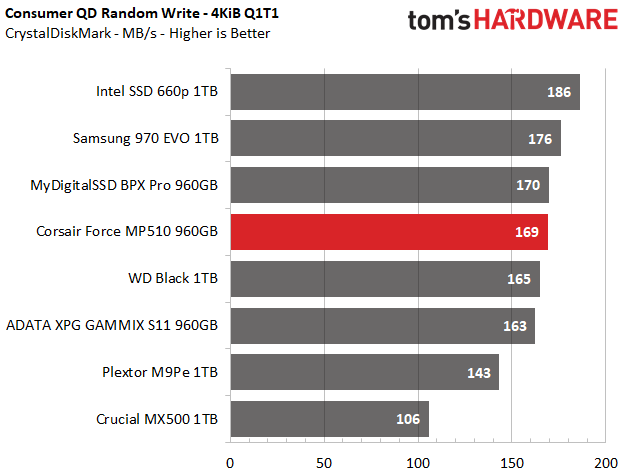
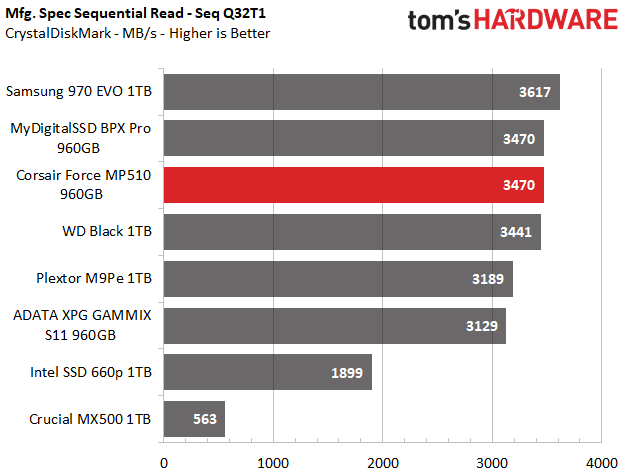
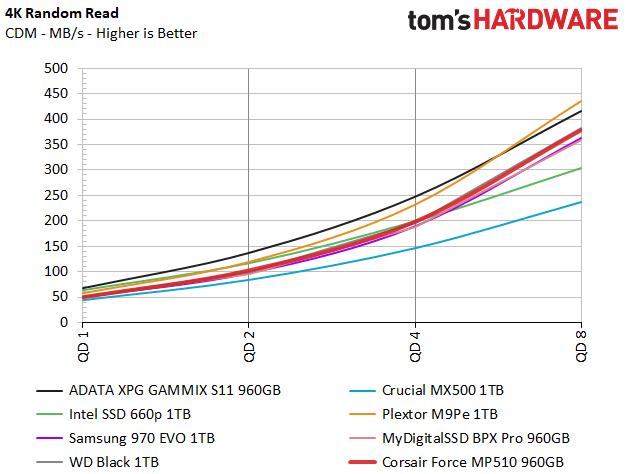
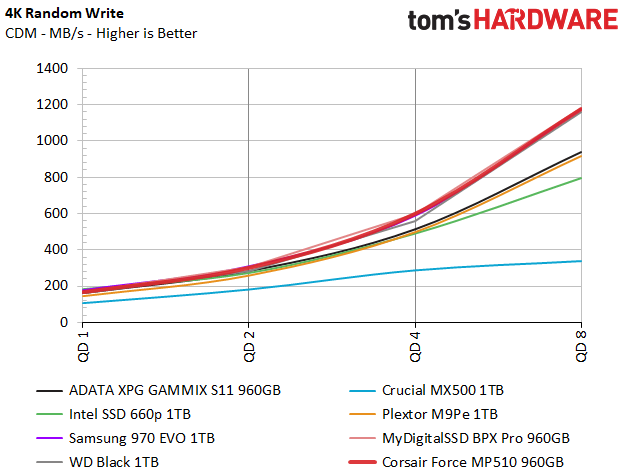
Corsair’s Force MP510 nearly matches the BPX Pro in Crystal Disk Mark. It tied for second place in sequential reads and landed in first place in sequential writes at QD32. When backing down to QD1, it ranked third, just behind the BPX Pro and Samsung 970 EVO, but then again came in second during sequential writes.
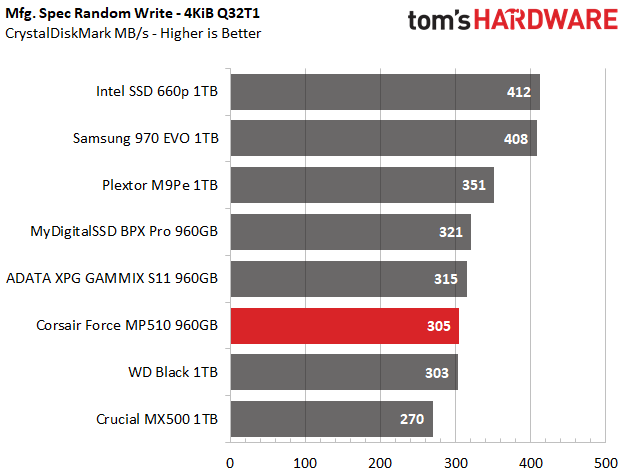
Random performance of 50/169MB/s nearly matches the BPX Pro again, but the MP510 ranked 4th in performance overall. From QD1-8, the MP510 delivers respectable results. It has pool-leading write performance, but read performance is just average.
Sustained Sequential Write Performance
Rated write speeds are only part of the picture when it comes to an SSD’s performance. Because most manufacturers are now implementing an SLC cache buffer, or in other words, a way to program TLC or QLC NAND as SLC over a specific region of the flash, sustained write speeds can differ dramatically from their rated specs after we write as little as 6GB to the device. Here we hammer the SSDs with sequential writes for 15 minutes to measure the SLC buffer size and direct-to-die performance once it fills.
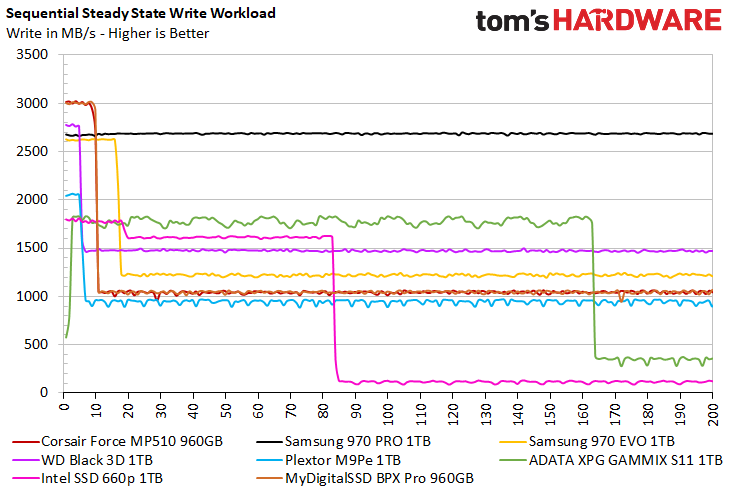
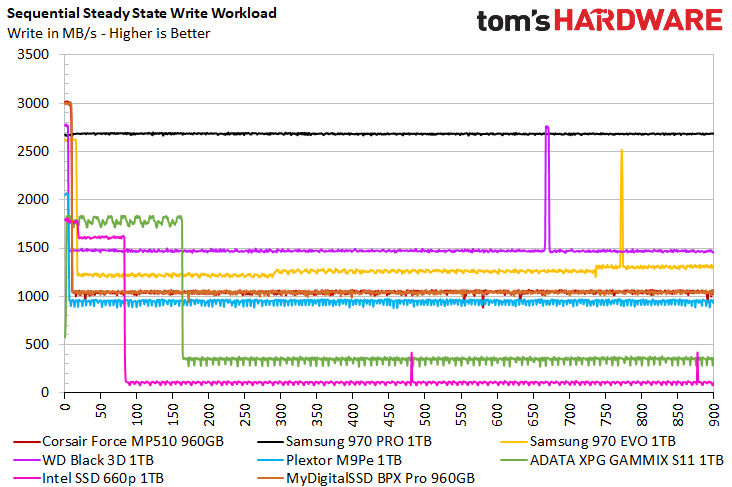
The Corsair Force MP510 utilizes a write cache buffer to improve write performance, just like most of the current SSDs in the market. When writing data to the drive, the MP510 writes at up to 3GB/s, but once the write cache fills after about 30GB of data, performance degrades to an average of 1050MB/s, which is still twice the bandwidth of SATA drive.
Power Consumption
Power consumption is an important aspect to consider when determining which drive is better suited for your needs--particularly if you’re a laptop user. With the help of a Quarch HD Programmable Power Module, we can gain a deeper understanding of a storage device’s power characteristics.
Idle power consumption is a very important aspect to consider, especially when looking for a new drive for your laptop. Some SSDs can consume watts of power at idle while better-suited one’s sip just milliwatts. Average workload consumption and max consumption are also two other aspects to consider. To consume less power is obviously better than more, but we can also take these metrics and compare throughput per watt. While a drive might not seem that efficient during a task, it could make up for it by completing the task quicker.
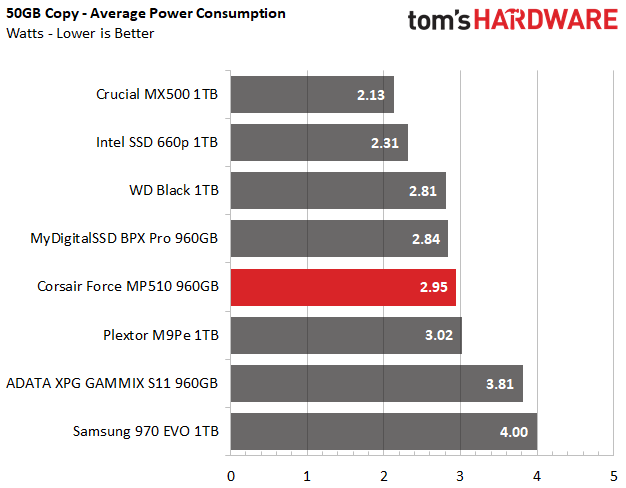
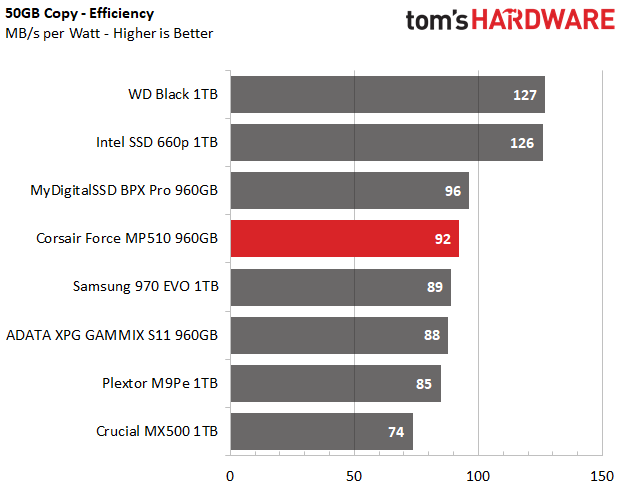
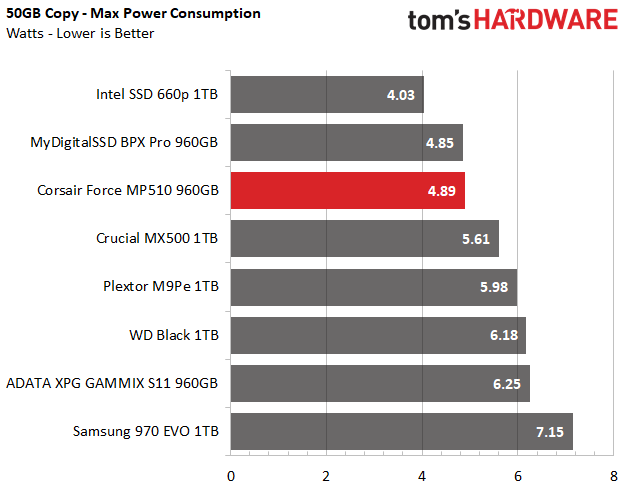
When it comes to power, the MP510 has a similar power consumption characteristic as the BPX Pro. With an average of 2.95W consumed during the 50GB file copy test, the MP510 consumes very little power compared to the Samsung 970 EVO and ADATA S11. In terms of efficiency, the MP510 attained 92MB/s per watt, landing it in fourth place just behind the BPX Pro. Max power consumption is also well regulated. We measured a peak of 4.89W, which is below the active read and write ratings from Corsair.
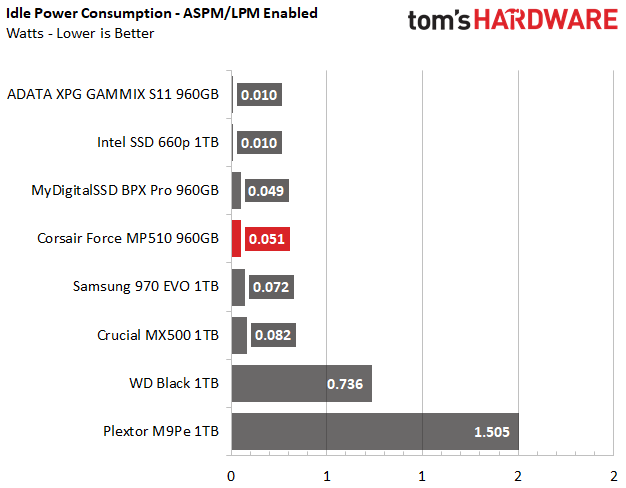
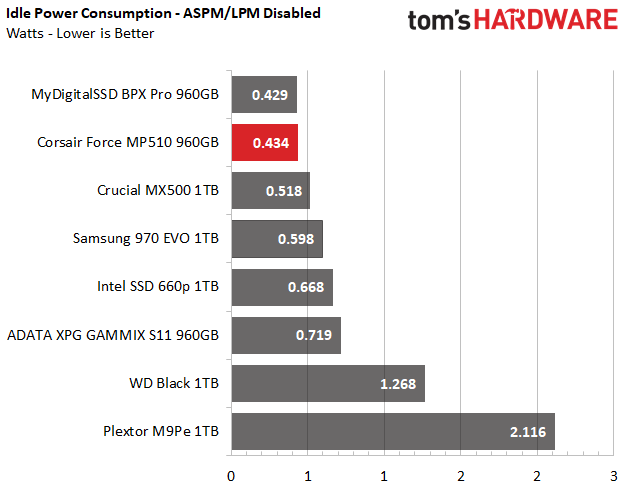
The MP510 consumes 0.434W at idle with ASPM disabled, placing it second to the BPX Pro. While it is rated at 30mW from Corsair, we measured 51mW at idle when we enabled ASPM with our Quarch HD power module.
MORE: Best SSDs
MORE: How We Test HDDs And SSDs
MORE: All SSD Content
Current page: 960GB Performance Results
Prev Page The Force is strong with this one Next Page Conclusion
Sean is a Contributing Editor at Tom’s Hardware US, covering storage hardware.
-
enzoozzytiger Are you sure you get the correct numbers? You list random read at 610,000 IOPS (QD1). Is this for 512 or 4K? Even if it's for 512, it will be the fastest NAND SSD. If it's for 4K, then it even blow the fastest Optane out of the water.Reply -
DogHam Sean gives the the MP510 a 4/5, but in my google search results, it shows 4/10 with 2/5 stars filled in. Is there a way for Tom's Hardware to address that? It's a pretty major difference.Reply -
Hupiscratch Those Samsung 970's steady state workload tests are quite different from that ssd review. Finally the drivers caught up?Reply -
islandwalker @DOGHAM we are aware of this and are trying to address, but it's a development issue, not something editorial can control.Reply -
jimmysmitty Reply21407990 said:Sean gives the the MP510 a 4/5, but in my google search results, it shows 4/10 with 2/5 stars filled in. Is there a way for Tom's Hardware to address that? It's a pretty major difference.
I think its either an issue with how Google is pulling the review or the way TH presents it as even Guru3D gave it a pretty stellar score.


