Corsair RM650x PSU Review
Another Corsair PSU is in the lab, commanding our attention. We already reviewed the RM750x and RM550x, so we couldn't leave out the RM650x. It promises the same high performance as its siblings, along with super quiet operation.
Why you can trust Tom's Hardware
Cross-Load Tests And Infrared Images
Our cross-load tests are described in detail here.
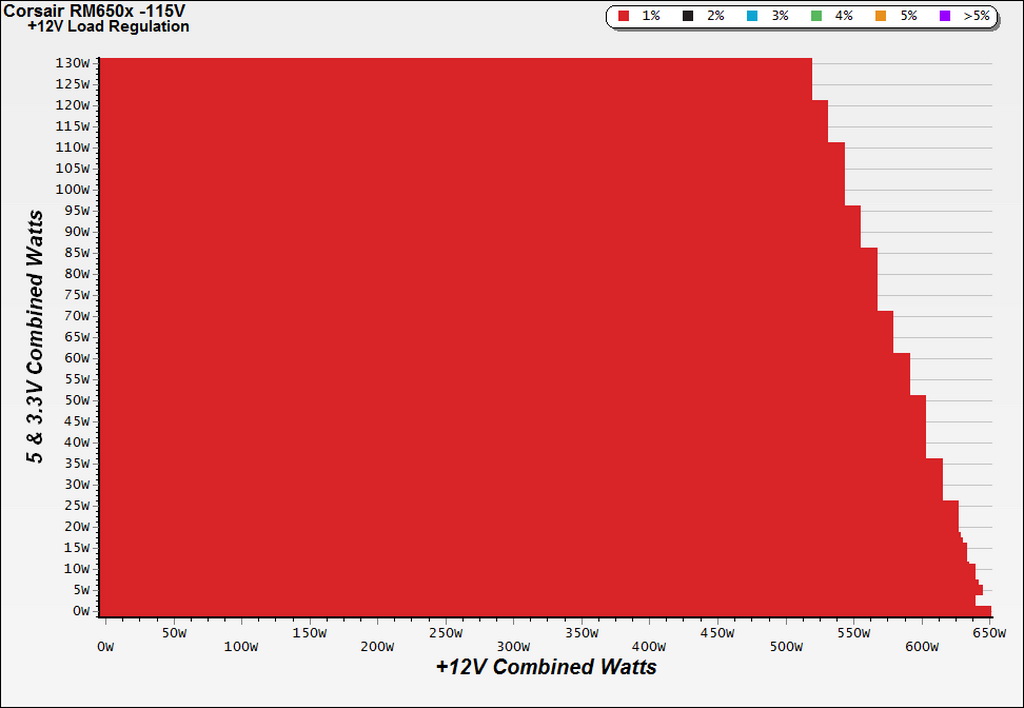
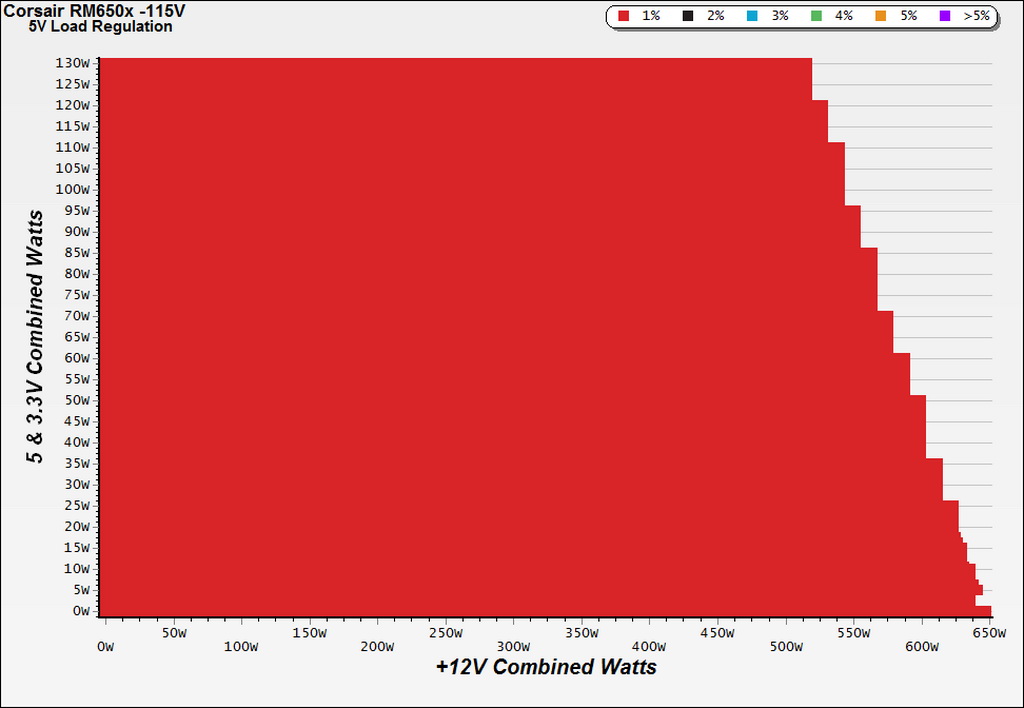
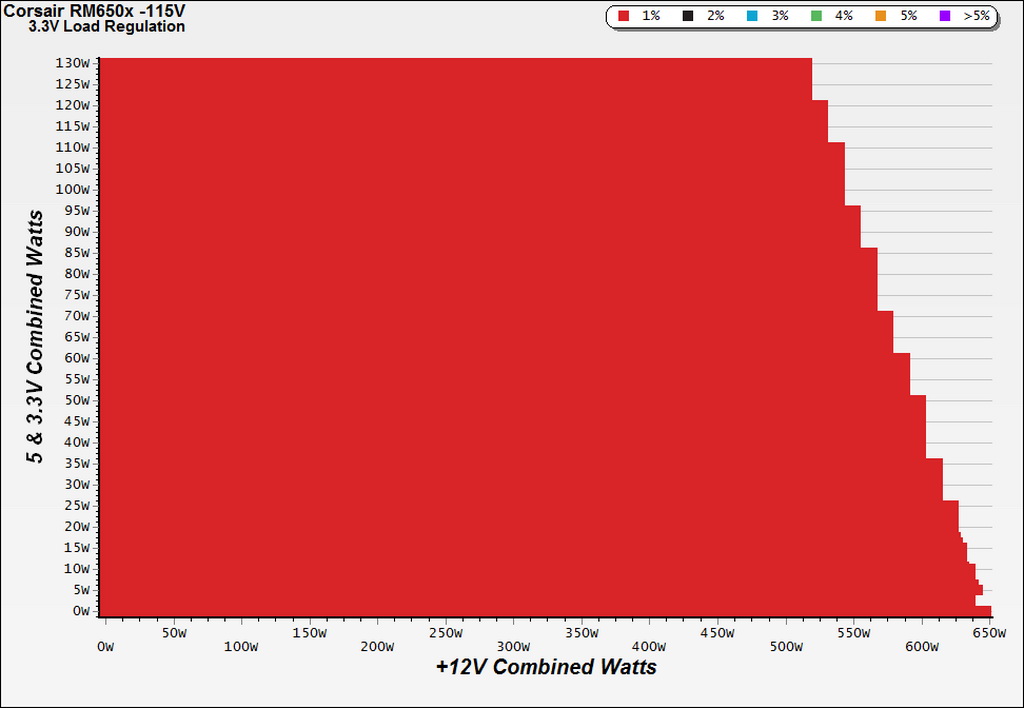
To generate the following charts, we set our loaders to auto mode through our custom-made software before trying more than 25,000 possible load combinations with the +12V, 5V and 3.3V rails. The load regulation deviations in each of the charts below were calculated by taking the nominal values of the rails (12V, 5V and 3.3V) as point zero.
Load Regulation Charts
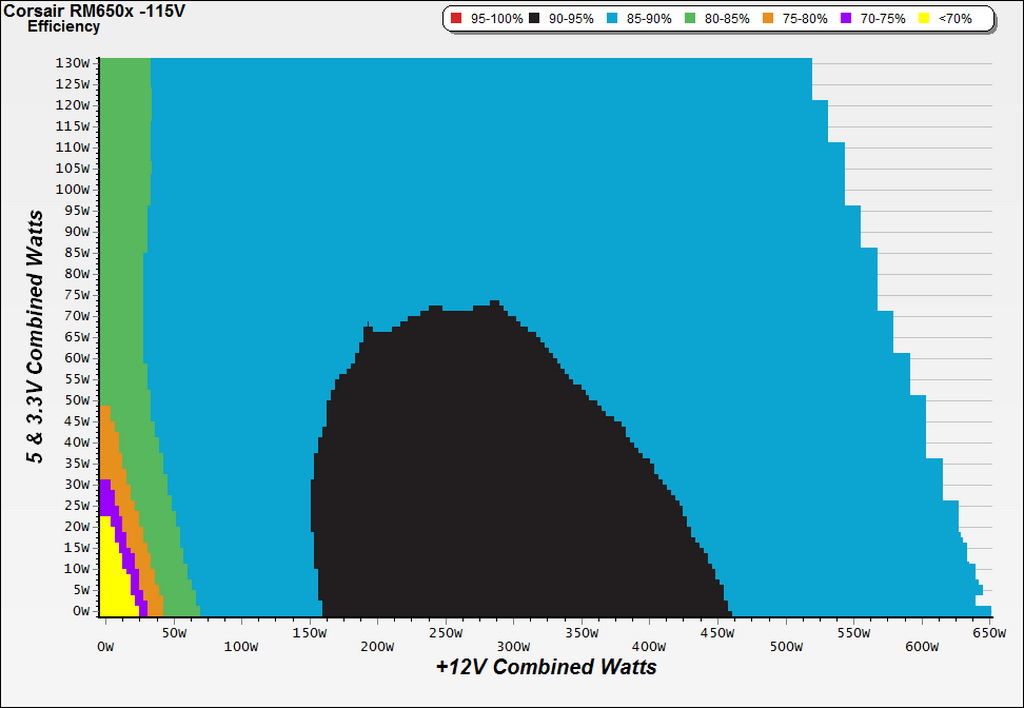
Efficiency Chart
The efficiency sweet spot is between 160W and 460W, with the load on the minor rails below 70W. If you need higher efficiency, then you should spend more money on a good Platinum- or Titanium-rated power supply.
Ripple Charts
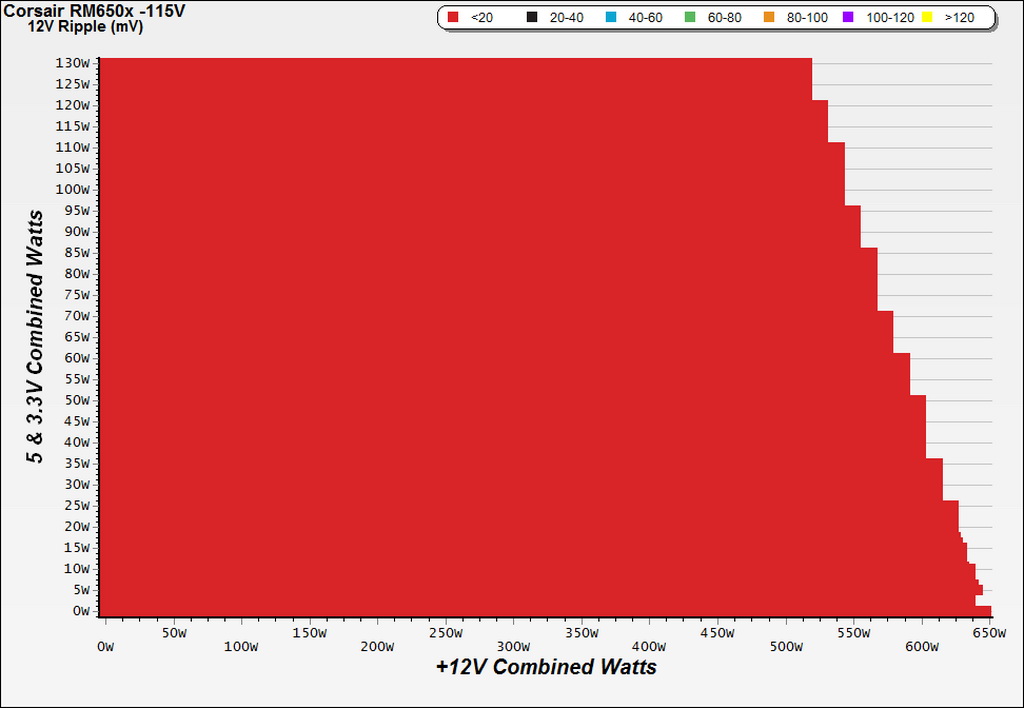
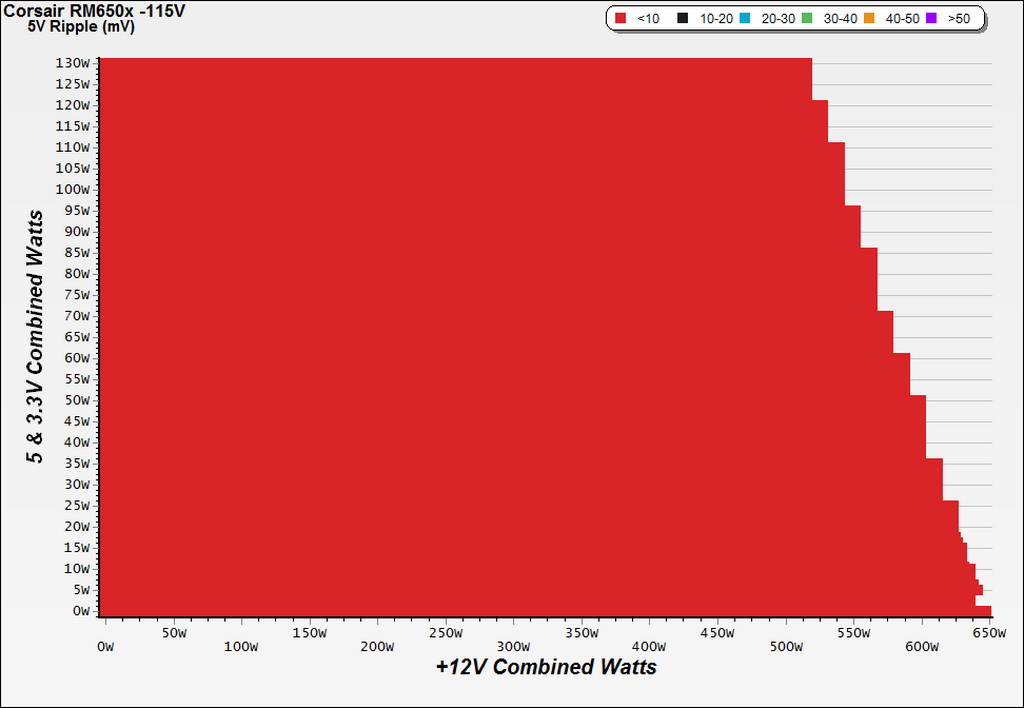
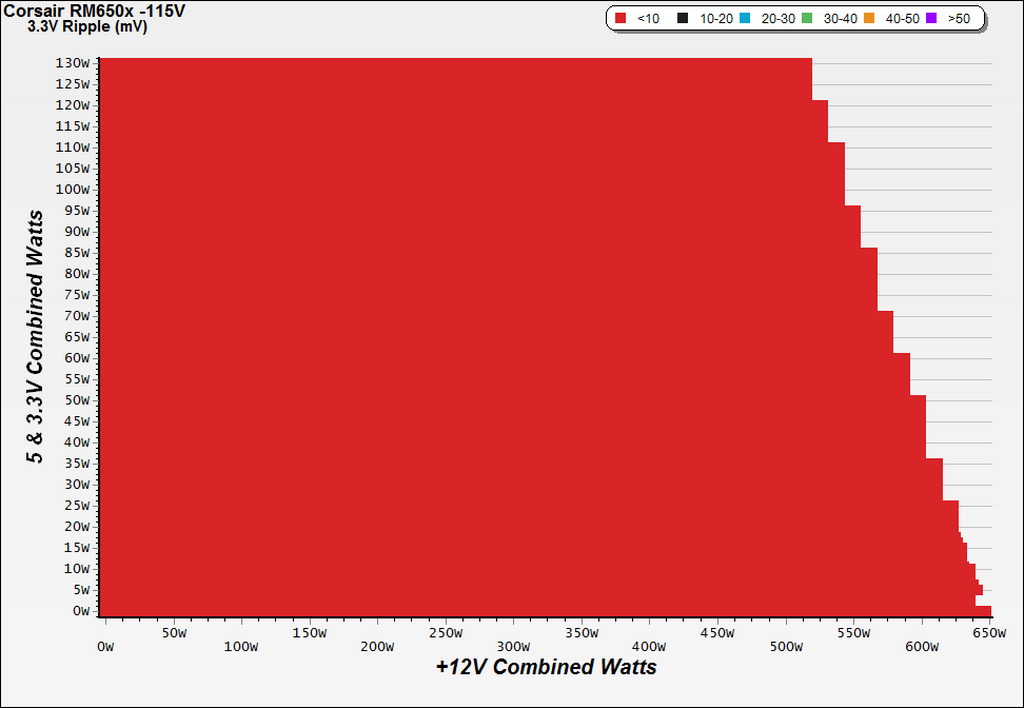
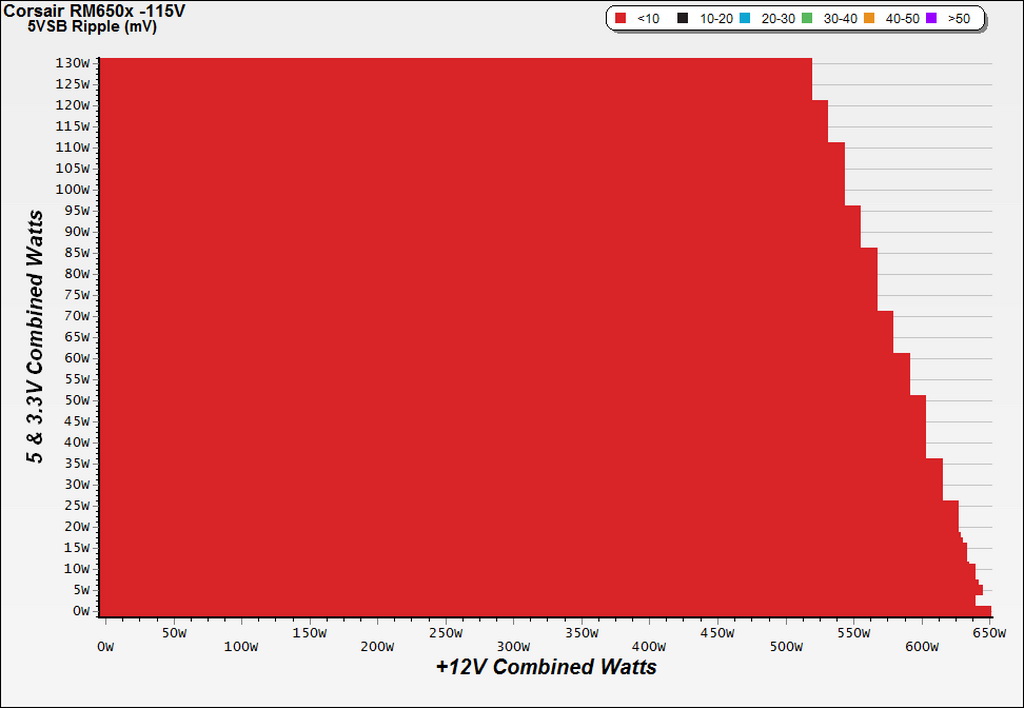
Infrared Images
Toward the end of the cross-load tests, we took some photos of the PSU with our modified FLIR E4 camera that delivers 320x240 IR resolution (76,800 pixels).
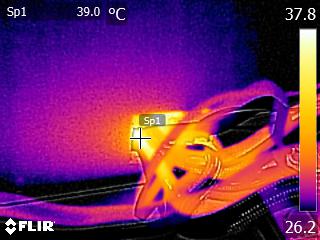
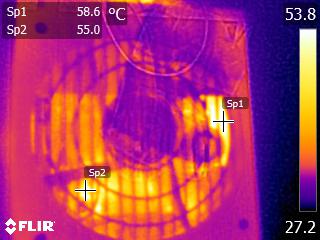
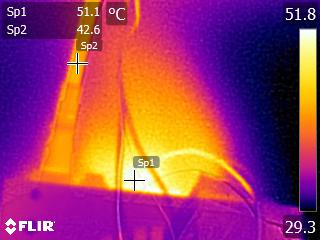
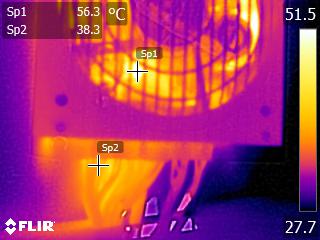
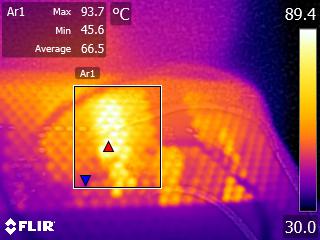
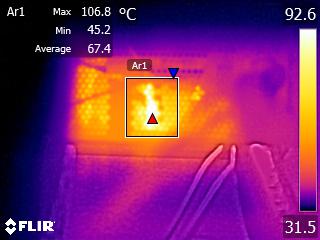
The internal temperatures are normal, despite the prolonged passive operation and low fan speed at moderate ambient temperatures, even under high loads. Only the bridge rectifier exceeds 100 °C during the end of our cross-load tests. According to its spec sheet, that component can provide 15A at 100 °C, given that it is mounted on a heat sink. At 125 °C, its amperage-handling capability drops to half (7.5A), which translates to 862.5W with 115V input or 825W with 110V. Considering the PSU's high OPP trigger point, and taking into account ambient temperatures of 35 °C or higher in some enclosures, Corsair should probably use an additional bridge rectifier in parallel with the current one, splitting the load between them.
Get Tom's Hardware's best news and in-depth reviews, straight to your inbox.
Current page: Cross-Load Tests And Infrared Images
Prev Page Evaluating Protection Features Next Page Transient Response Tests
Aris Mpitziopoulos is a contributing editor at Tom's Hardware, covering PSUs.
-
maxwellmelon for all the good listed in this article, this series of psu just gets bashed in the fourms, just interesting.Reply -
basroil Reply18305746 said:for all the good listed in this article, this series of psu just gets bashed in the fourms, just interesting.
You're thinking of the older RM650, different design.
The review here just made this unit be one of my recommended 650 models, tied with the EVGA G2/P2 and just below the Seasonic 660XP2! -
pjc6281 I have had this PSU for my new Skylake build for 2 months. Its GREAT, quiet and even have it pushing my old dinosaur Nvidia 590 with no problems. My old power supply was a Corsair AX1200 that was rock solid as well. Nothing but good experiences with them. I know others differ.Reply -
Dark Lord of Tech ReplyRMX doesn't get bashed , RMX and RMI are very very good. I own the RMX 850 , GREAT UNIT. -
TechyInAZ I'm glad the new RM series is much higher quality. All I remember Corsair having is a bunch of bad PSUs with select few good PSU (like AX and HX).Reply
I hope this same kind of quality intros into other models like the newly refreshed CX PSUs. -
Reply18305746 said:for all the good listed in this article, this series of psu just gets bashed in the fourms, just interesting.
Yeah, I believe you are confusing the RMx and RMi with the older, mostly discontinued RM line. And of the old RM line only the 750w and 850w versions that were first made by Chicony Power Technology had the bad reputation. Anyone bashing the RMx and RMi doesn't know what they are talking about. Once misinformation gets out there it's hard to get it corrected though.
Another great review Aris! :) -
Reply18308072 said:Why buy Corsair or EVGA when you can get a Seasonic?
Seasonic doesn't have a lock on quality. They also don't offer a 10 year warranty which both Corsair and EVGA do on some models. Just off the top of my head Flextronics, CWT and SuperFlower are all capable of making units that are at least equal to high end Seasonic quality. There are others as well. -
TechyInAZ Reply18308188 said:18308072 said:Why buy Corsair or EVGA when you can get a Seasonic?
Seasonic doesn't have a lock on quality. They also don't offer a 10 year warranty which both Corsair and EVGA do on some models. Just off the top of my head Flextronics, CWT and SuperFlower are all capable of making units that are at least equal to high end Seasonic quality. There are others as well.
Plus, efficiency levels are typically better with EVGA than Seasonic. -
Reply18308342 said:18308188 said:18308072 said:Why buy Corsair or EVGA when you can get a Seasonic?
Seasonic doesn't have a lock on quality. They also don't offer a 10 year warranty which both Corsair and EVGA do on some models. Just off the top of my head Flextronics, CWT and SuperFlower are all capable of making units that are at least equal to high end Seasonic quality. There are others as well.
Plus, efficiency levels are typically better with EVGA than Seasonic.
:??: Not sure what you mean. EVGA has a couple of 80 Plus Titanium models but Seasonic has Titanium models in their new lineup. I'm not sure if those new Seasonic models are available yet though. Other than that I've had an 80 Plus Platinum Seasonic ( 660XP2 ) for a couple of years and their Platinum line has been out since at least 2011.
