Cougar GX-F750W PSU Review
Why you can trust Tom's Hardware
Efficiency, Temperature & Noise
Efficiency
Our efficiency testing procedure is detailed here.
Using results from the previous page, we plotted a chart showing the GX-F750's efficiency at low loads, and loads from 10 to 110 percent of its maximum-rated capacity.
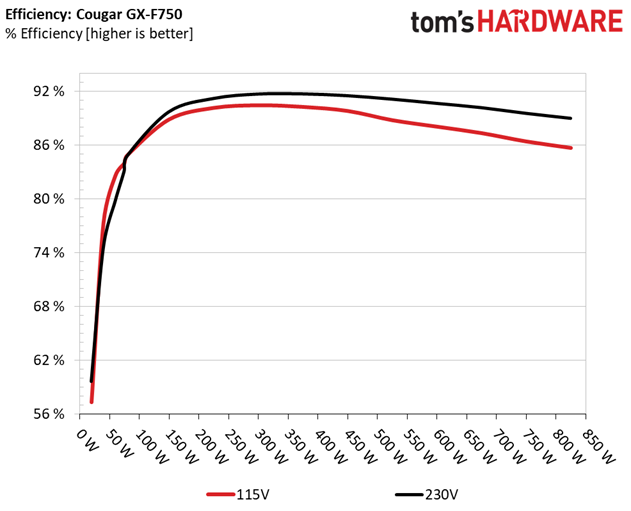
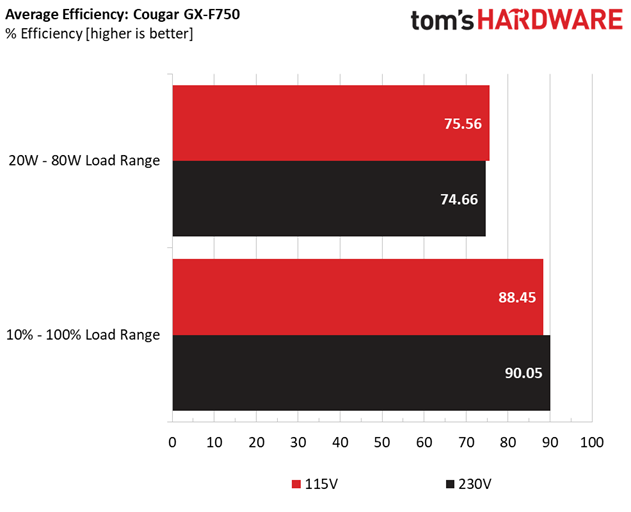
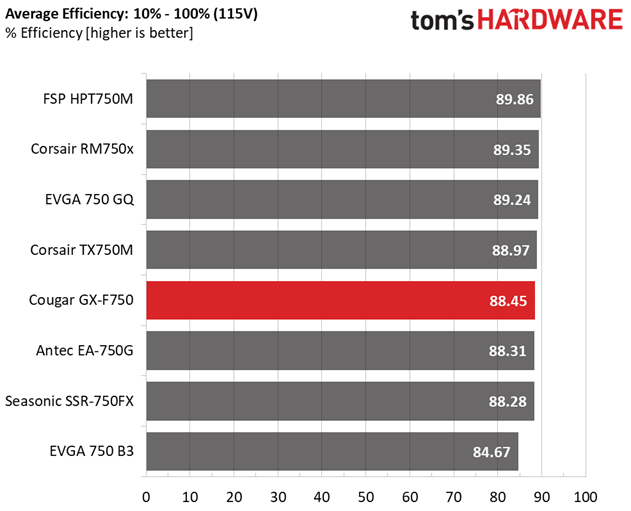
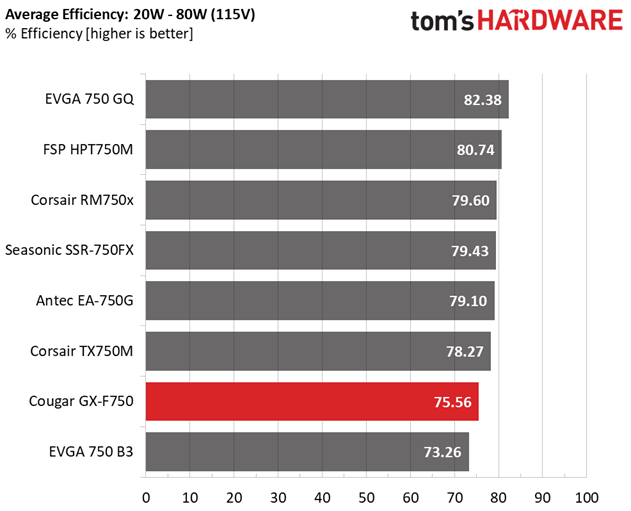
The unit's efficiency is close to this category's average under normal loads. Under light loads, it falls quite low.
Efficiency At Low Loads
In the following tests, we measure the GX-F750's efficiency at loads significantly lower than 10 percent of its maximum capacity (the lowest load the 80 PLUS standard measures). The loads we dialed were 20, 40, 60, and 80W. This is important for representing when a PC is idle, with power-saving features turned on.
| Test # | 12V | 5V | 3.3V | 5VSB | DC/AC (Watts) | Efficiency | Fan Speed | PSU Noise | PF/AC Volts |
|---|---|---|---|---|---|---|---|---|---|
| 1 | 1.195A | 0.501A | 0.477A | 0.196A | 19.723 | 57.321% | 735 RPM | 20.7 dB(A) | 0.918 |
| 12.242V | 4.989V | 3.339V | 5.114V | 34.408 | 115.07V | ||||
| 2 | 2.432A | 0.999A | 0.986A | 0.391A | 39.768 | 77.358% | 725 RPM | 20.2 dB(A) | 0.957 |
| 12.129V | 4.988V | 3.336V | 5.108V | 51.408 | 115.07V | ||||
| 3 | 3.667A | 1.496A | 1.497A | 5.100A | 59.868 | 82.640% | 750 RPM | 21.3 dB(A) | 0.975 |
| 12.117V | 4.986V | 3.335V | 5.100V | 72.444 | 115.07V | ||||
| 4 | 4.891A | 2.003A | 1.981A | 0.784A | 79.799 | 84.902% | 795 RPM | 22.8 dB(A) | 0.975 |
| 12.108V | 4.984V | 3.332V | 5.095V | 93.989 | 115.07V |
With 20W load, the GX-F750's efficiency is very low. At the other three load levels, its efficiency looks normal for an 80 PLUS Gold-rated PSU. Strangely, the first sample we tested (the one that broke during our overload test) achieved a notably higher efficiency level (64.546%) under 20W of load.
5VSB Efficiency
The ATX specification, along with CEC, ErP Lot 3 2014 and ErP Lot 6 2010/2013, states that 5VSB standby supply efficiency should be as high as possible, recommending 75 percent or higher with 550mA, 1A, and 1.5A of load. The PSU should also achieve higher than 75% efficiency at 5VSB under full load, or with 3A if its max current output on this rail is higher than 3A.
We take six measurements: one each at 100, 250, 550, 1000, and 1500mA, and one with the full load the 5VSB rail can handle.
Get Tom's Hardware's best news and in-depth reviews, straight to your inbox.
| Test # | 5VSB | DC/AC (Watts) | Efficiency | PF/AC Volts |
|---|---|---|---|---|
| 1 | 0.102A | 0.521 | 73.692% | 0.070 |
| 5.120V | 0.707 | 115.03V | ||
| 2 | 0.252A | 1.290 | 77.061% | 0.151 |
| 5.117V | 1.674 | 115.03V | ||
| 3 | 0.542A | 2.772 | 78.372% | 0.257 |
| 5.110V | 3.537 | 115.03V | ||
| 4 | 1.002A | 5.112 | 79.158% | 0.339 |
| 5.101V | 6.458 | 115.04V | ||
| 5 | 1.502A | 7.643 | 77.210% | 0.389 |
| 5.089V | 9.899 | 115.03V | ||
| 6 | 3.002A | 15.170 | 75.930% | 0.447 |
| 5.054V | 19.979 | 115.03V |
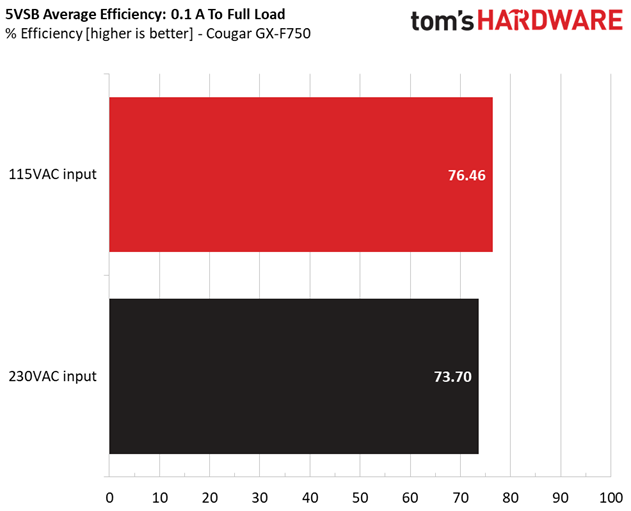
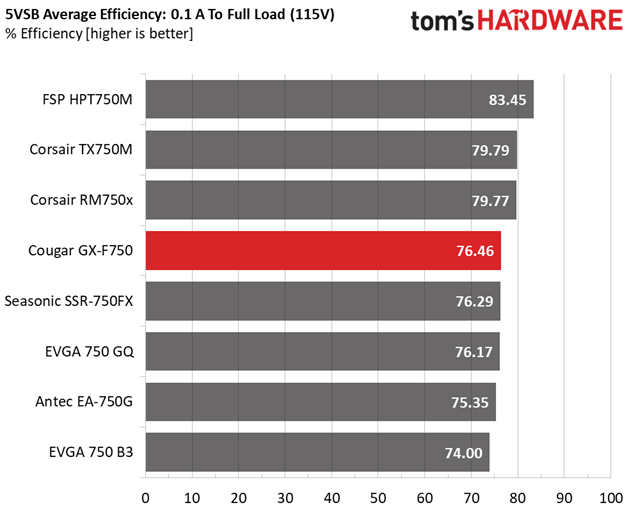
The 5VSB rail's efficiency is decent, but nowhere near as good as implementations from CWT and FSP.
Power Consumption In Idle And Standby
In the table below, you'll find the power consumption and voltage values of all rails (except -12V) when the PSU is idle (powered on, but without any load on its rails), and the power consumption when the PSU is in standby mode (without any load, at 5VSB).
| Mode | 12V | 5V | 3.3V | 5VSB | Watts | PF/AC Volts |
|---|---|---|---|---|---|---|
| Idle | 12.177V | 4.996V | 3.342V | 5.122V | 9.225 | 0.549 |
| 115.1V | ||||||
| Standby | 0.049 | 0.005 | ||||
| 115.1V |
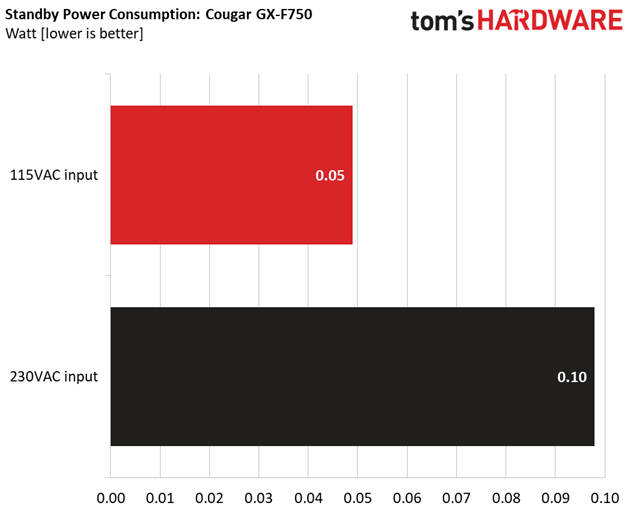
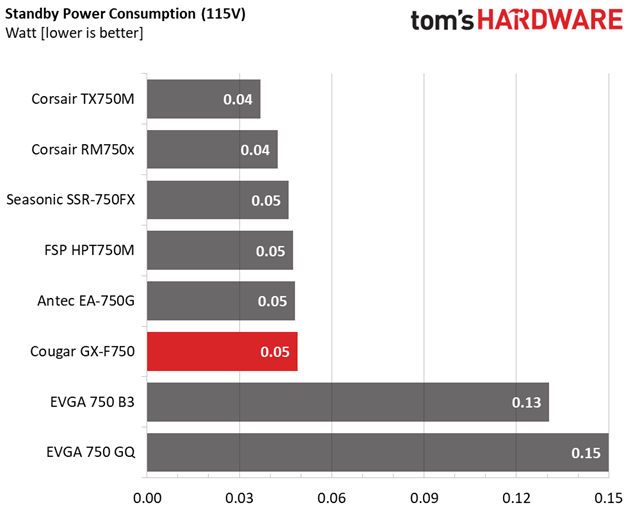
The vampire power that we measure with our analyzer is low under 115V and 230V inputs.
Fan RPM, Delta Temperature, And Output Noise
Our mixed noise testing is described in detail here.
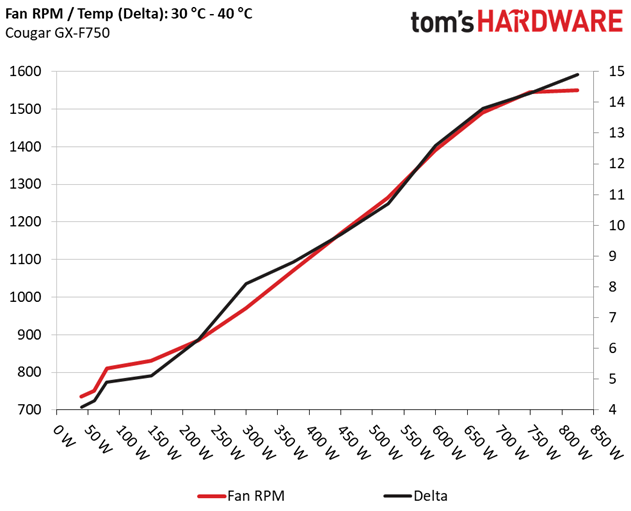
The first chart below illustrates the cooling fan's speed (in RPM), and the delta between input and output temperature. The results were obtained at 30°C (86°F) to 40°C (104°F) ambient temperature.
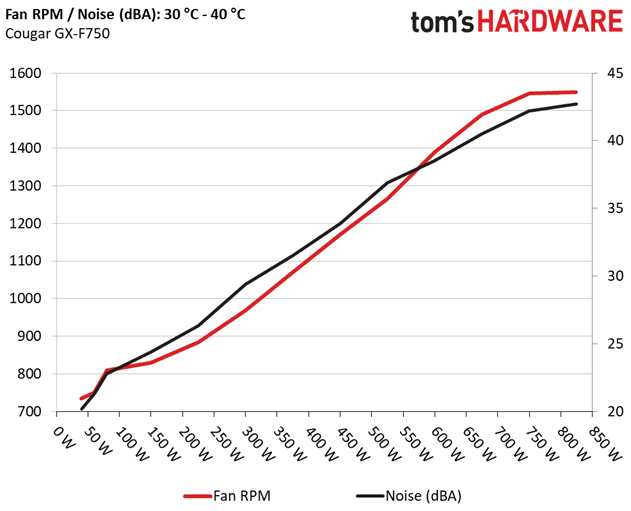
The next chart shows the cooling fan's speed (again, in RPM) and output noise. We measured acoustics from one meter away, inside a hemi-anechoic chamber. Background noise inside the chamber was below 6 dB(A) during testing (it's actually much lower, but our sound meter’s microphone hits its floor), and the results were obtained with the PSU operating at 30°C (86°F) to 40°C (104°F) ambient temperature.
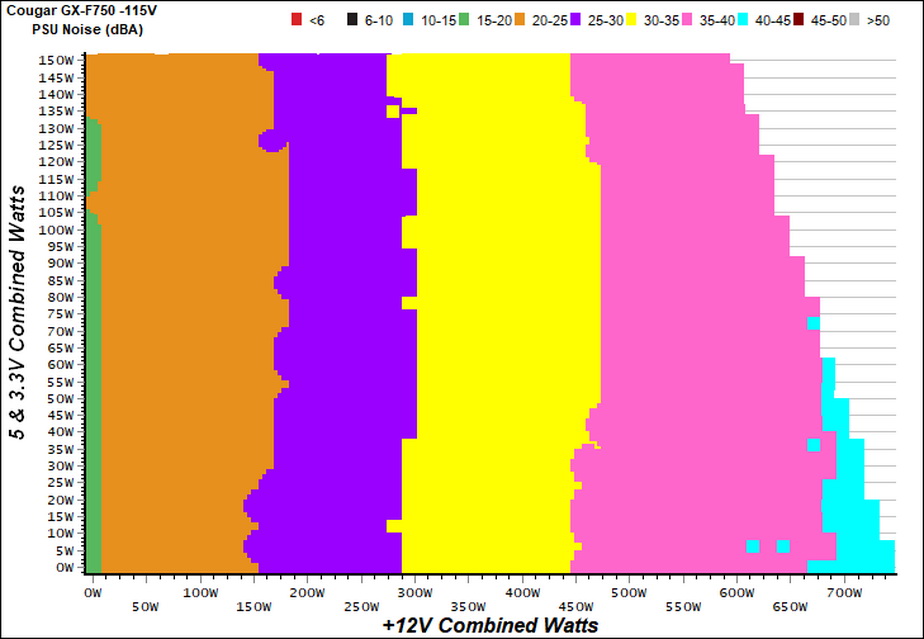
The following graph illustrates the fan's output noise over the PSU's operating range. The same conditions of the above graph apply to our measurements, though the ambient temperature was between 30°C (86°F) to 32°C (89.6°F).
Cougar's fan profile is clearly aggressive; from almost 10W of load, the PSU lands within the 25-30 dB(A) noise zone. But because of its low-speed fan, maximum noise barely exceeds 40 dB(A) with 660W and higher loads.
MORE: Best Power Supplies
MORE: How We Test Power Supplies
MORE: All Power Supply Content
Current page: Efficiency, Temperature & Noise
Prev Page Load Regulation, Hold-Up Time & Inrush Current Next Page Protection Features
Aris Mpitziopoulos is a contributing editor at Tom's Hardware, covering PSUs.
-
shrapnel_indie ReplyAll of Cougar's PSUs are made by HEC/Compucase, an OEM with many years of experience in this field.
HEC/Compucase, for at least the last decade hasn't been known to produce a single good unit. Cougar would do well to find a better OEM.
I'd love for HEC to have finally get a good platform though... AND never go back to less. -
bettsar Looking at the comparison products, are these numbers for the EVGA 750 G3 or the B3? If the everything is pointing to the G3 (including the cost), that definitely seems like the value leader. If the cost is pointing to the B3, then it could change the story quite a bit.Reply
However, I also see that the RM750x appears to have dropped in price, which would likely put it at the top of the value chart.
