Cougar GX-F750W PSU Review
Why you can trust Tom's Hardware
Transient Response Tests
Advanced Transient Response Tests
For details on our transient response testing, please click here.
Ιn these tests, we monitor the GX-F750's response in several scenarios. First, a transient load (10A at +12V, 5A at 5V, 5A at 3.3V, and 0.5A at 5VSB) is applied for 200ms as the PSU works at 20 percent load. In the second scenario, it's hit by the same transient load while operating at 50 percent load.
In the next sets of tests, we increase the transient load on the major rails with a new configuration: 15A at +12V, 6A at 5V, 6A at 3.3V, and 0.5A at 5VSB. We also increase the load-changing repetition rate from 5 Hz (200ms) to 50 Hz (20ms). Again, this runs with the PSU operating at 20 and 50 percent load.
The last tests are even tougher. Although we keep the same loads, the load-changing repetition rate rises to 1 kHz (1ms).
In all of the tests, we use an oscilloscope to measure the voltage drops caused by the transient load. The voltages should remain within the ATX specification's regulation limits.
These tests are crucial because they simulate the transient loads a PSU is likely to handle (such as booting a RAID array or an instant 100 percent load of CPU/GPUs). We call these "Advanced Transient Response Tests," and they are designed to be very tough to master, especially for a PSU with a capacity of less than 500W.
Advanced Transient Response at 20 Percent – 200ms
| Voltage | Before | After | Change | Pass/Fail |
|---|---|---|---|---|
| 12V | 12.089V | 12.004V | 0.70% | Pass |
| 5V | 4.976V | 4.855V | 2.43% | Pass |
| 3.3V | 3.325V | 3.218V | 3.22% | Pass |
| 5VSB | 5.082V | 5.018V | 1.26% | Pass |
Advanced Transient Response at 20 Percent – 20ms
| Voltage | Before | After | Change | Pass/Fail |
|---|---|---|---|---|
| 12V | 12.089V | 11.985V | 0.86% | Pass |
| 5V | 4.977V | 4.836V | 2.83% | Pass |
| 3.3V | 3.325V | 3.191V | 4.03% | Pass |
| 5VSB | 5.082V | 5.015V | 1.32% | Pass |
Advanced Transient Response at 20 Percent – 1ms
| Voltage | Before | After | Change | Pass/Fail |
|---|---|---|---|---|
| 12V | 12.089V | 11.990V | 0.82% | Pass |
| 5V | 4.977V | 4.840V | 2.75% | Pass |
| 3.3V | 3.325V | 3.199V | 3.79% | Pass |
| 5VSB | 5.082V | 5.034V | 0.94% | Pass |
Advanced Transient Response at 50 Percent – 200ms
| Voltage | Before | After | Change | Pass/Fail |
|---|---|---|---|---|
| 12V | 12.048V | 11.962V | 0.71% | Pass |
| 5V | 4.955V | 4.844V | 2.24% | Pass |
| 3.3V | 3.304V | 3.189V | 3.48% | Pass |
| 5VSB | 5.050V | 4.985V | 1.29% | Pass |
Advanced Transient Response at 50 Percent – 20ms
| Voltage | Before | After | Change | Pass/Fail |
|---|---|---|---|---|
| 12V | 12.048V | 11.948V | 0.83% | Pass |
| 5V | 4.955V | 4.822V | 2.68% | Pass |
| 3.3V | 3.304V | 3.169V | 4.09% | Pass |
| 5VSB | 5.050V | 4.989V | 1.21% | Pass |
Advanced Transient Response at 50 Percent – 1ms
| Voltage | Before | After | Change | Pass/Fail |
|---|---|---|---|---|
| 12V | 12.048V | 11.927V | 1.00% | Pass |
| 5V | 4.955V | 4.825V | 2.62% | Pass |
| 3.3V | 3.304V | 3.184V | 3.63% | Pass |
| 5VSB | 5.050V | 5.004V | 0.91% | Pass |
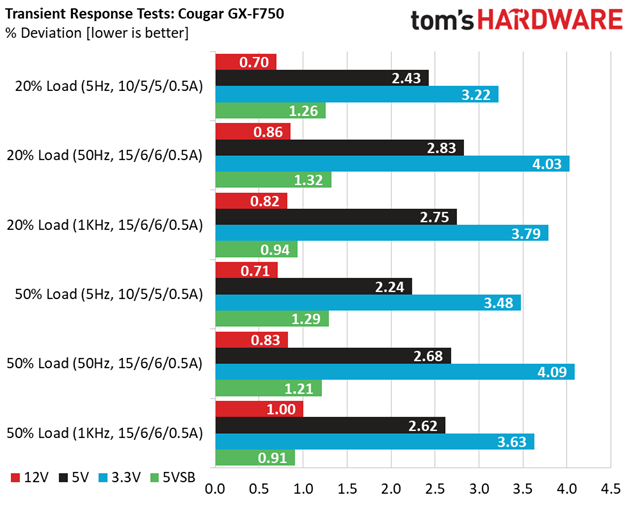
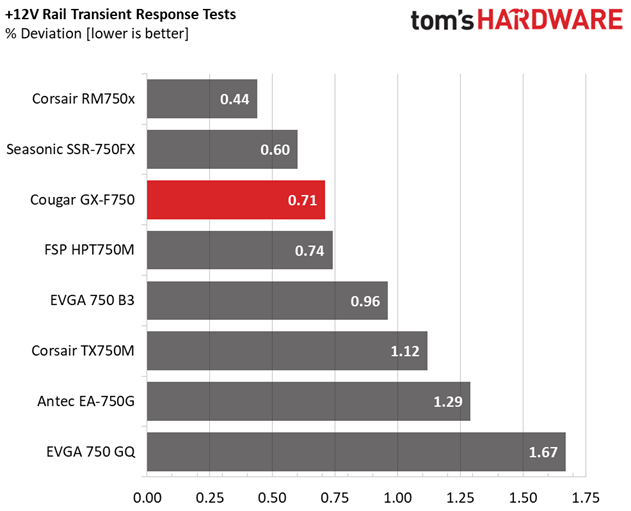
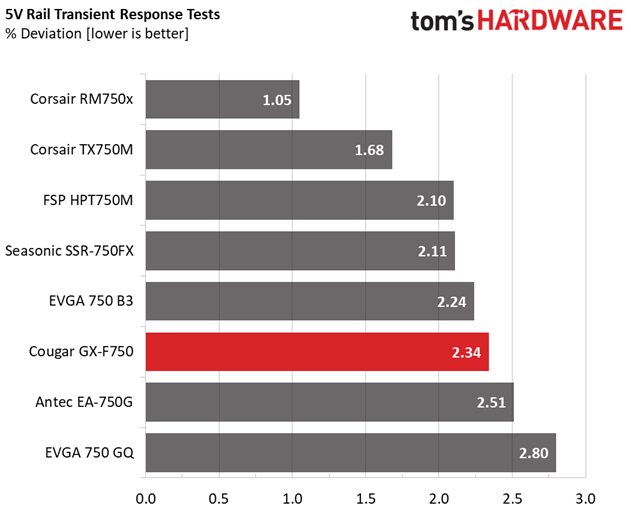
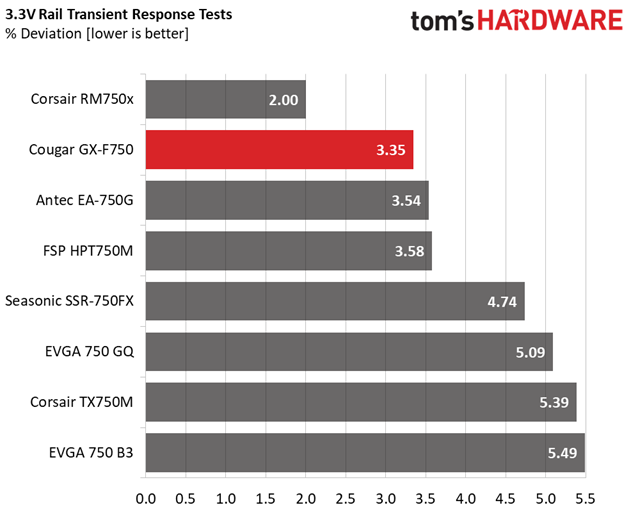
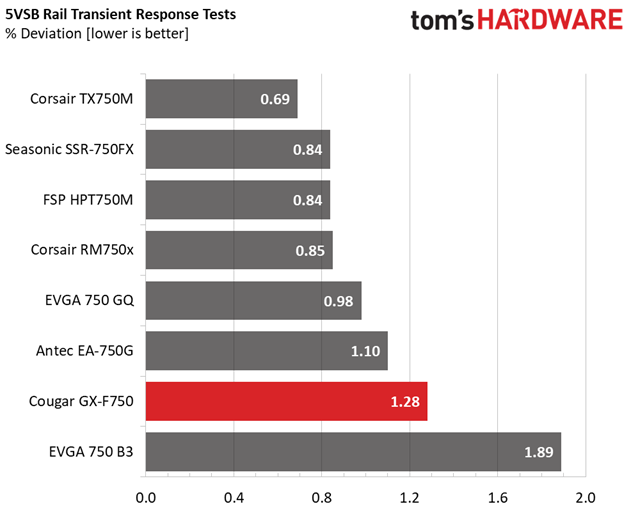
The +12V rail's transient response is pretty good. Moreover, the minor rails offer better response than competing similar-capacity PSUs. We just don't like the 3.3V rail's drop below 3.2V in most of our tests.
Get Tom's Hardware's best news and in-depth reviews, straight to your inbox.
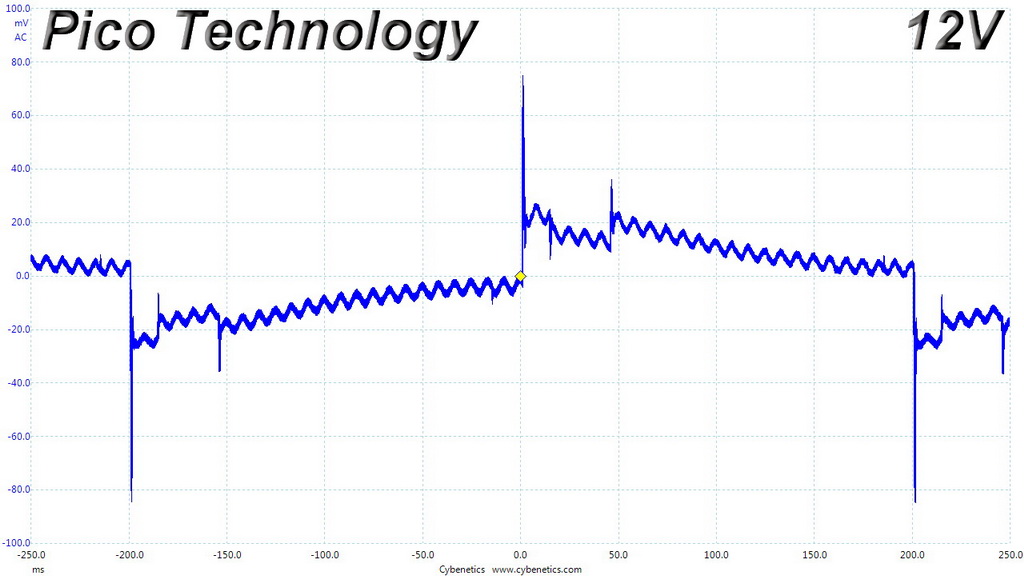
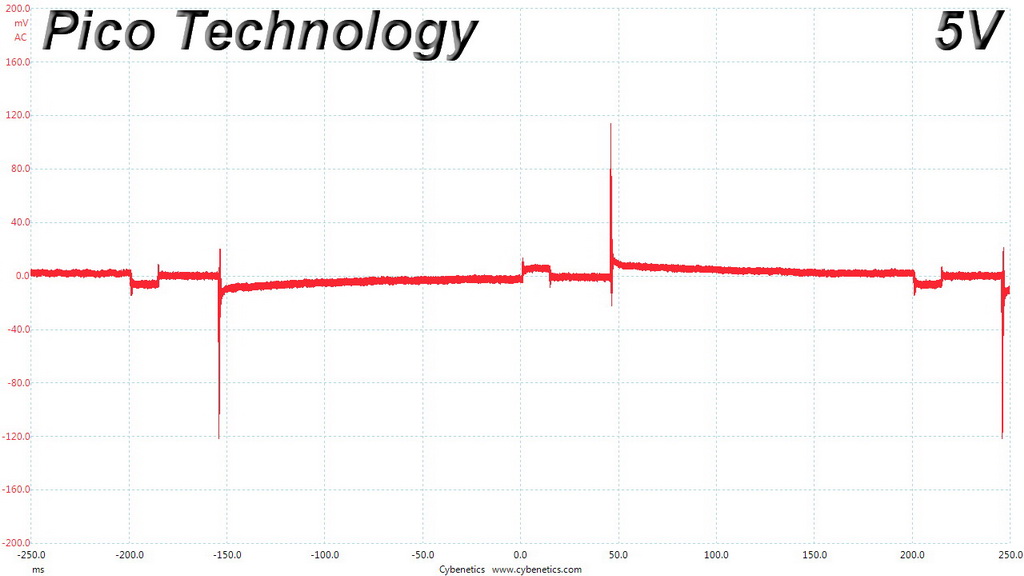
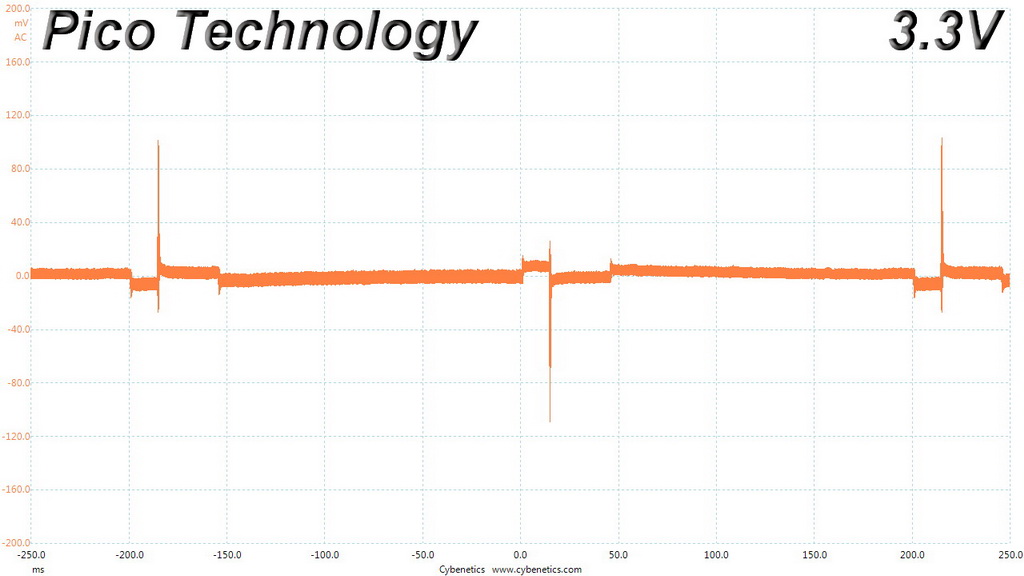
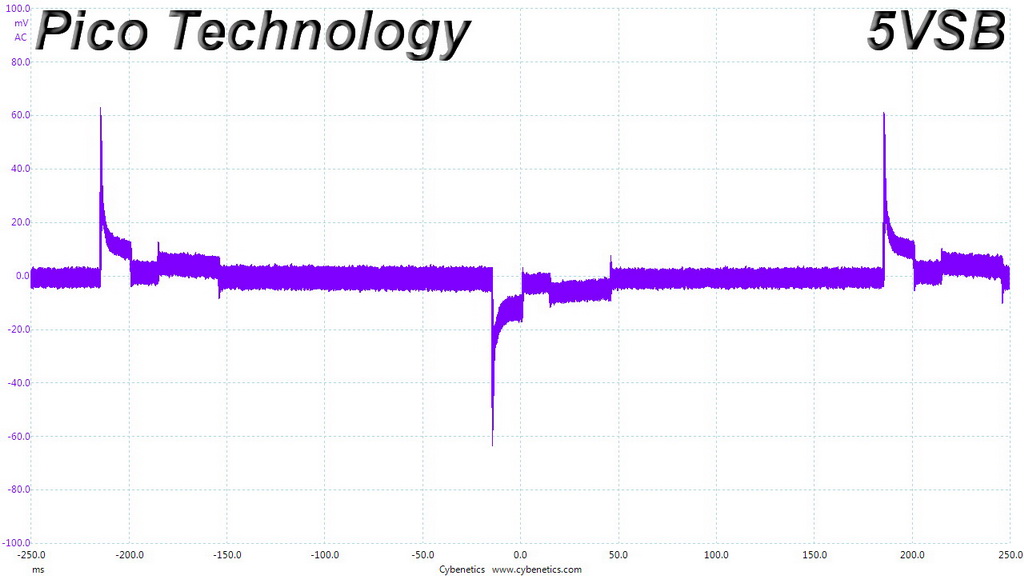
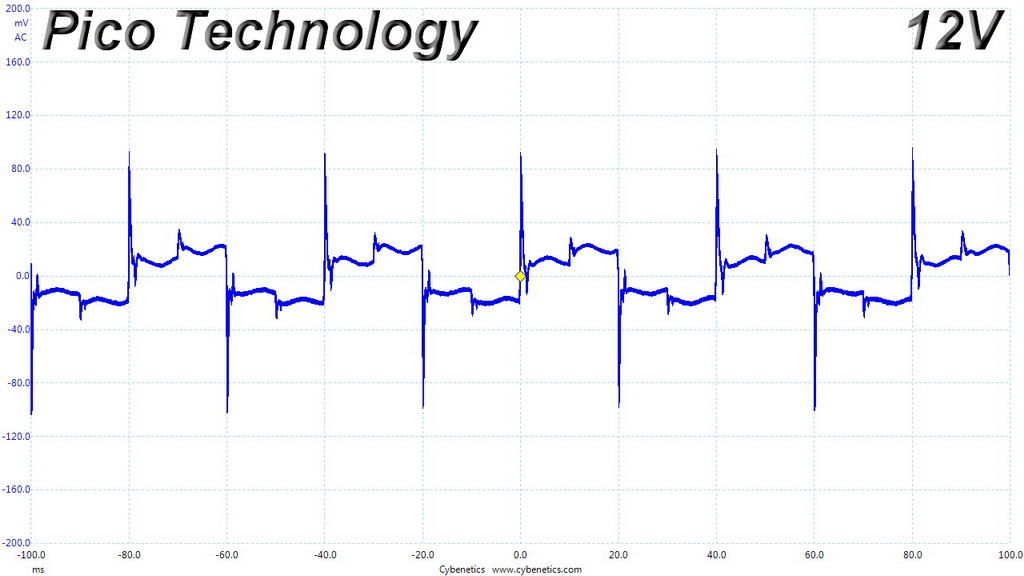
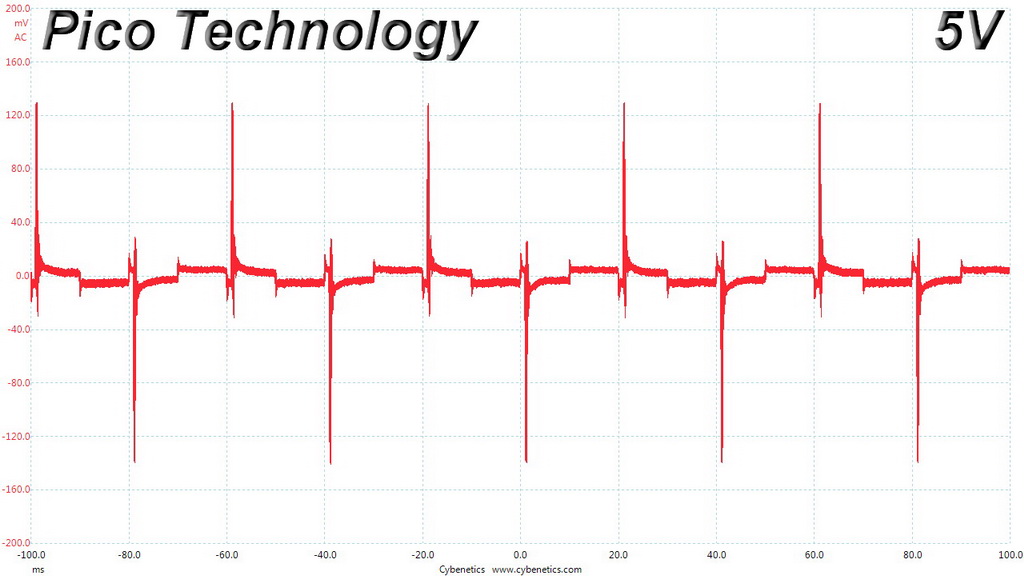
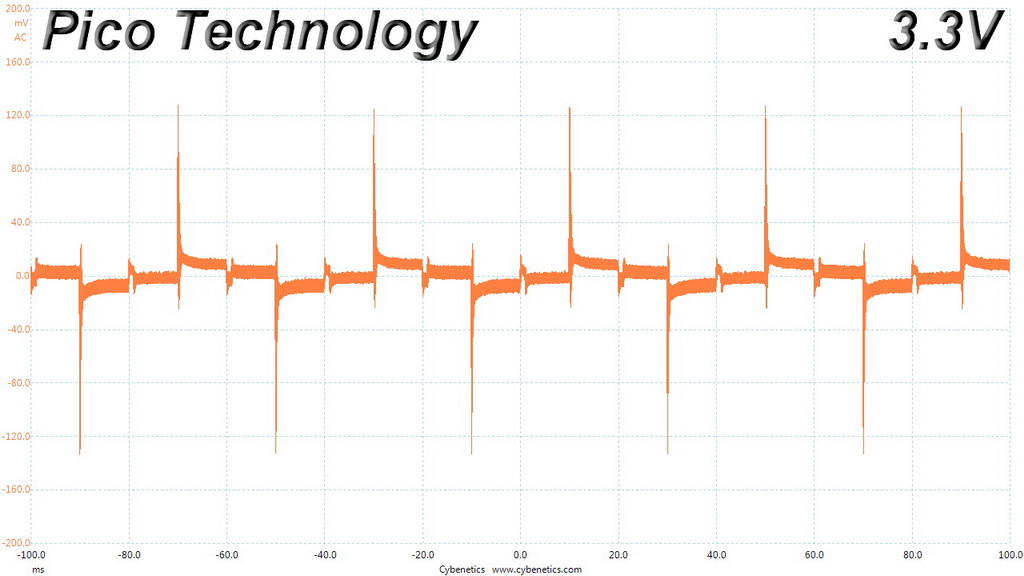
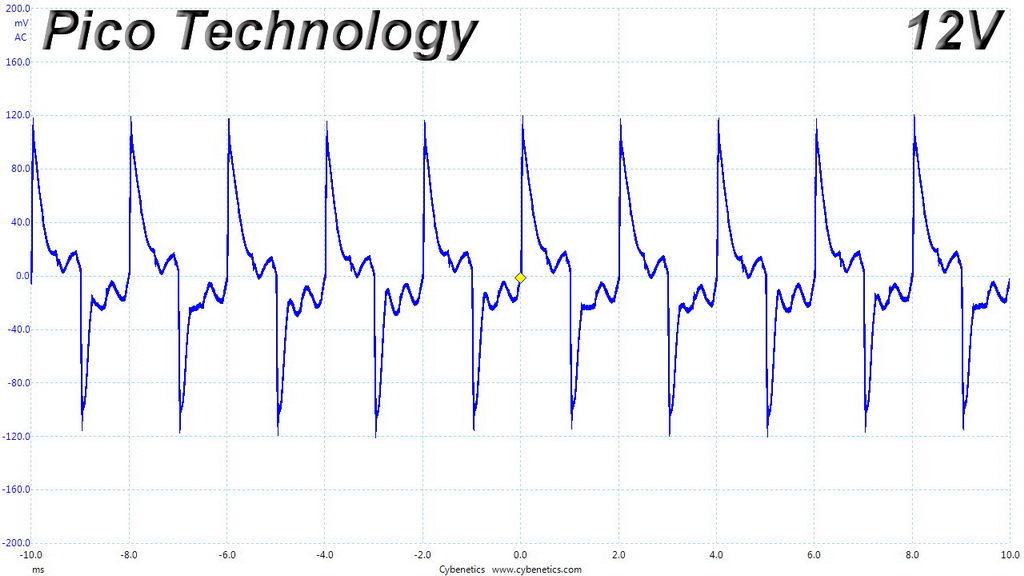
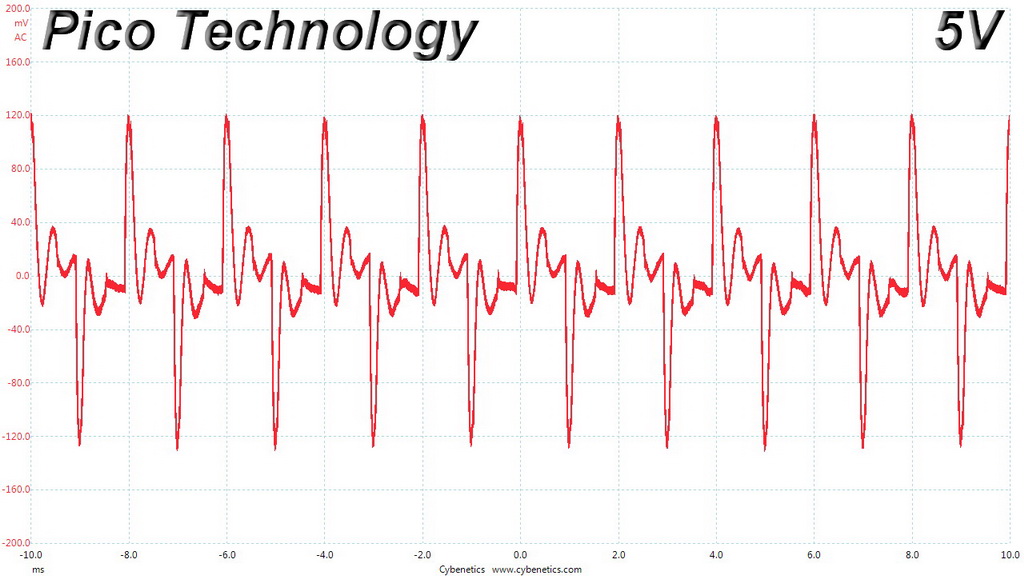
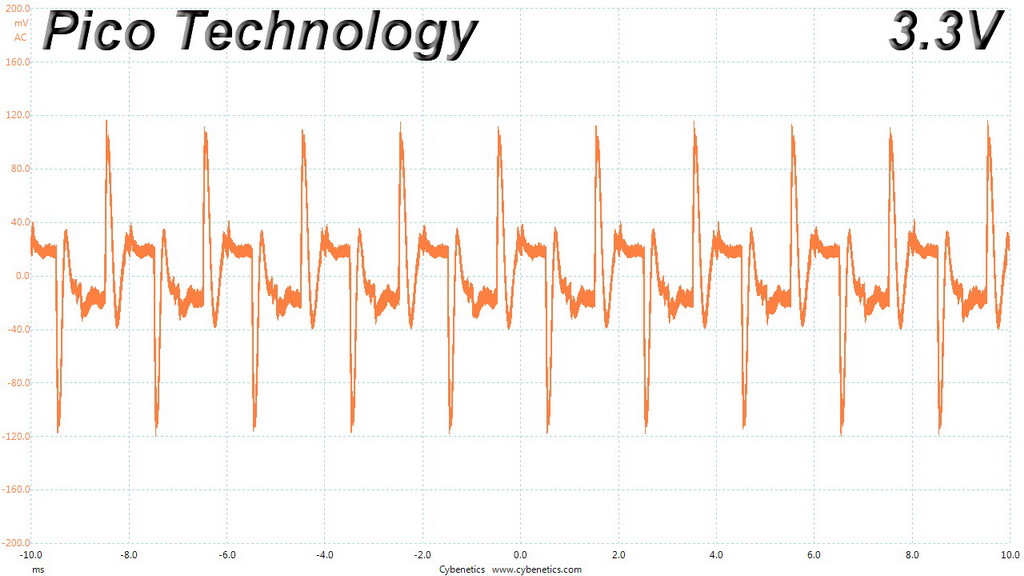
Here are the oscilloscope screenshots we took during Advanced Transient Response Testing:
Transient Response At 20 Percent Load – 200ms
Transient Response At 20 Percent Load – 20ms
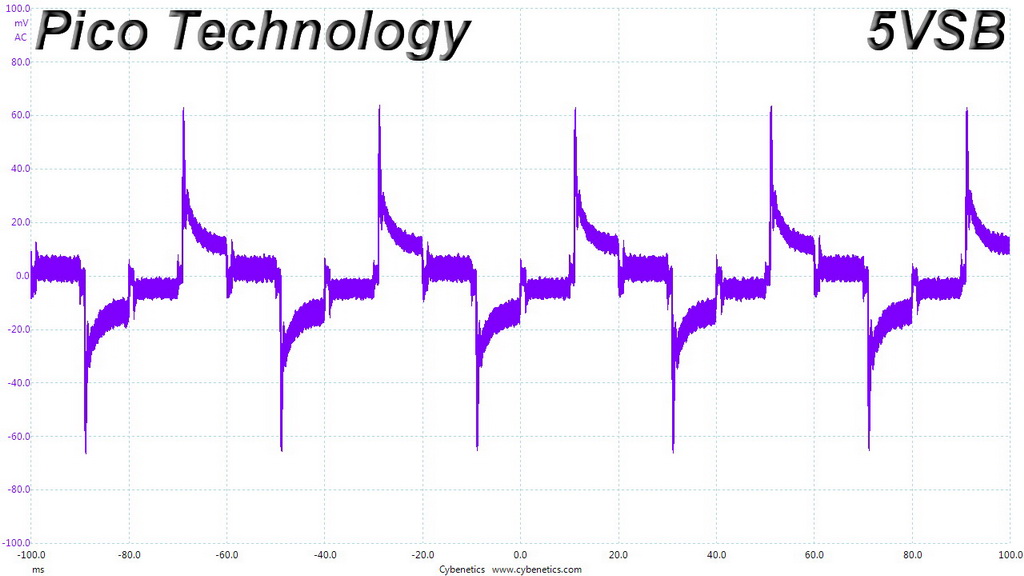
Transient Response At 20 Percent Load – 1ms
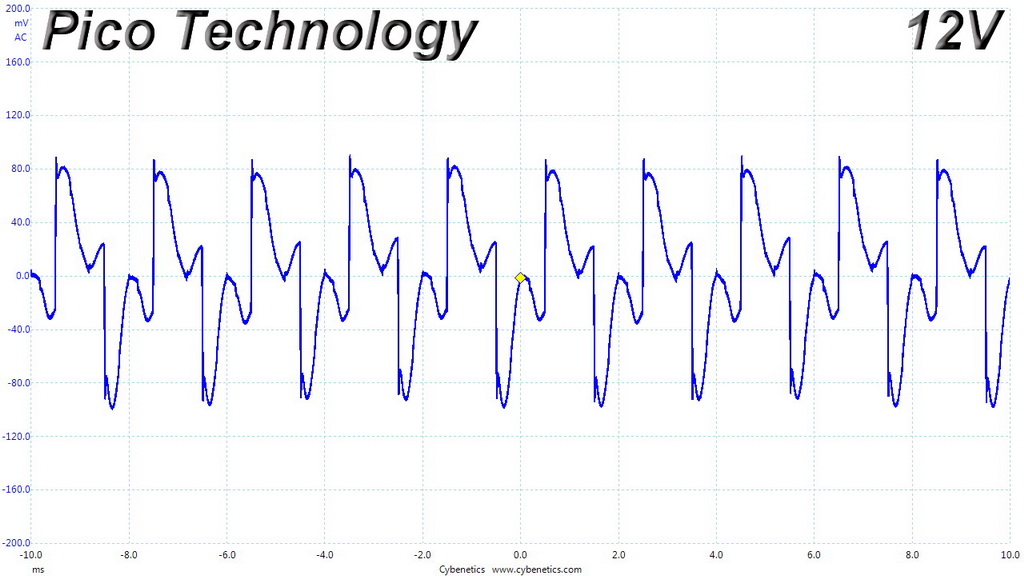
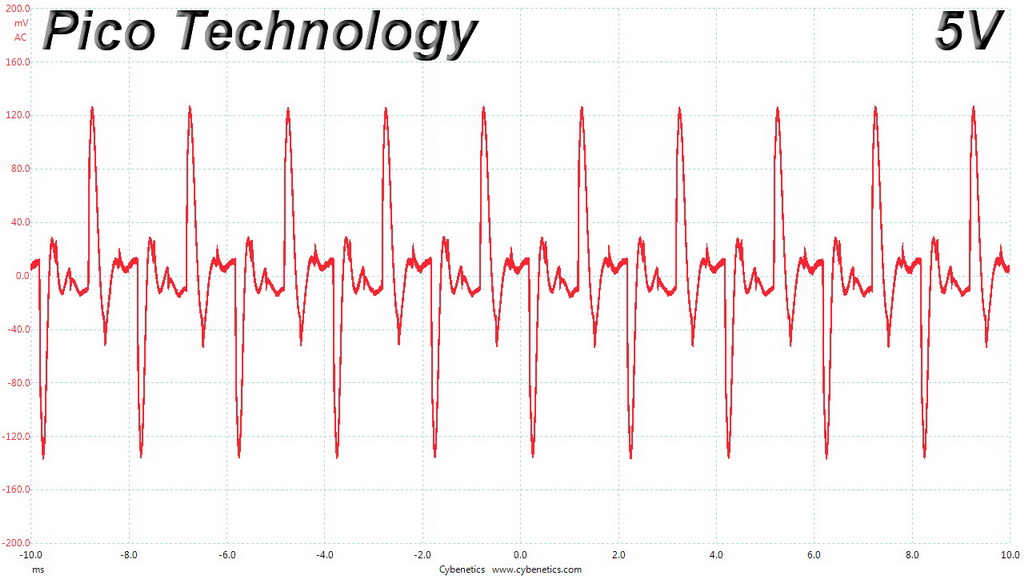
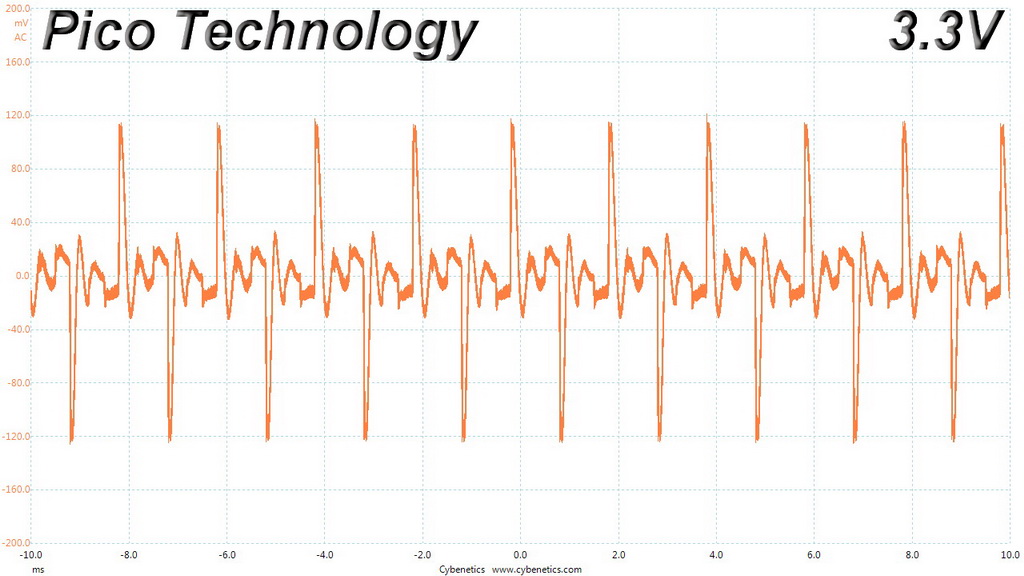
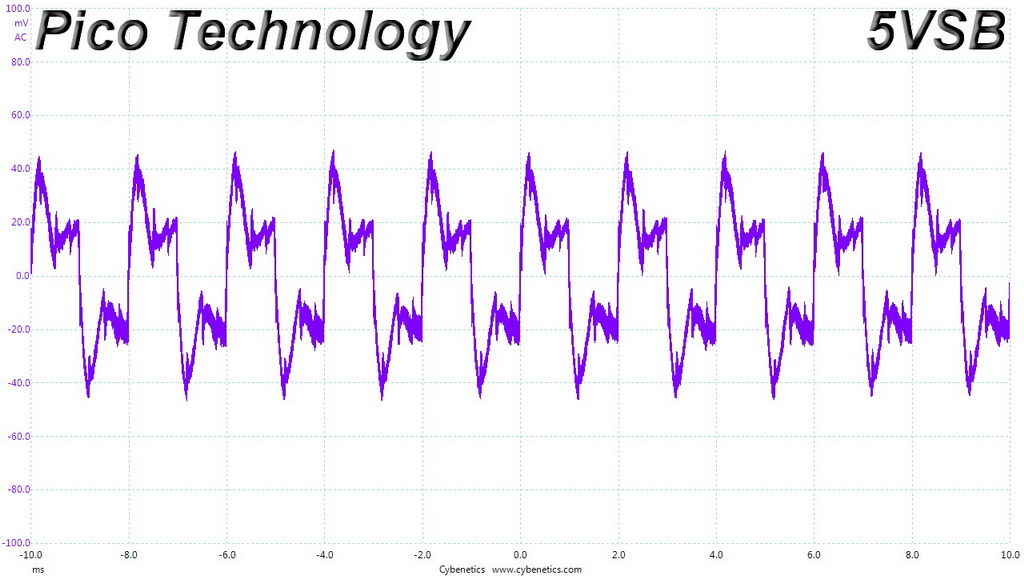
Transient Response At 50 Percent Load – 200ms
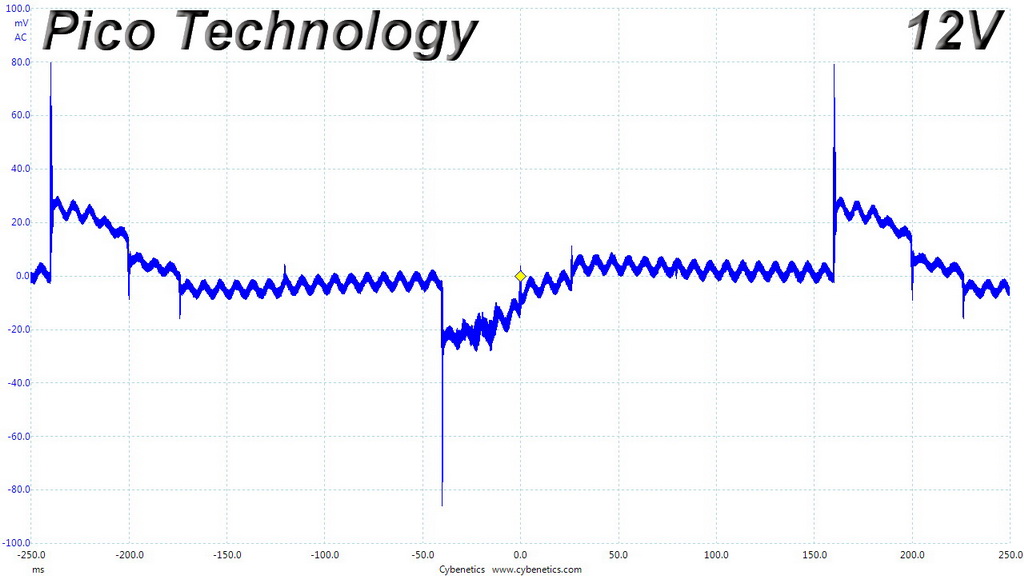
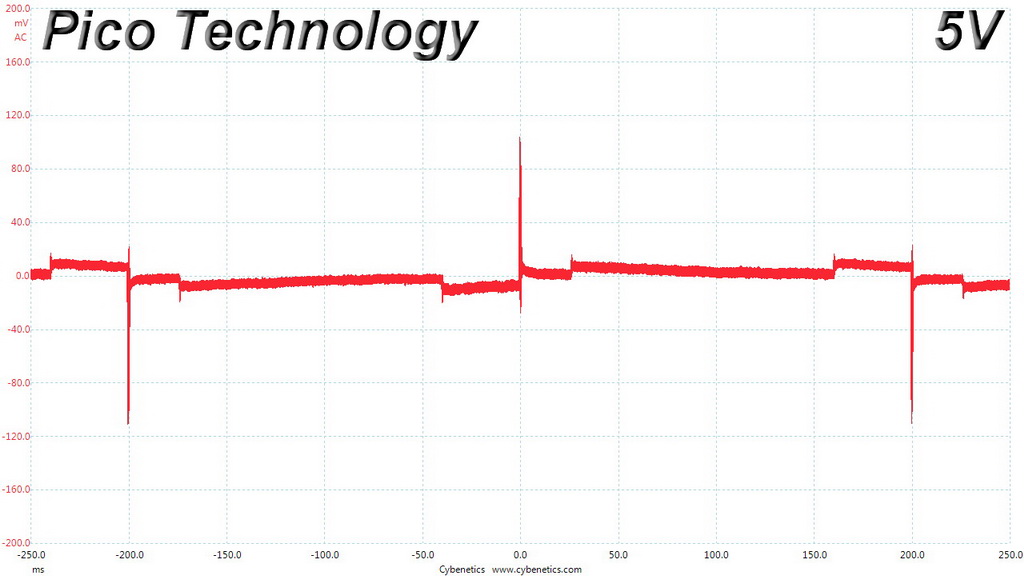
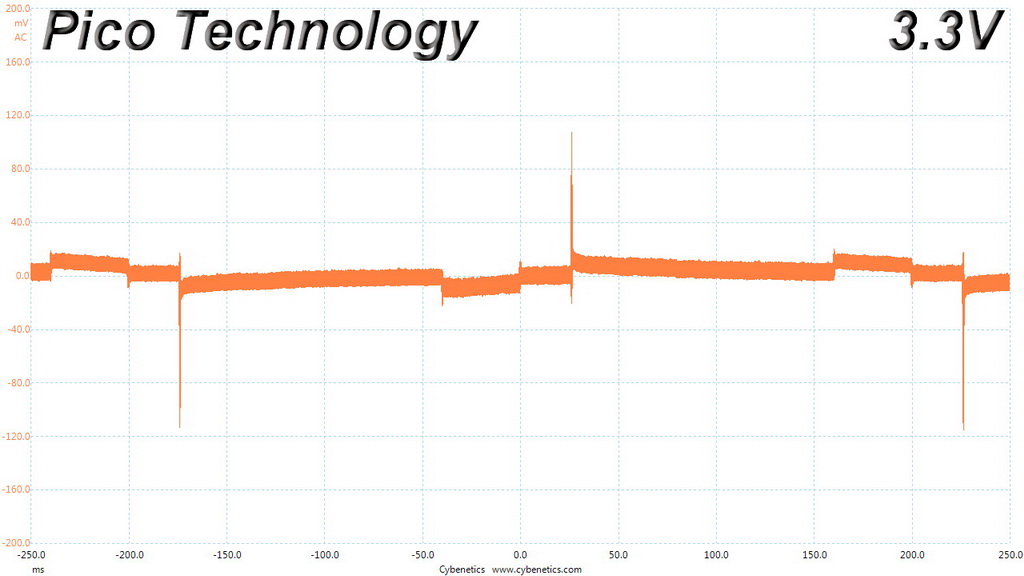
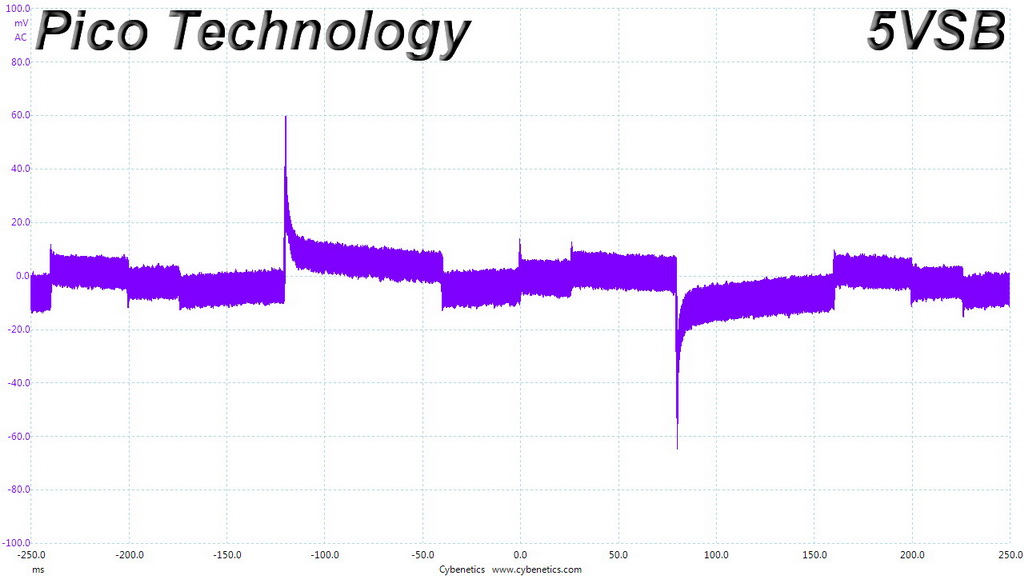
Transient Response At 50 Percent Load – 20ms
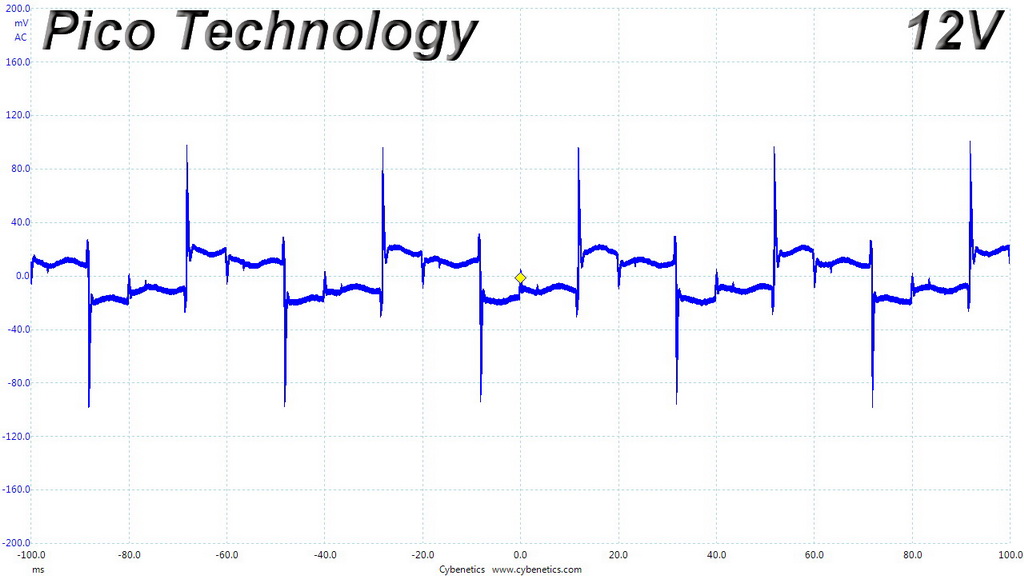
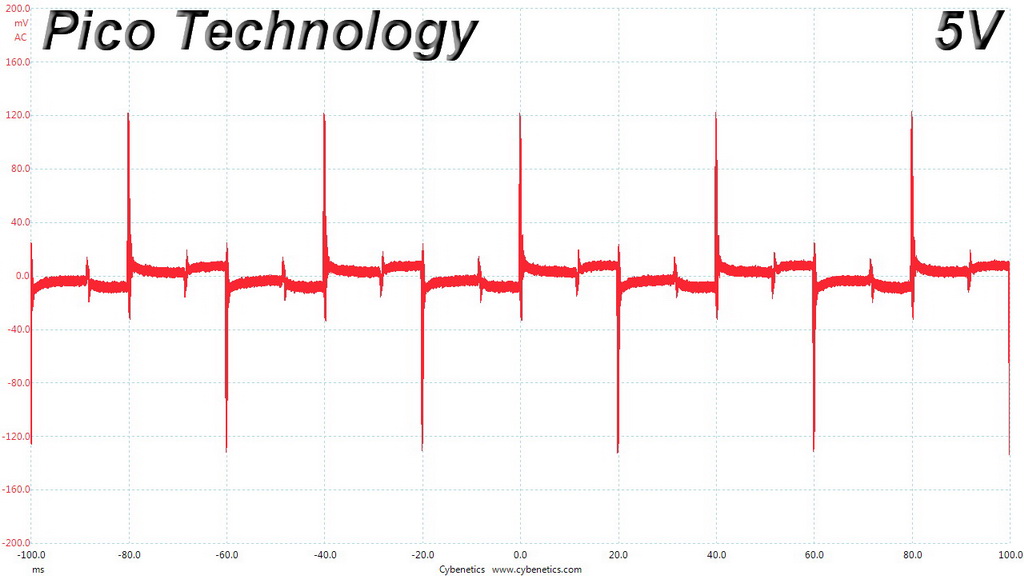
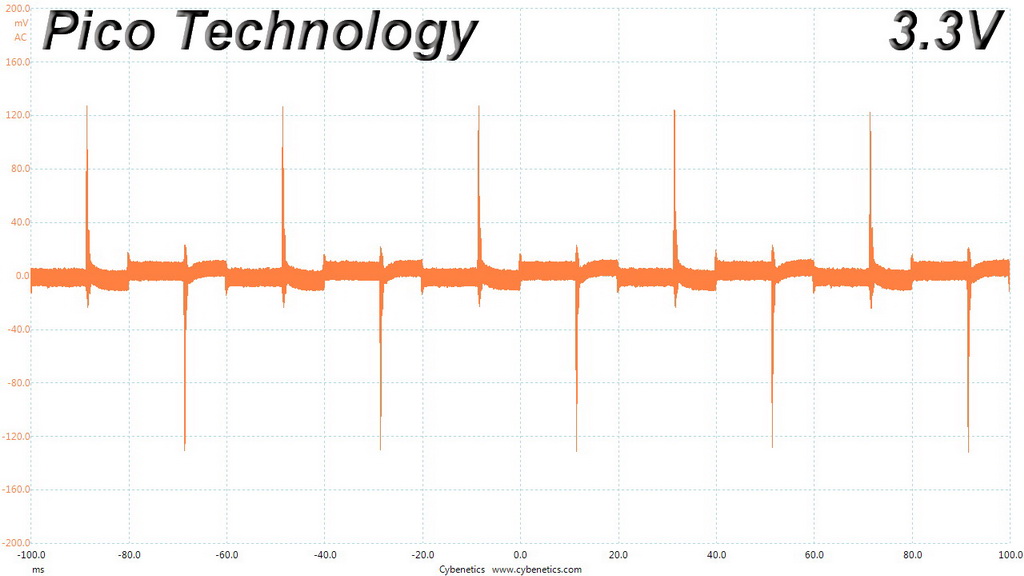
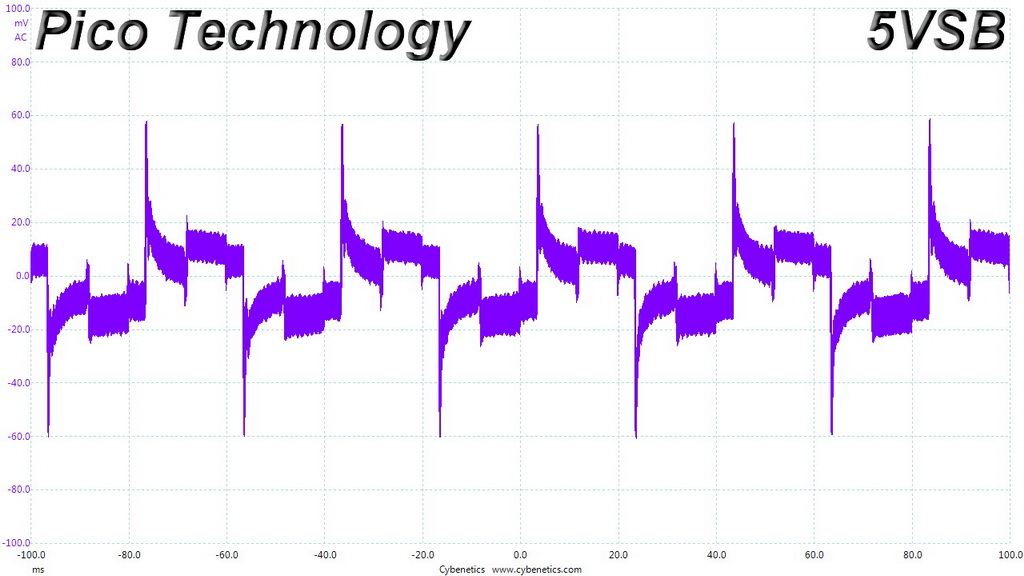
Transient Response At 50 Percent Load – 1ms
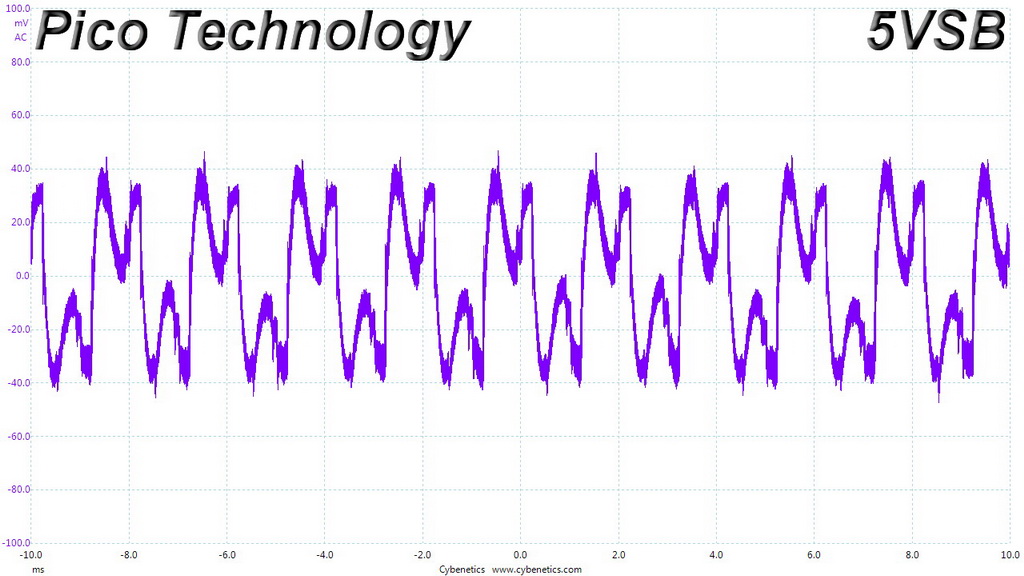
Turn-On Transient Tests
In the next set of tests, we measured the GX-F750's response in simpler transient load scenarios—during its power-on phase.
For our first measurement, we turned the GX-F750 off, dialed in the maximum current the 5VSB rail could output, and switched the PSU back on. In the second test, we dialed the maximum load the +12V rail could handle and started the 750W supply while it was in standby mode. In the last test, while the PSU was completely switched off (we cut off the power or switched the PSU off), we dialed the maximum load the +12V rail could handle before switching it back on from the loader and restoring power. The ATX specification states that recorded spikes on all rails should not exceed 10 percent of their nominal values (+10 percent for 12V is 13.2V, and 5.5 V for 5V).
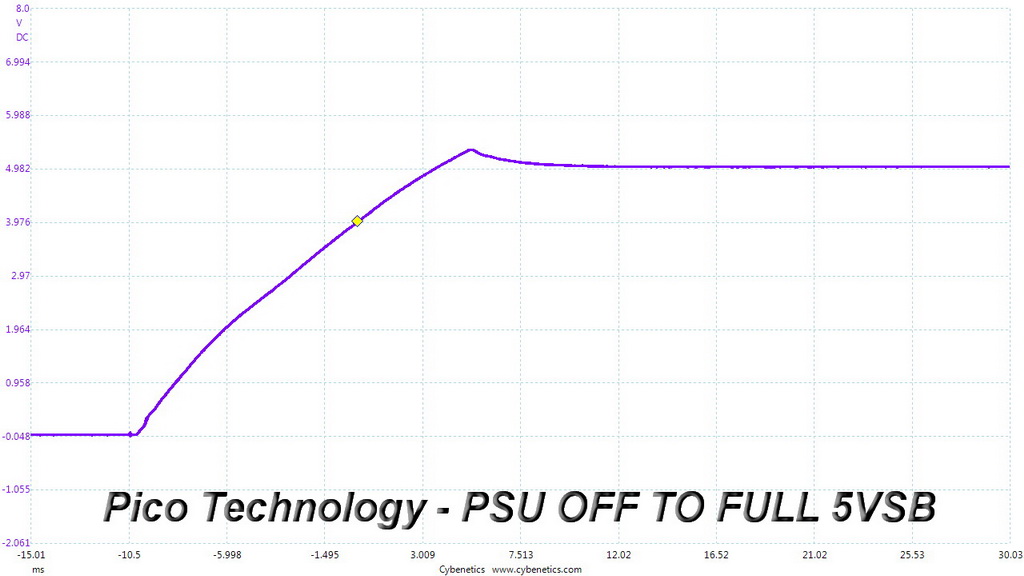
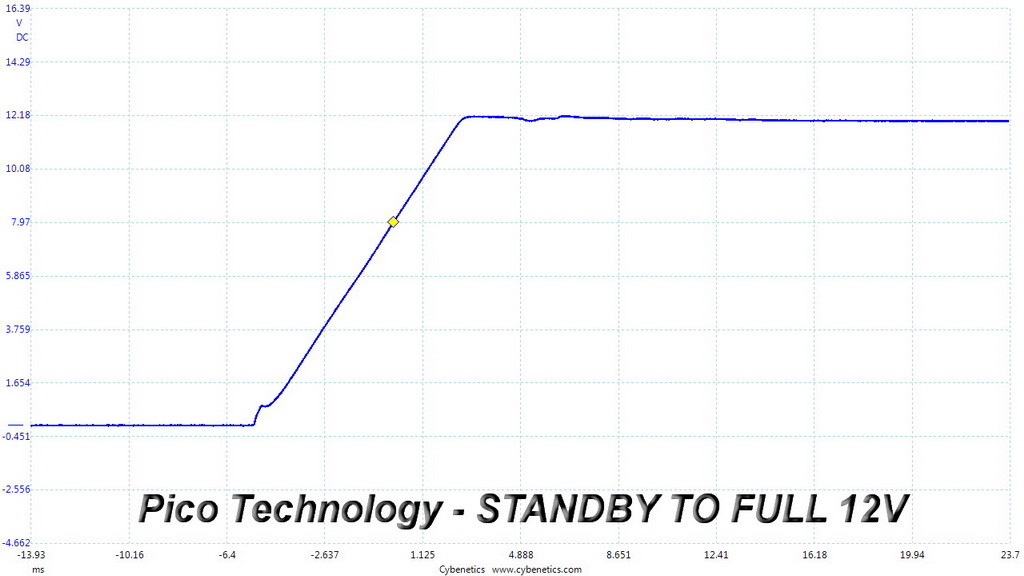
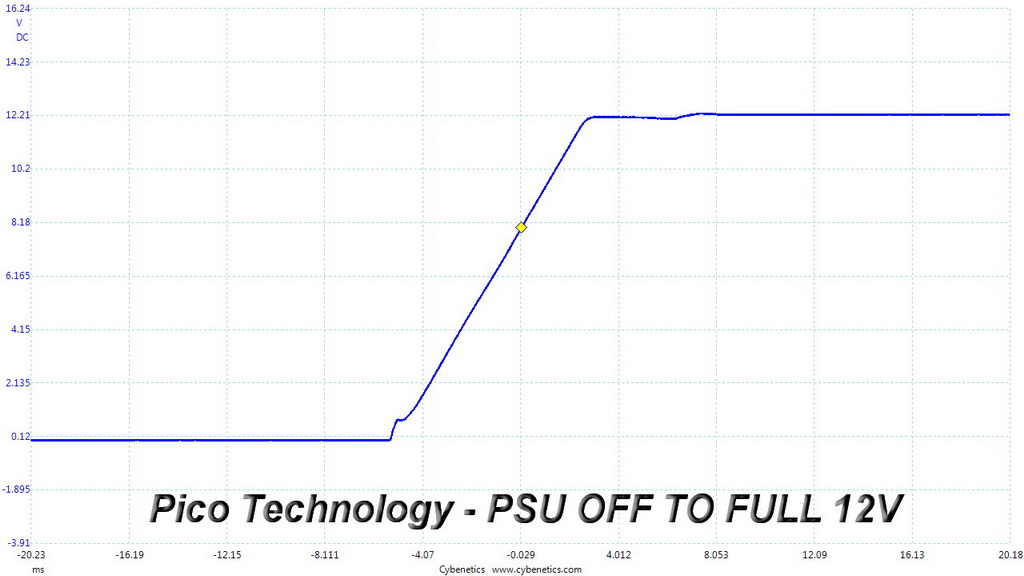
There is a small voltage overshoot at 5VSB. But performance in the other two tests is perfect.
MORE: Best Power Supplies
MORE: How We Test Power Supplies
MORE: All Power Supply Content
Current page: Transient Response Tests
Prev Page Cross-Load Tests & Infrared Images Next Page Ripple Measurements
Aris Mpitziopoulos is a contributing editor at Tom's Hardware, covering PSUs.
-
shrapnel_indie ReplyAll of Cougar's PSUs are made by HEC/Compucase, an OEM with many years of experience in this field.
HEC/Compucase, for at least the last decade hasn't been known to produce a single good unit. Cougar would do well to find a better OEM.
I'd love for HEC to have finally get a good platform though... AND never go back to less. -
bettsar Looking at the comparison products, are these numbers for the EVGA 750 G3 or the B3? If the everything is pointing to the G3 (including the cost), that definitely seems like the value leader. If the cost is pointing to the B3, then it could change the story quite a bit.Reply
However, I also see that the RM750x appears to have dropped in price, which would likely put it at the top of the value chart.