EVGA SuperNOVA 550 G2 PSU Review
EVGA introduced two new low-capacity G2 PSUs. Today, we evaluate the 550 G2 model made by Super Flower, which features 80 Plus Gold efficiency.
Why you can trust Tom's Hardware
Cross-Load Tests And Infrared Images
Our cross-load tests are described in detail here.
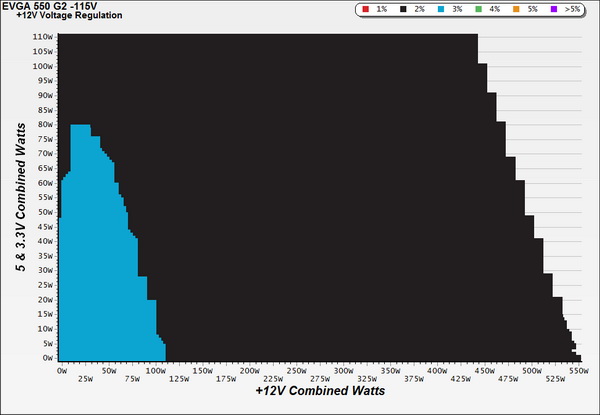
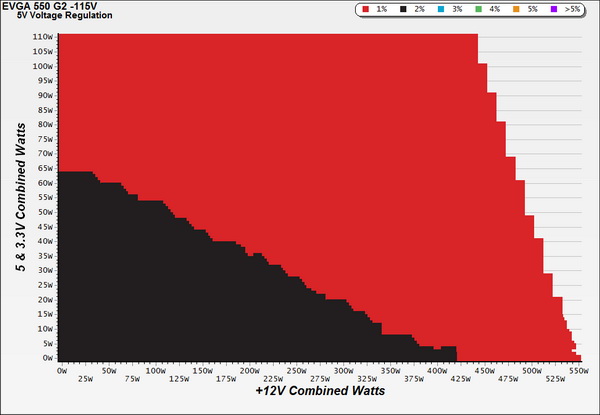
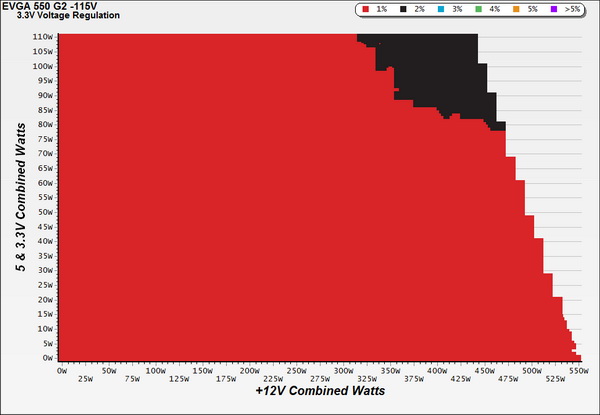
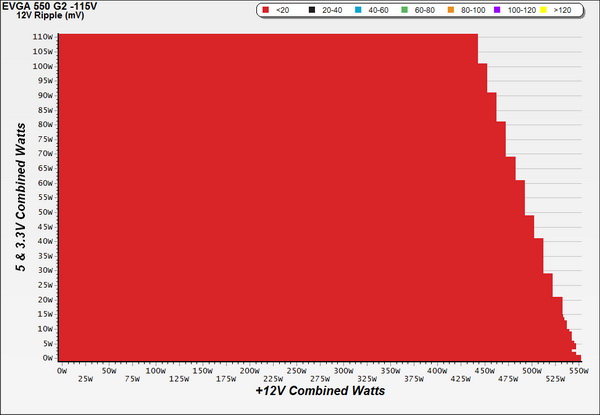
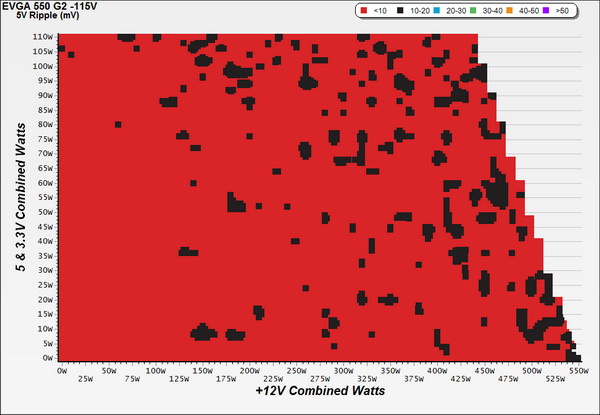
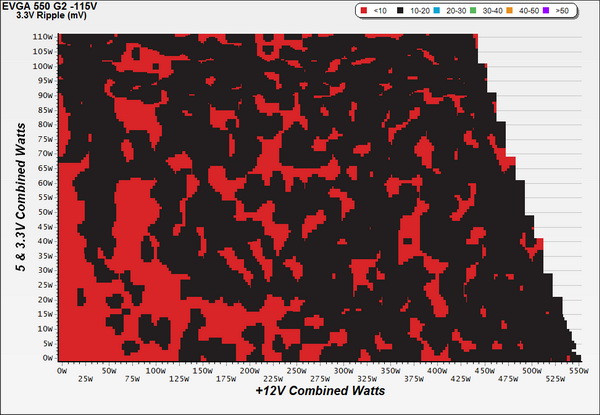
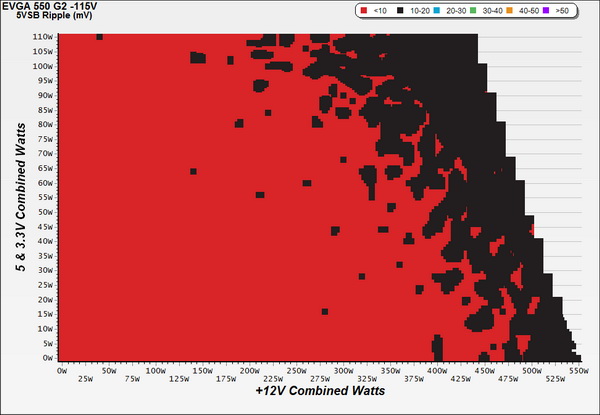
To generate the following charts, we set our loaders to auto mode through our custom-made software before trying more than 1,000 possible load combinations with the +12V, 5V and 3.3V rails. The load-regulation deviations in each of the charts below were calculated by taking the nominal values of the rails (12V, 5V and 3.3V) as point zero.
Load Regulation Charts
Efficiency Chart
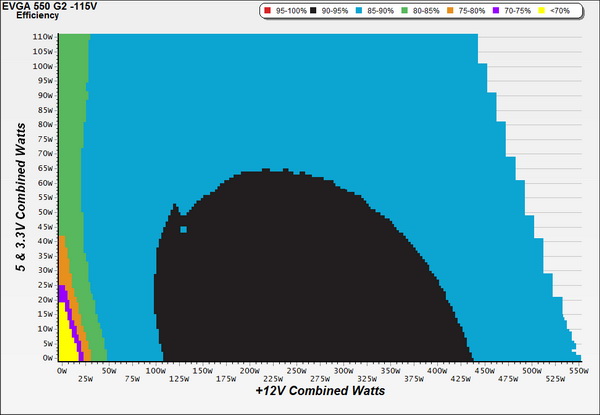
For a quite large region of the PSU's operating range, the efficiency is between 90 and 95 percent. This is a highly efficient platform, and it can be even more efficient with some modifications. Super Flower already released a 550W Leadex Platinum unit, and we expect EVGA to include the relevant model in the P2 line soon.
Ripple Charts
Infrared Images
Toward the end of the cross-load tests, we took some photos of the PSU with our modified FLIR E4 camera that delivers 320 x 240-IR resolution (76,800 pixels).
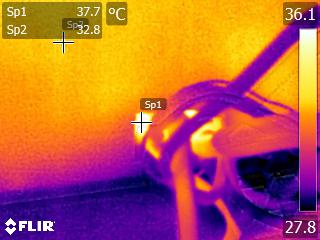
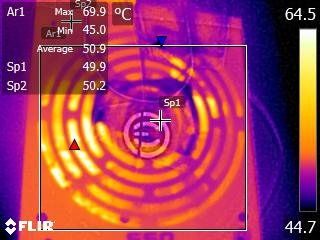
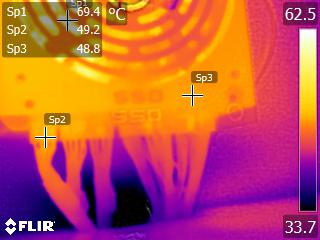
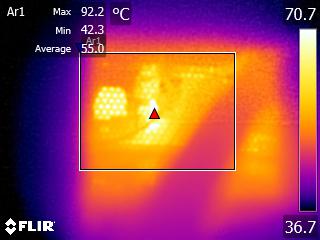
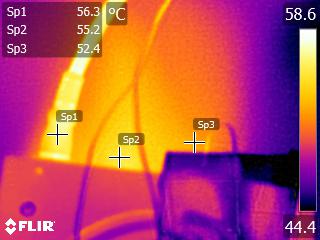
Inside the PSU, the temperatures were at normal levels, given that we shot the above thermal images during the overload test (110 percent load) with an ambient temperature that exceeded 45 degrees C. We also noticed that in a worst-case scenario, the single-bridge rectifier had an operating temperature that reached 92.2 degrees C. We should note, however, that most bridge rectifiers can easily operate at even higher temperatures, reaching or exceeding 100 degrees C.
Get Tom's Hardware's best news and in-depth reviews, straight to your inbox.
Current page: Cross-Load Tests And Infrared Images
Prev Page Efficiency, Temperature And Noise Next Page Transient Response Tests
Aris Mpitziopoulos is a contributing editor at Tom's Hardware, covering PSUs.
-
marraco Wow. Ripple behavior is fantastic.Reply
I would like to see another test. I had a PC with a Coolermaster PSU and 4 HD which were put to sleep mode/hibernation. Sometimes when the 4 HD were powered up the PC hanged, because the 4 HD demanded so much transient power that it threw the PSU voltages out of specs.
I was thinking that I had a great PSU, but it was expensive garbage. -
Aris_Mp this scenario is covered by the transient response tests, which I conduct in page #7 of the review.Reply -
giantbucket i don't get it... isn't this like trying to sell a Ferrari with only 3 cylinders to appeal to the sub-$100,000 clientele?Reply -
dstarr3 Super Flower makes some great hardware. I'm all over this for my upcoming modest gaming rig.Reply -
dstarr3 Replyi don't get it... isn't this like trying to sell a Ferrari with only 3 cylinders to appeal to the sub-$100,000 clientele?
The problem is that all of the best-built, best-featured PSUs were being made in 850, 1000, 1200, 1600W variants. If you had just a modest system, something mid-range, you either had to get a PSU that was way overkill, or you had to settle for PSUs that weren't so well built, or as efficient, or as fully-featured. So, this is an attempt to distribute very high-quality products to more of the market. And I am 110% A-Okay with that. -
MasterDell Reply
I agree with this to some extent because there are and were tons of PSU's made by Seasonic. Whether they were Antec units or XFX units OEM'd by Seasonic or not.. They were made by Seasonic. Now, as for fully modular, gold rated variants, those were and still are far and few between. However there are tons of Bronze semi-modular/none modular units which are great for mid-range builds.i don't get it... isn't this like trying to sell a Ferrari with only 3 cylinders to appeal to the sub-$100,000 clientele?
The problem is that all of the best-built, best-featured PSUs were being made in 850, 1000, 1200, 1600W variants. If you had just a modest system, something mid-range, you either had to get a PSU that was way overkill, or you had to settle for PSUs that weren't so well built, or as efficient, or as fully-featured. So, this is an attempt to distribute very high-quality products to more of the market. And I am 110% A-Okay with that.
I actually own this unit and used it in a build with a 960. I got it right when it came out and for it's price, it offered a ton. I live in Canada and PSU's are way over-priced and the prices make no sense on them. But this unit was priced extremely well likely due to it's availability so I picked one up. No problems and I am glad EVGA is filling this market void. Good on em.
-
Nuckles_56 Nice to see a low wattage power supply being reviewed for a change and particularly one which performs very wellReply -
turkey3_scratch I think I found my PSU. I don't need any 750W, but I had trouble finding a high quality 550W unit, and this is it!Reply -
g-unit1111 I have two G2s, these are far and away some of the best PSUs on the market! Good to see that EVGA is making some lower wattage models that have the same quality and consistency.Reply
