EVGA SuperNOVA 550 GS PSU Review
EVGA teamed up with Seasonic to release an affordable, mid-capacity, 80 PLUS Gold, fully modular PSU, the SuperNOVA 550 GS, which costs just $90.
Why you can trust Tom's Hardware
Load Regulation, Hold-Up Time And Inrush Current
To learn more about our PSU tests and methodology, please check out How We Test Power Supply Units.
Primary Rails And 5VSB Load Regulation
Load Regulation testing is detailed here.
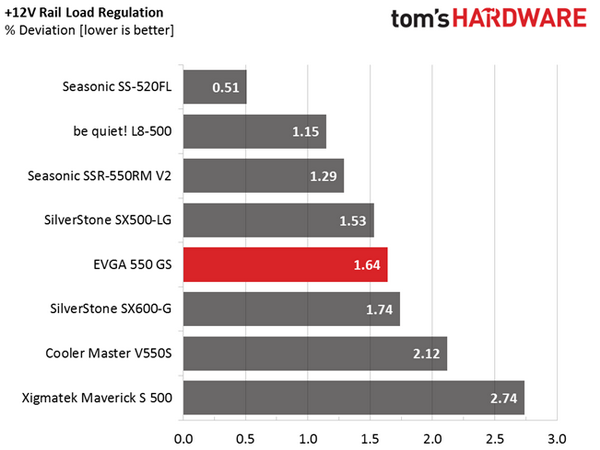
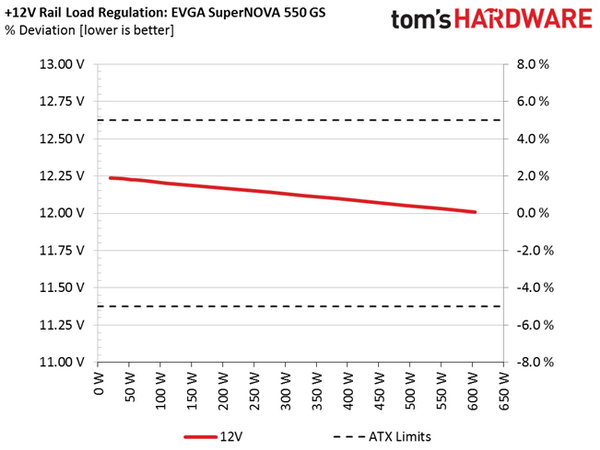
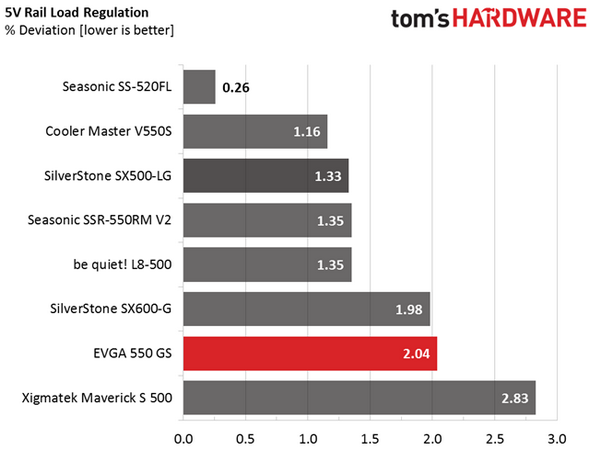
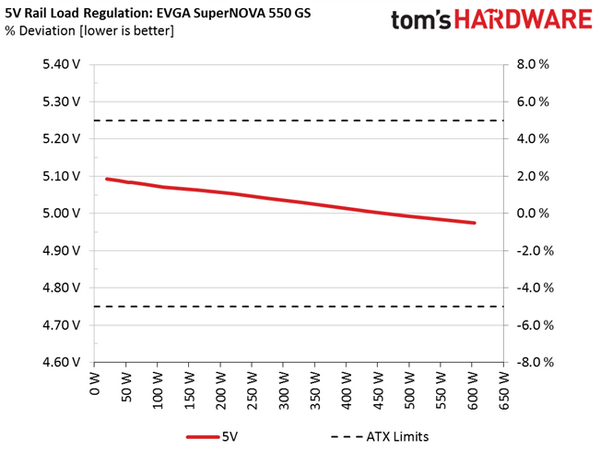
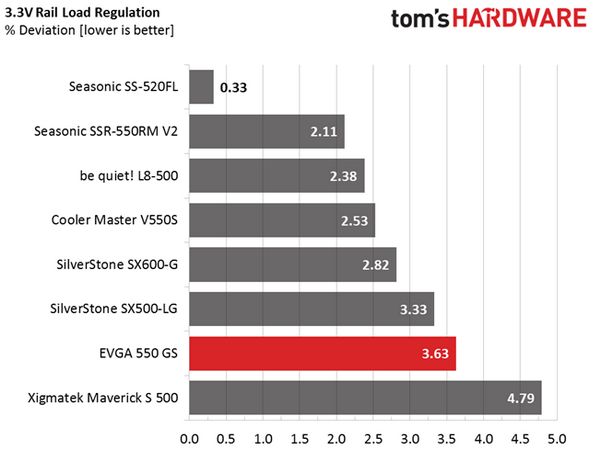
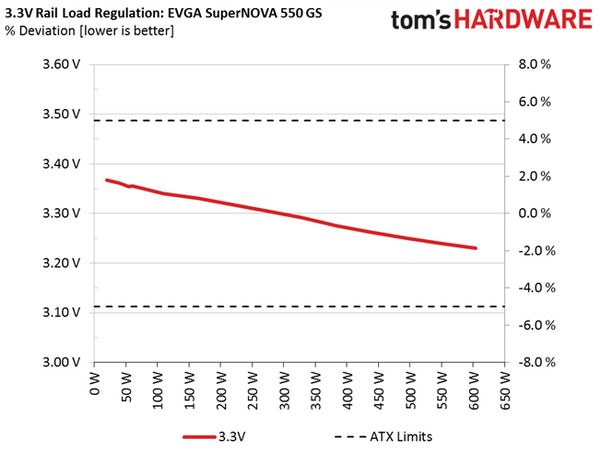
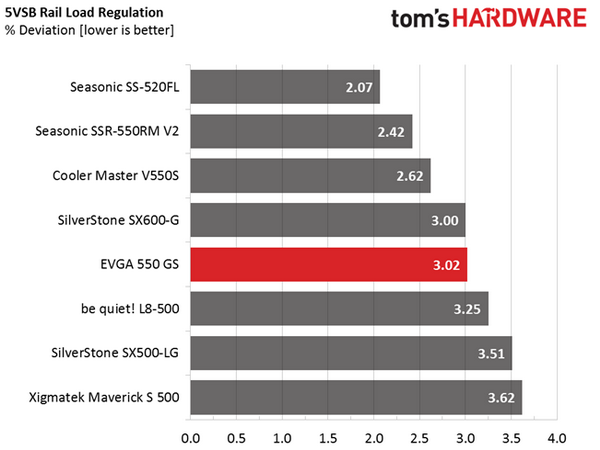
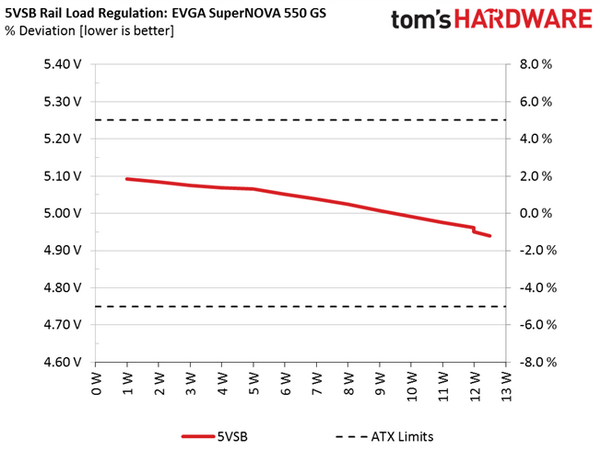
The following charts show the voltage values of the main rails, recorded over a range from 40W to the maximum specified load, and the deviation (in percent) for the same load range. You will also find a chart showing how the 5VSB rail deals with the load we throw at it.
Hold-Up Time
Our hold-up time tests are described in detail here.
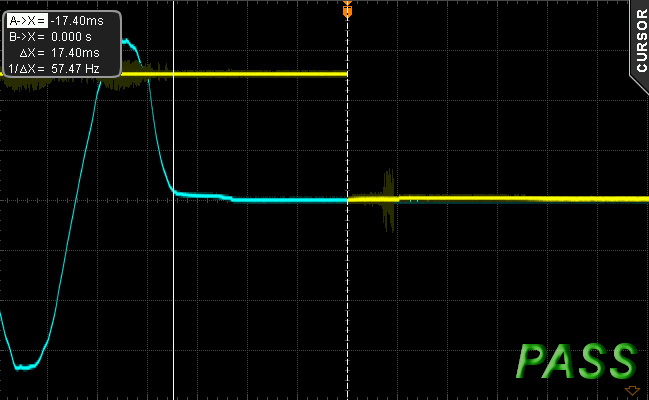
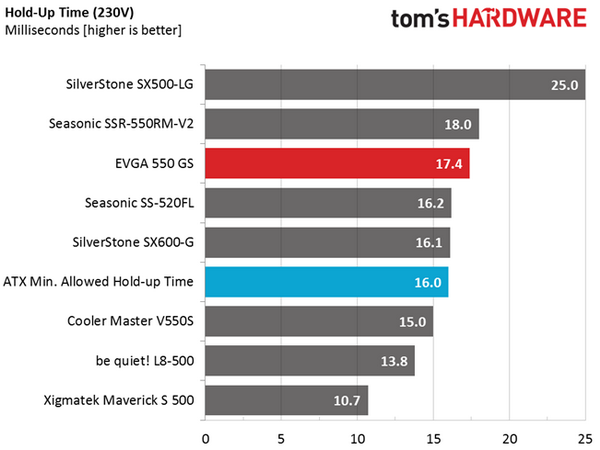
The hold-up time easily exceeded 16ms, which means a properly-sized bulk capacitor was used.
Inrush Current
For details on our inrush current testing, please click here.
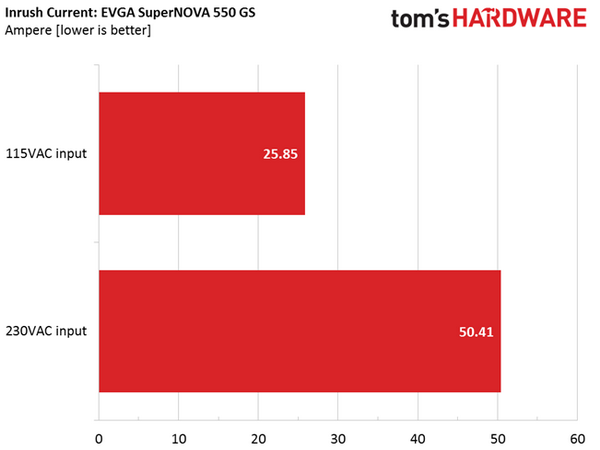
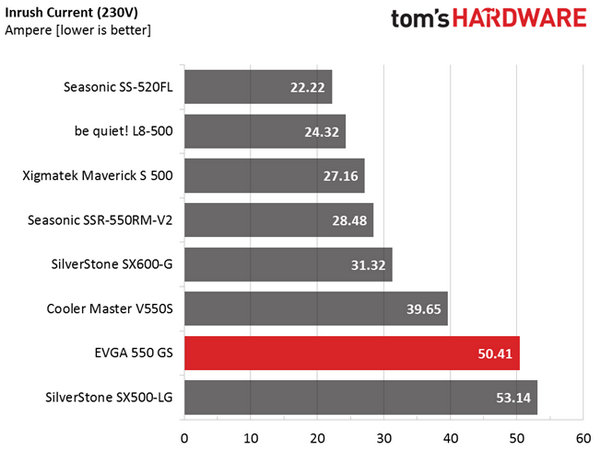
The registered inrush current was higher than other similar-capacity PSUs when tested at 115V and 230V input; however, it wasn't at dangerously high levels in any case.
Get Tom's Hardware's best news and in-depth reviews, straight to your inbox.
Load Regulation And Efficiency Measurements
The first set of tests reveals the stability of the voltage rails and the PSU's efficiency. The applied load equals (approximately) 10 to 110 percent of the maximum load the supply can handle, in increments of 10 percentage points.
We conducted two additional tests. During the first, we stressed the two minor rails (5V and 3.3V) with a high load, while the load at +12V was only 0.10A. This test reveals whether a PSU is Haswell-ready or not. In the second test, we determined the maximum load the +12V rail could handle with minimal load on the minor rails.
| Test | 12V | 5V | 3.3V | 5VSB | Power DC/AC (W) | Efficiency (%) | Fan Speed (RPM) | Fan Noise dB(A) | TempIn/Out (°C) | PF/AC (V) |
|---|---|---|---|---|---|---|---|---|---|---|
| 1 | 2.713A | 1.963A | 1.965A | 0.986A | 54.73 | 84.24 | 600 | 27.3 | 38.30 | 0.973 |
| 12.224V | 5.083V | 3.354V | 5.066V | 64.97 | 41.76 | 115.0V | ||||
| 2 | 6.464A | 2.948A | 2.962A | 1.185A | 109.71 | 89.04 | 600 | 27.3 | 39.19 | 0.99 |
| 12.203V | 5.071V | 3.340V | 5.052V | 123.22 | 42.89 | 115.0V | ||||
| 3 | 10.569A | 3.455A | 3.480A | 1.384A | 164.81 | 90.40 | 620 | 27.4 | 40.04 | 0.994 |
| 12.183V | 5.062V | 3.330V | 5.038V | 182.31 | 44.19 | 115.0V | ||||
| 4 | 14.682A | 3.952A | 3.976A | 1.590A | 219.73 | 90.81 | 870 | 36.0 | 40.77 | 0.996 |
| 12.163V | 5.053V | 3.318V | 5.025V | 241.97 | 45.20 | 115.0V | ||||
| 5 | 18.469A | 4.961A | 4.991A | 1.795A | 274.71 | 90.55 | 1160 | 38.7 | 41.28 | 0.992 |
| 12.141V | 5.040V | 3.304V | 5.007V | 303.37 | 45.84 | 115.0V | ||||
| 6 | 22.265A | 5.963A | 6.016A | 2.000A | 329.62 | 90.10 | 1380 | 42.0 | 42.04 | 0.99 |
| 12.120V | 5.029V | 3.291V | 4.992V | 365.86 | 46.93 | 115.0V | ||||
| 7 | 26.080A | 6.977A | 7.051A | 2.207A | 384.59 | 89.51 | 1590 | 45.2 | 43.31 | 0.99 |
| 12.098V | 5.017V | 3.275V | 4.976V | 429.65 | 48.62 | 114.9V | ||||
| 8 | 29.907A | 7.991A | 8.094A | 2.415A | 439.54 | 88.79 | 1670 | 45.8 | 44.49 | 0.99 |
| 12.076V | 5.005V | 3.262V | 4.961V | 495.06 | 50.24 | 114.9V | ||||
| 9 | 34.181A | 8.504A | 8.645A | 2.419A | 494.52 | 87.86 | 1680 | 45.9 | 45.07 | 0.991 |
| 12.053V | 4.994V | 3.250V | 4.950V | 562.86 | 51.26 | 114.9V | ||||
| 10 | 38.412A | 9.032A | 9.168A | 2.529A | 549.34 | 86.85 | 1700 | 46.1 | 45.24 | 0.991 |
| 12.031V | 4.984V | 3.239V | 4.939V | 632.52 | 52.19 | 114.9V | ||||
| 11 | 43.056A | 9.050A | 9.196A | 2.530A | 604.22 | 85.63 | 1700 | 46.1 | 46.62 | 0.991 |
| 12.008V | 4.975V | 3.230V | 4.932V | 705.65 | 53.96 | 114.9V | ||||
| CL1 | 0.098A | 12.008A | 12.006A | 0.004A | 101.39 | 83.19% | 1355 | 41.9 | 44.02 | 0.99 |
| 12.199V | 5.049V | 3.294V | 5.062V | 121.88 | 48.70 | 115.0V | ||||
| CL2 | 44.979A | 1.002A | 1.003A | 1.002A | 554.56 | 87.76 | 1700 | 46.1 | 45.18 | 0.991 |
| 12.033V | 5.014V | 3.290V | 4.998V | 631.89 | 48.53 | 114.9V |
The +12V and 5V rails offer decent, but definitely not top-notch load regulation, while the 3.3V and 5VSB rails exceeded three percent deviation. We would like to see at least the 3.3V rail staying within three percent, but obviously this platform is optimized for low budgets and not peak performance. In the efficiency section, the 550 GS easily passes the 80 PLUS Gold requirements with 20 and 50 percent load. Under full load, efficiency is 0.15 percent lower than the 87 percent we were looking for. However, as we mention in every PSU review, the 80 PLUS organization tests at 23 °C, while we conduct our tests at temperatures that reach and in many cases exceed 45 °C during the full- and over-load tests.
Due to the increased temperatures inside our hot box, ECO (passive) mode didn't have a chance to activate even during the first tests. Rather, the fan spun at low speeds up to the 30 percent load test. Afterward, it kept its noise below 40 dB(A) until the 50 percent load test, and during the last tests, the fan's output reached 46 dB(A). While we can't call this quiet, the fan's diameter is pretty small, which doesn't help in the acoustic department.
Current page: Load Regulation, Hold-Up Time And Inrush Current
Prev Page A Look Inside And Component Analysis Next Page Efficiency, Temperature And Noise
Aris Mpitziopoulos is a contributing editor at Tom's Hardware, covering PSUs.
-
Aris_Mp my last reviews were of smaller capacity units and I will try to bring even more of them.Reply -
Luay Coorection, EVGA did release a gold rated 1050W and 850W Seasonic PSU also branded as GS, and a platinum 1000W PS. There's also a 650W version of the PSU reviewed here which takes the total to five Seasonic OEMs branded by EVGA.Reply -
Larry Litmanen ReplyThere are less rippletastic options at that price point.
For the most part when it comes to PC parts you get what you pay for. Unless you spot a great sale, a 550W fully modular, 80 Gold PSU from a company like EVGA with a 5 year warranty. EVGA is super easy to deal with should you need to replace a unit. All that for $90? If this PSU was a 650W unit with same features and for the same price it would have been perfect.
-
atheus Reply
You mean the price would have been perfect? Confusing idea to change the wattage rather than just change the price. I take that to mean instead of a certain price/performance you would rather have a 650 watt PSU than a 550.There are less rippletastic options at that price point.
For the most part when it comes to PC parts you get what you pay for. Unless you spot a great sale, a 550W fully modular, 80 Gold PSU from a company like EVGA with a 5 year warranty. EVGA is super easy to deal with should you need to replace a unit. All that for $90? If this PSU was a 650W unit with same features and for the same price it would have been perfect.
I see 650 watt PSU's as only for SLI systems, which are fairly niche. With 550 you can handle any single GPU, and in the case of Maxwell GPU's <= 980 you could even SLI them so long as you aren't doing some obscene overclocking or running a dozen fans and pumps and a datacenter worth of HDD's. So for my go-to wattage for a standard high performance single GPU build is 550. For medium performance 450 is even better. -
logainofhades Unless you really feel the need for a gold rated PSU, I would probably save some cash and stick with a Seasonic 520w or 620w M12II. Even the 750w B2 series is cheaper.Reply -
Aris_Mp ReplyCoorection, EVGA did release a gold rated 1050W and 850W Seasonic PSU also branded as GS, and a platinum 1000W PS. There's also a 650W version of the PSU reviewed here which takes the total to five Seasonic OEMs branded by EVGA.
This is exactly what I write inside the review. Four GS PSUs and one PS.
"So far, the new PS series includes only a single unit with 1kW of max power; EVGA's GS line, on the other hand, has four PSUs with 550, 650, 850 and 1050W capacities."
I also have the 650 GS in my lab, but this isn't for Tom's.
