Why you can trust Tom's Hardware
Comparison Products
We compare the Gaming Performance Plus 2TB to other high-end PCIe 4.0 drives including Samsung’s 980 Pro, the Western Digital (WD) Black SN850, and the Crucial P5 Plus. We also include other E18-based drives with the same flash, which include the Kingston KC3000, the Corsair MP600 Pro XT, and the Seagate FireCuda 530. Rounding out the pack is Inland’s older Performance Plus which has 96- rather than 176-layer Micron TLC. This is a fairly typical comparison pack at this point, but it does help locate performance anomalies if they happen to exist.
Trace Testing - 3DMark Storage Benchmark
Built for gamers, 3DMark’s Storage Benchmark focuses on real-world gaming performance. Each round in this benchmark stresses storage based on gaming activities including loading games, saving progress, installing game files, and recording gameplay video streams.
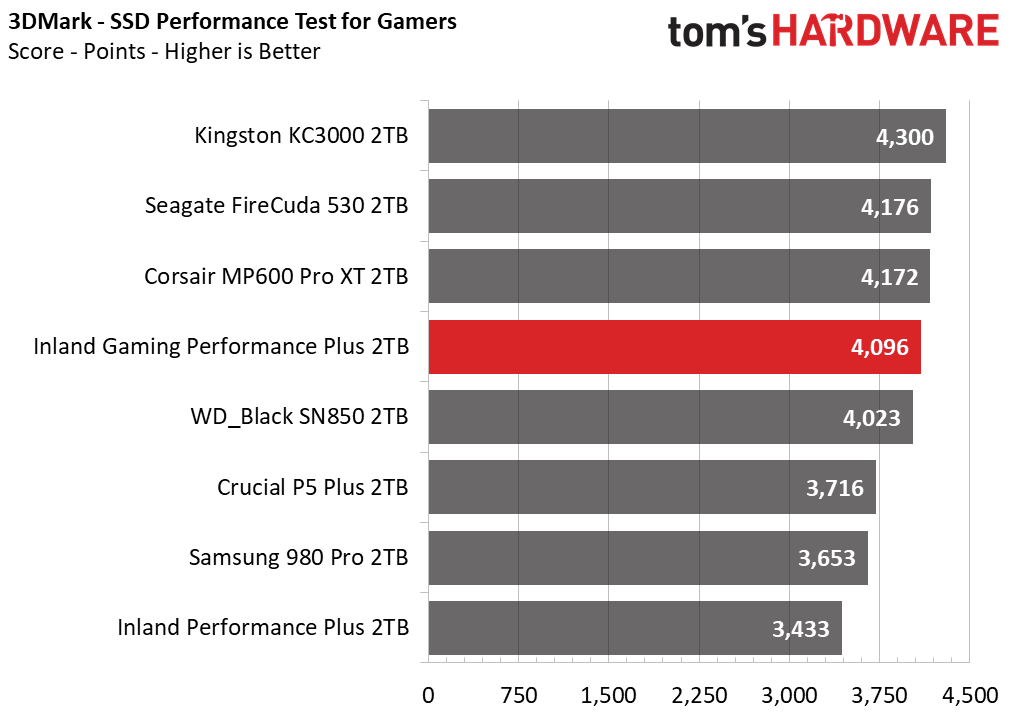
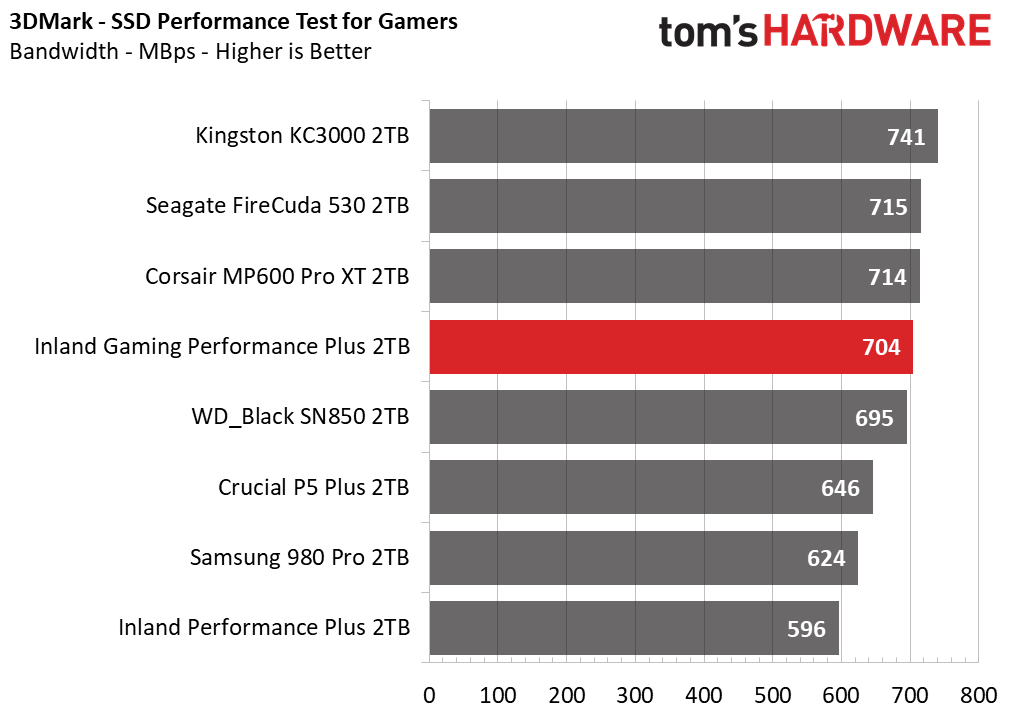
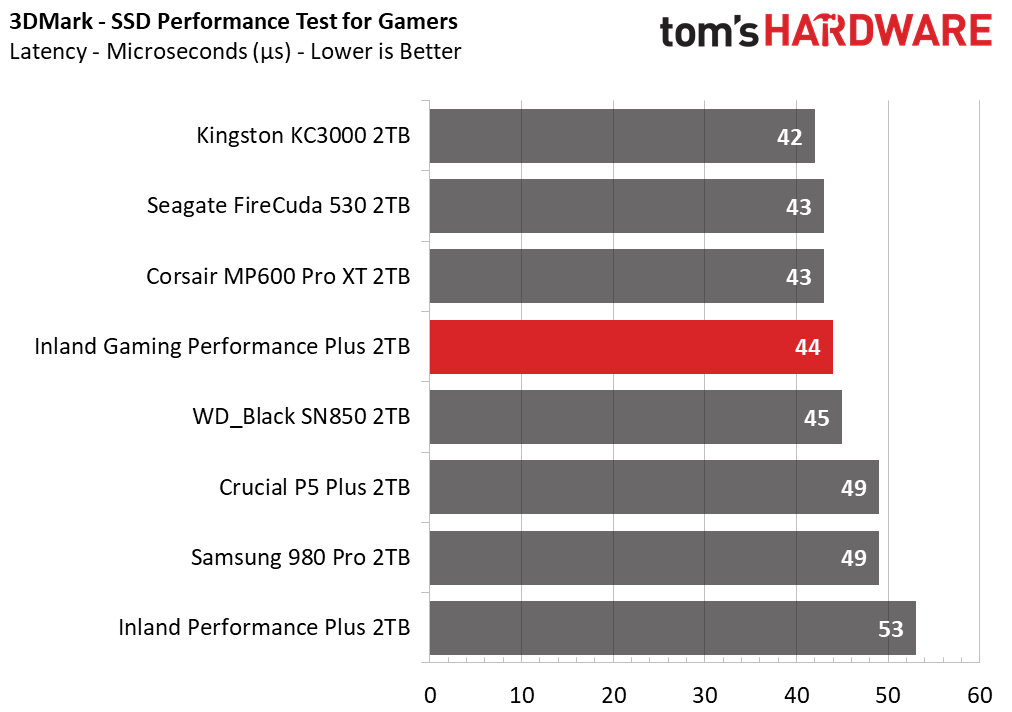
The Gaming Performance Plus performs as expected, near the other Phison E18 + B47R flash drives. Latency on this gaming test is excellent.
Trace Testing – PCMark 10 Storage Benchmark
PCMark 10 is a trace-based benchmark that uses a wide-ranging set of real-world traces from popular applications and everyday tasks to measure the performance of storage devices.
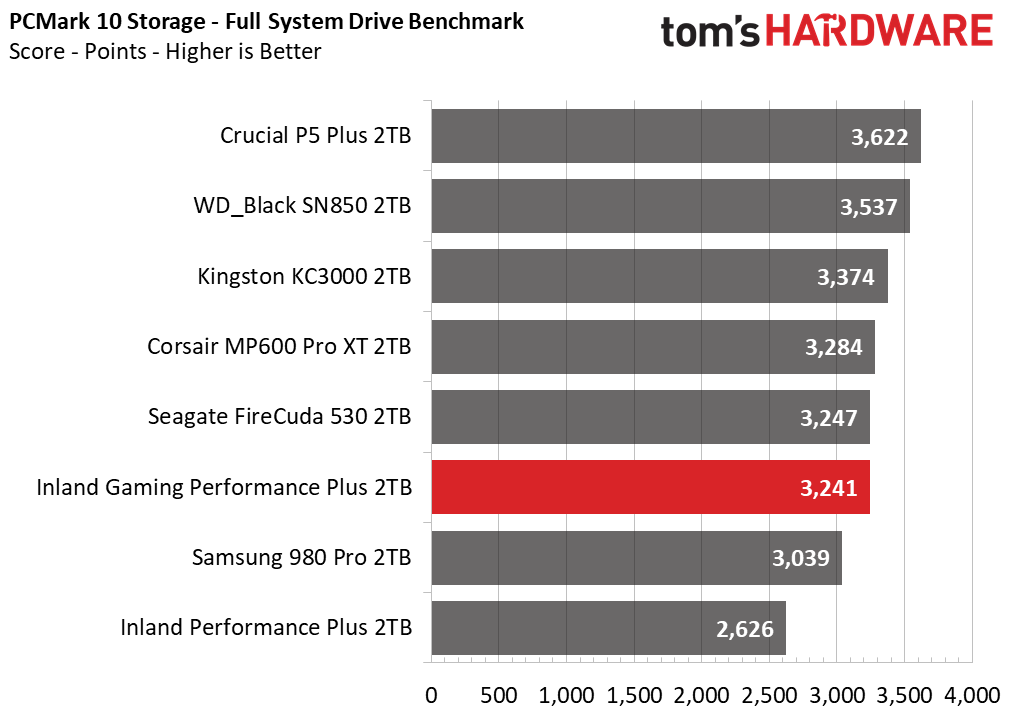
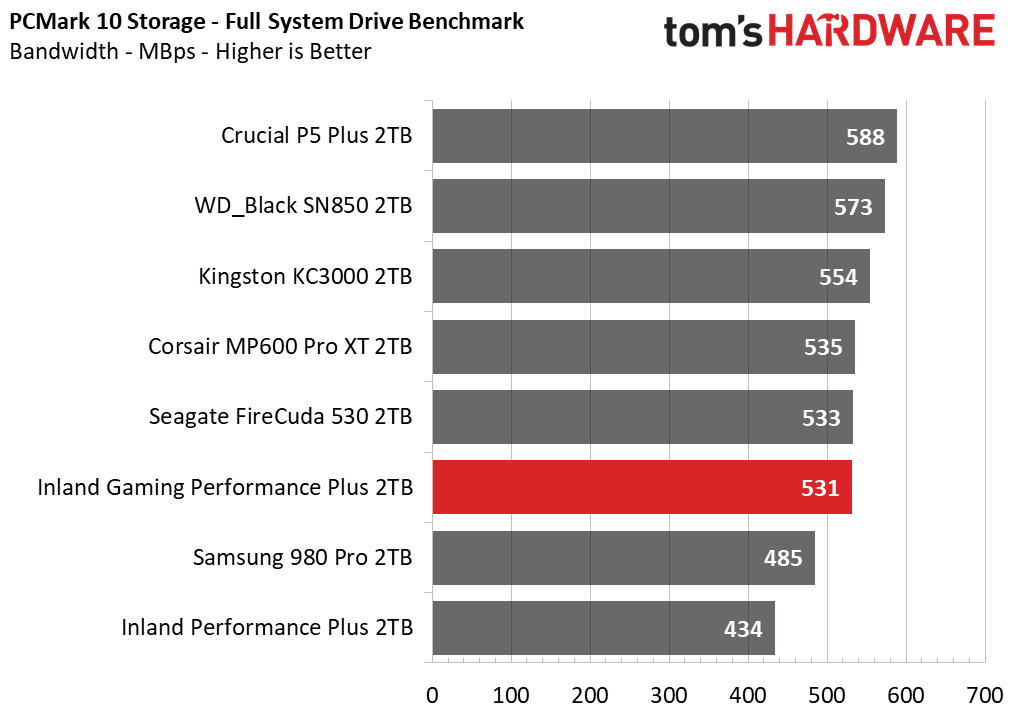
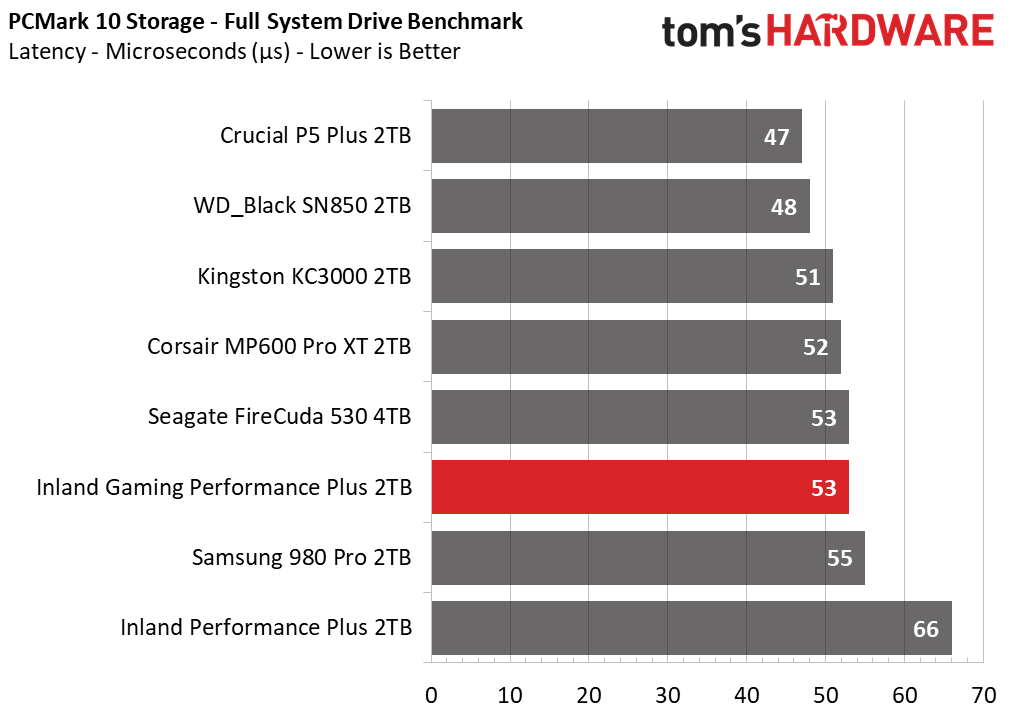
The Gaming Performance Plus again performs close to its hardware peers, although also again at the bottom of the pack among them. This is possibly due to a lack of deeper firmware optimization. However, PCMark 10 promises to reveal 'real-world' performance, and it’s one test where the P5 Plus and SN850 stand out. Likewise, we see the significant edge that 176-layer flash offers over 96-layer, with the previous Performance Plus falling behind, particularly with regard to latency.
Transfer Rates – DiskBench
We use the DiskBench storage benchmarking tool to test file transfer performance with a custom, 50GB dataset. We copy 31,227 files of various types, such as pictures, PDFs, and videos to a new folder and then follow-up with a reading test of a newly-written 6.5GB zip file.
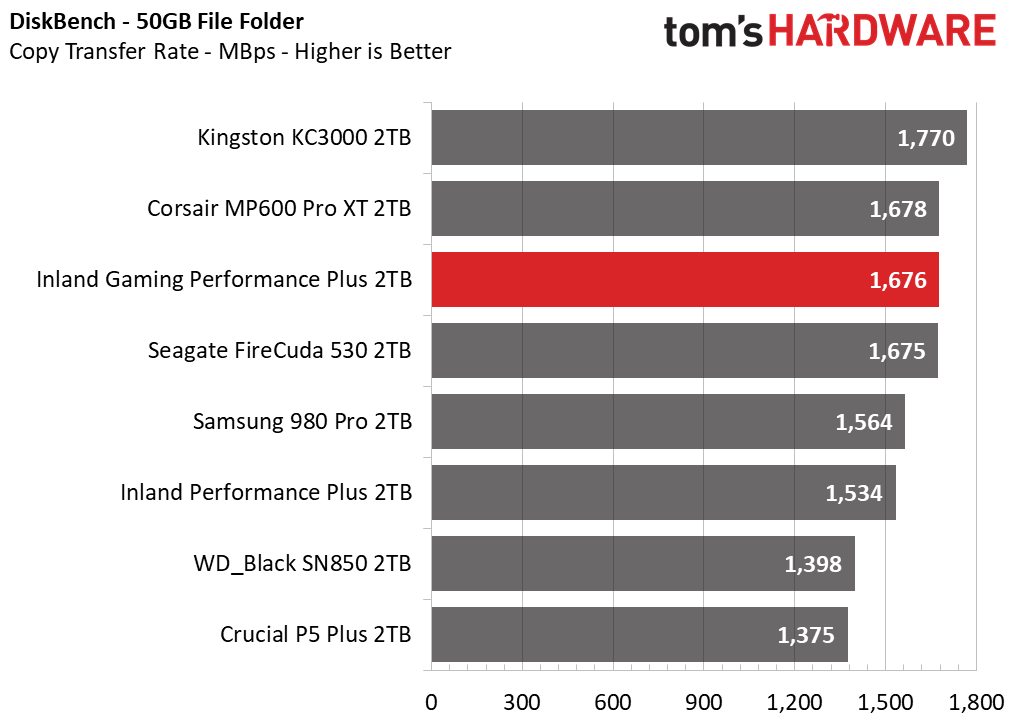
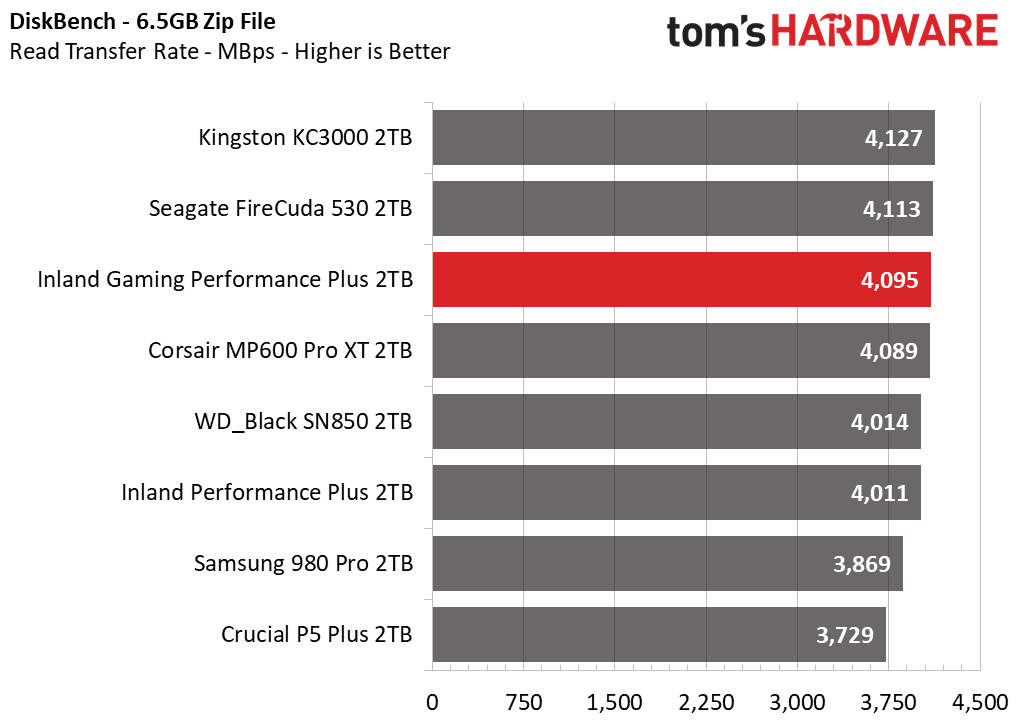
No surprises: Here we see a strong showing from all of the PCIe 4.0 drives, particularly those with the Phison E18 SSD controller. While Micron’s B47R is significantly faster than the older B27B, they have the same amount of planes per die capacity and the SLC mode sequential performance is roughly the same; hence, we don’t see much of a difference here. This is also sufficient capacity to max out interleaving, particularly during read accesses.
Get Tom's Hardware's best news and in-depth reviews, straight to your inbox.
Synthetic Testing - ATTO / CrystalDiskMark
ATTO and CrystalDiskMark (CDM) are free and easy-to-use storage benchmarking tools that SSD vendors commonly use to assign performance specifications to their products. Both of these tools give us insight into how each device handles different file sizes.
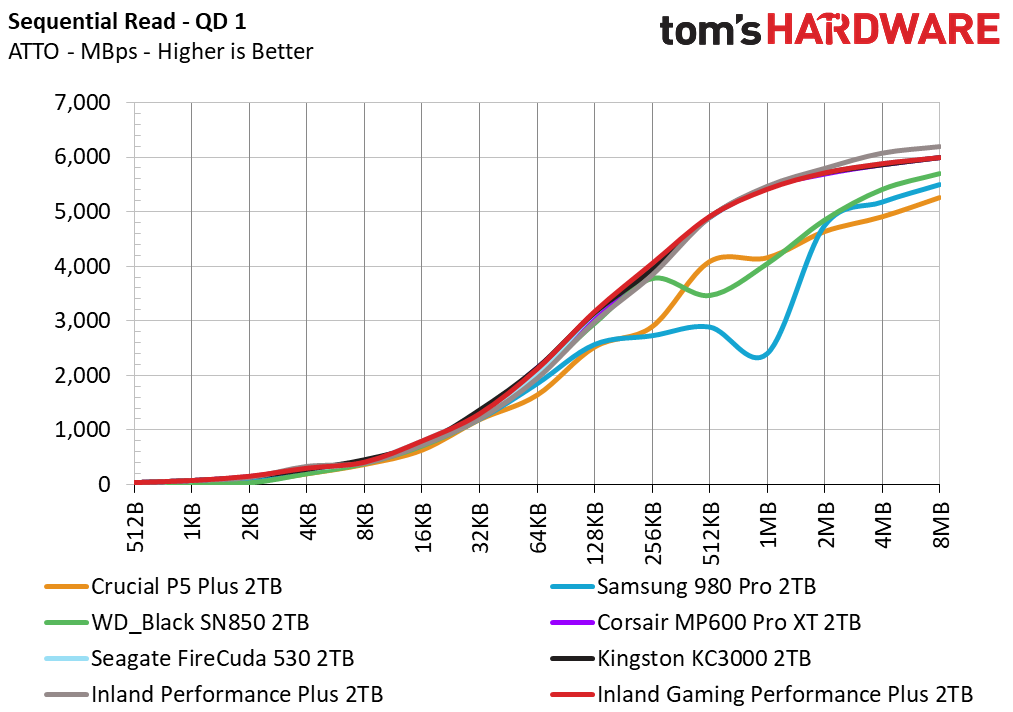
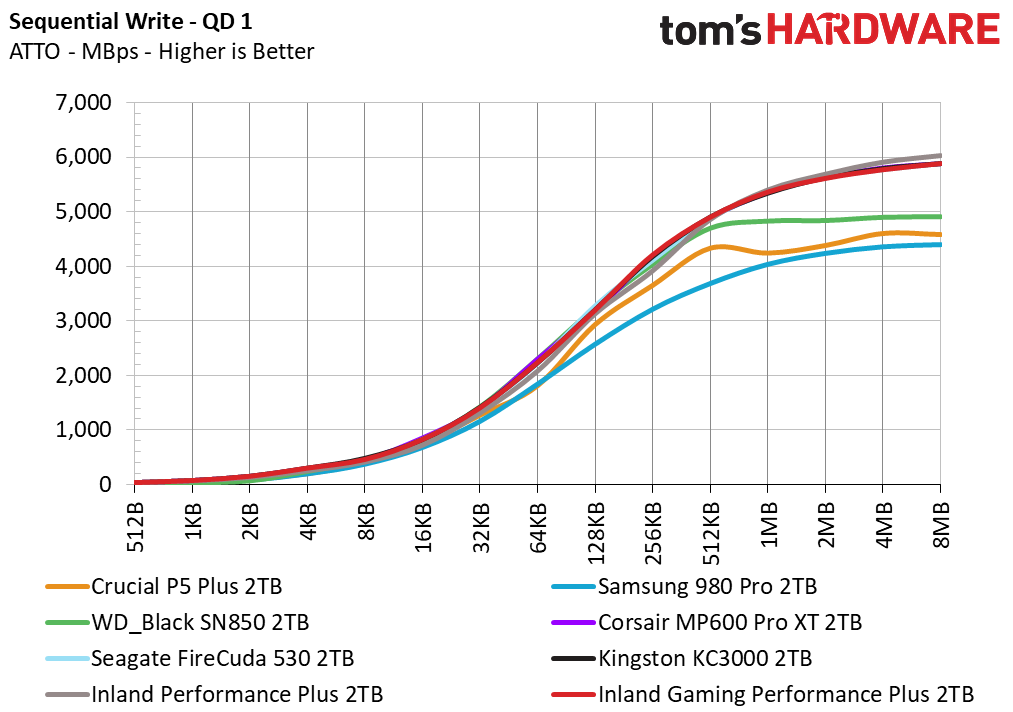
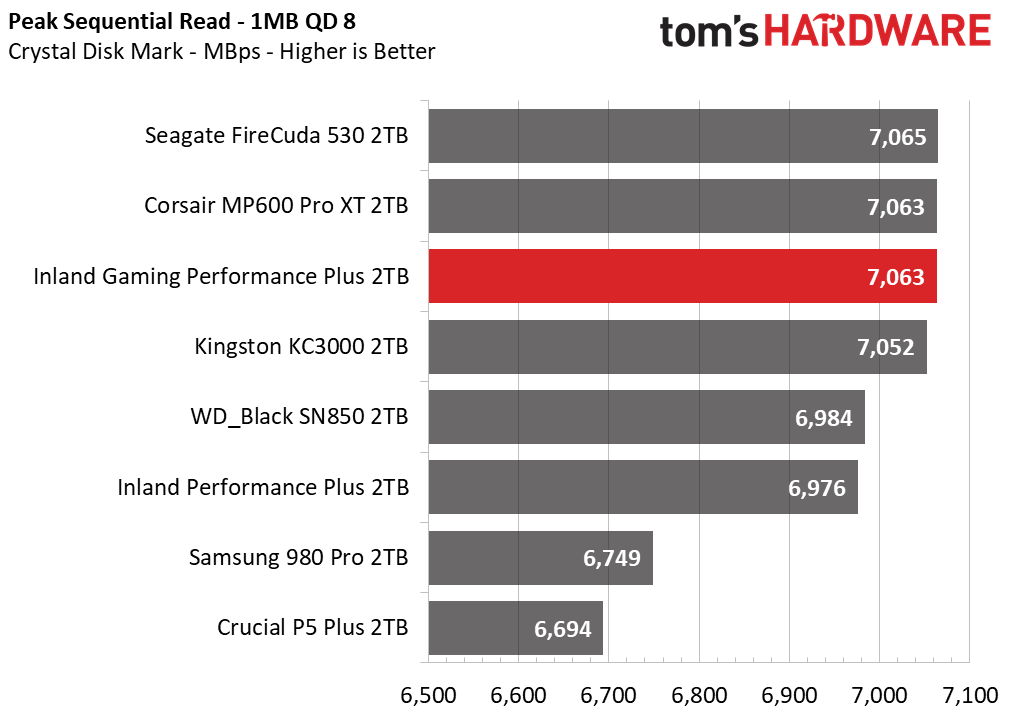
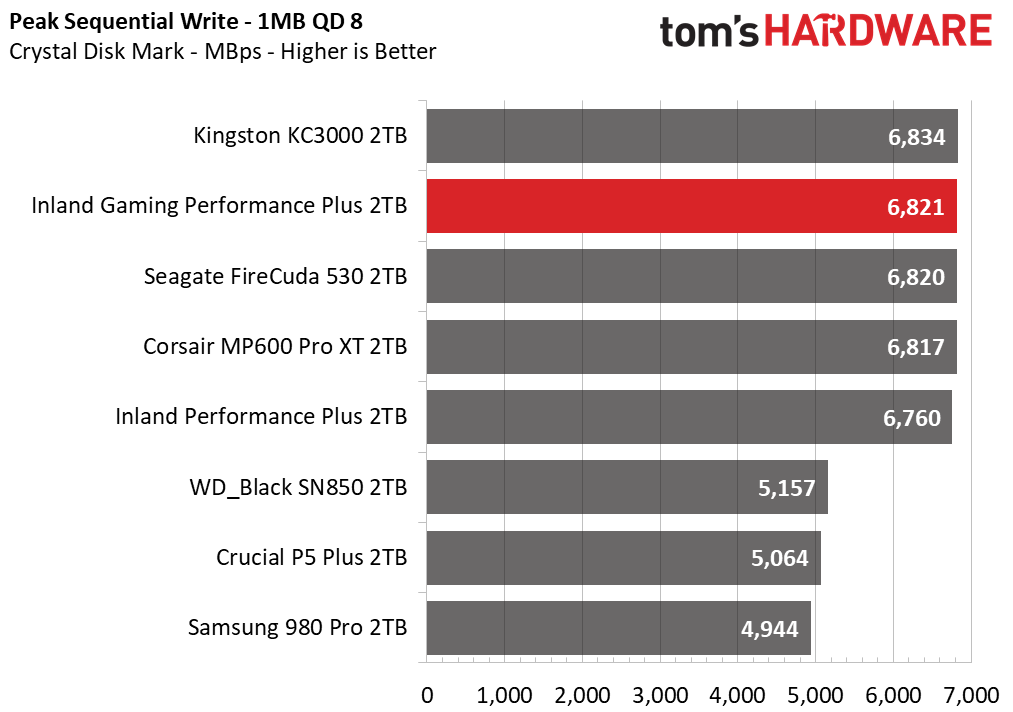
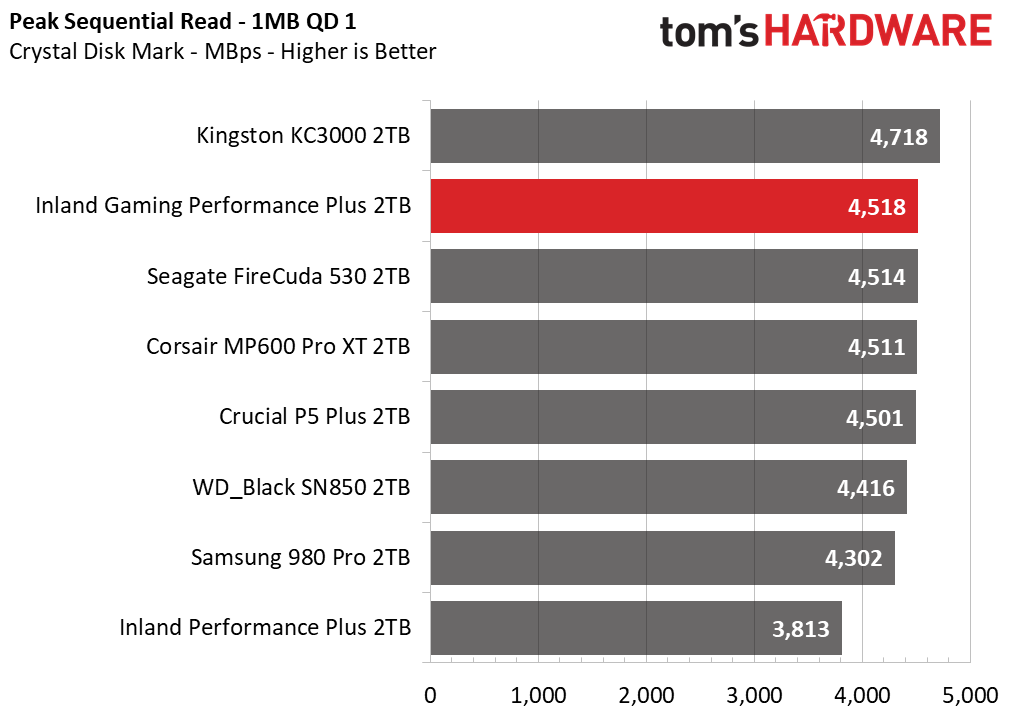
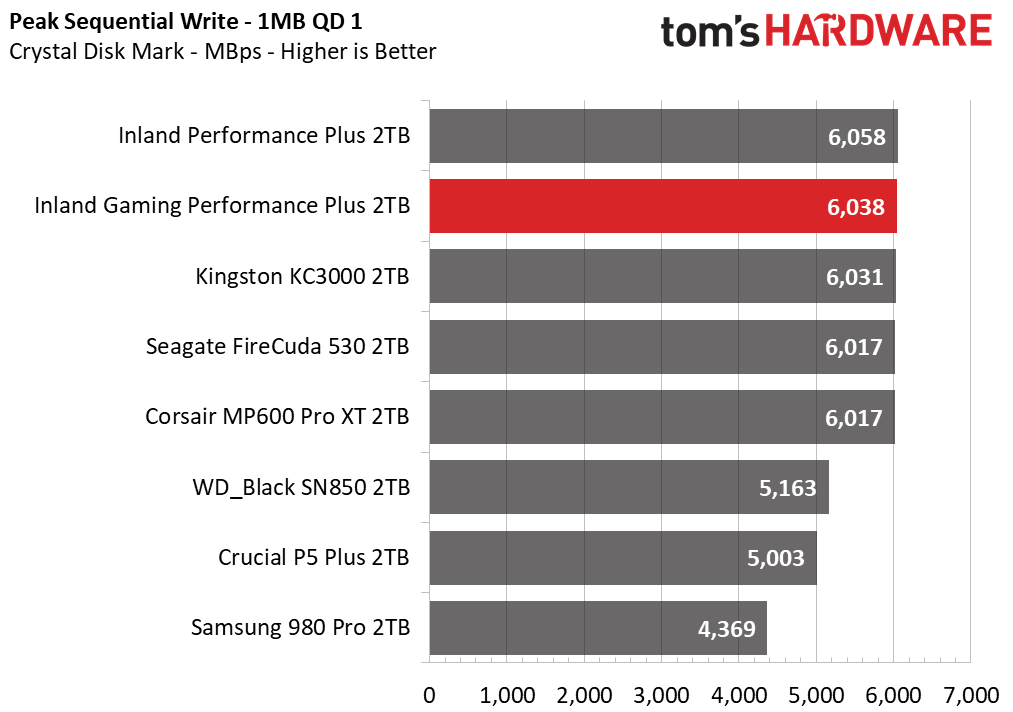
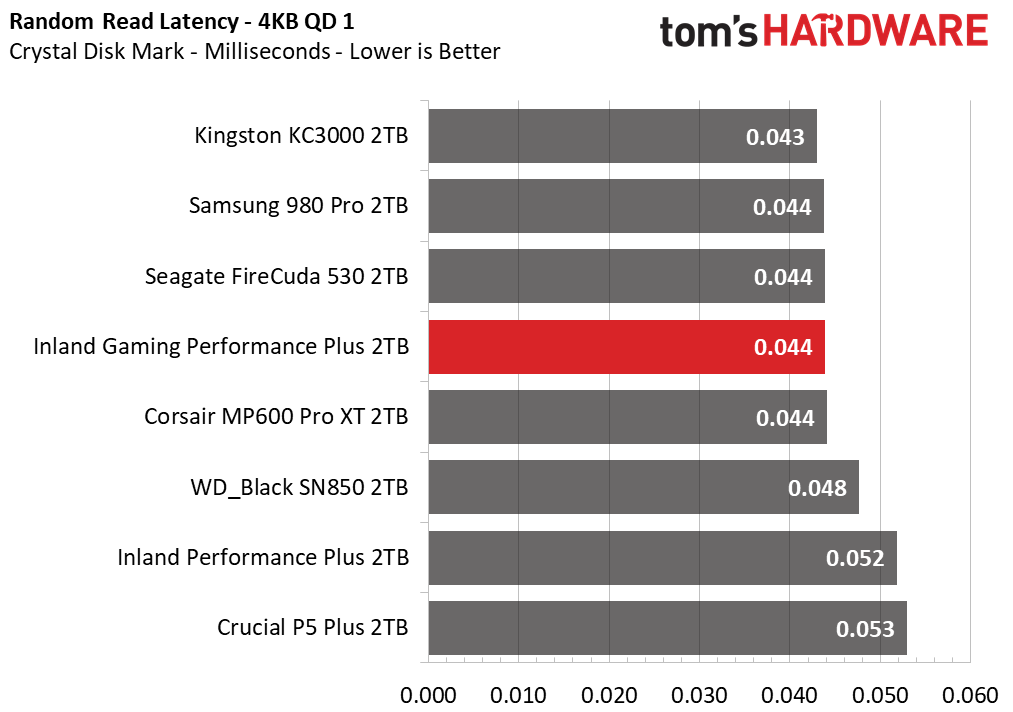
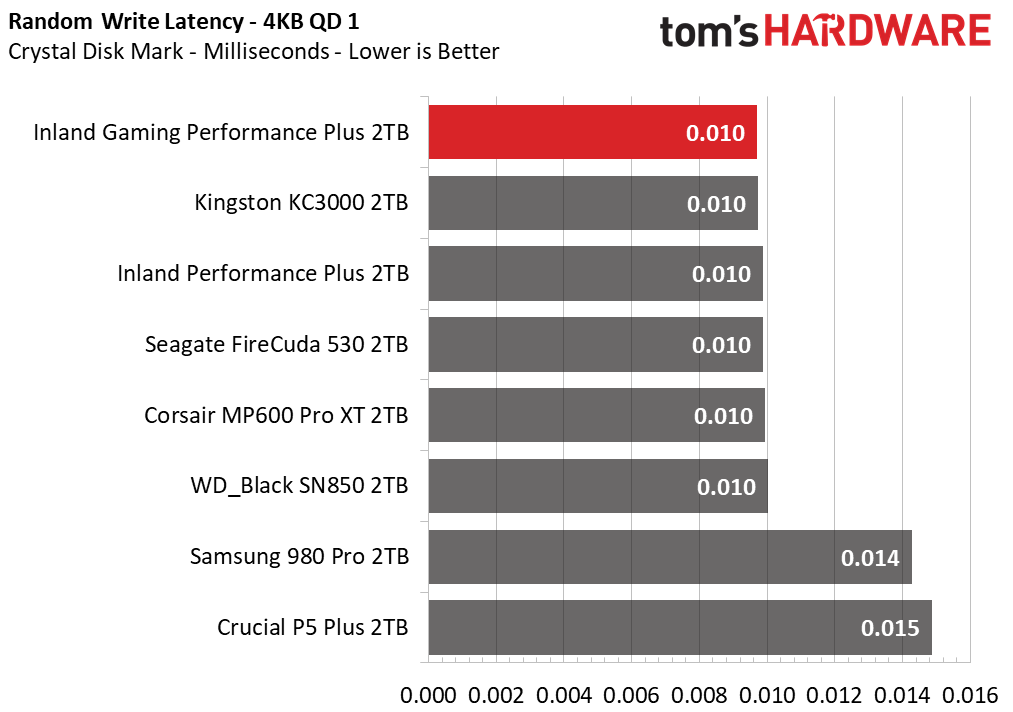
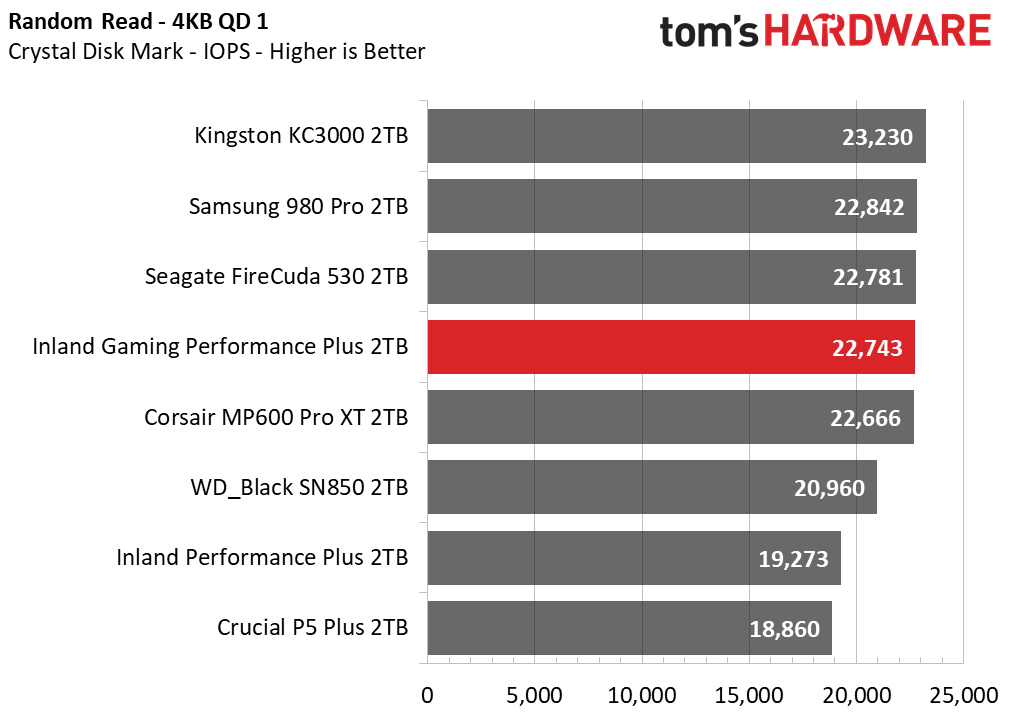
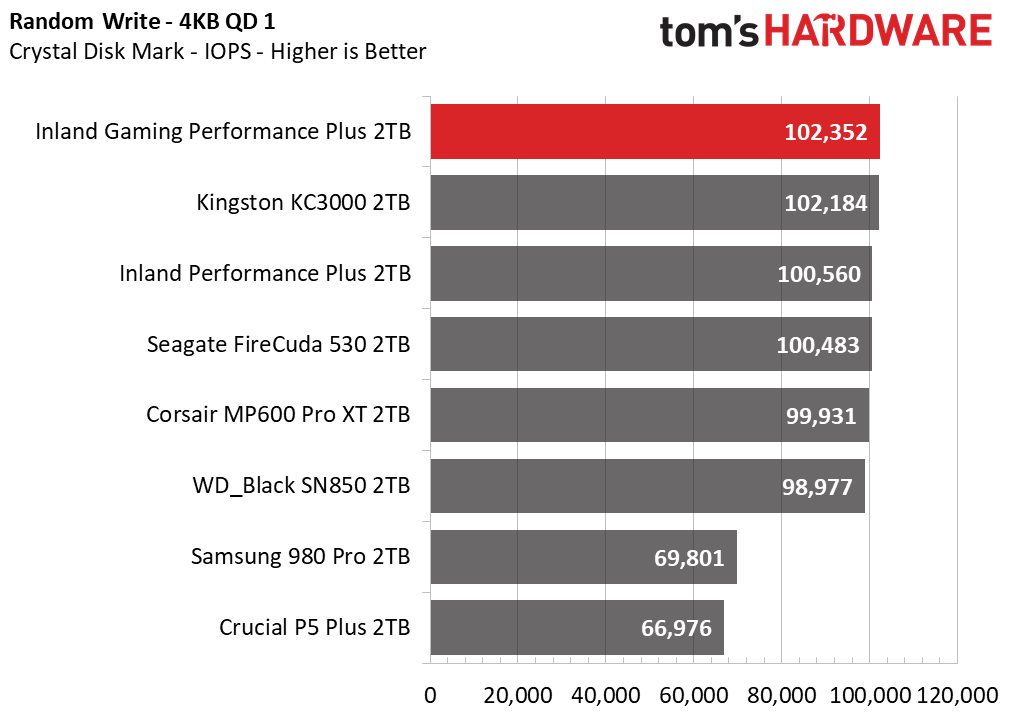
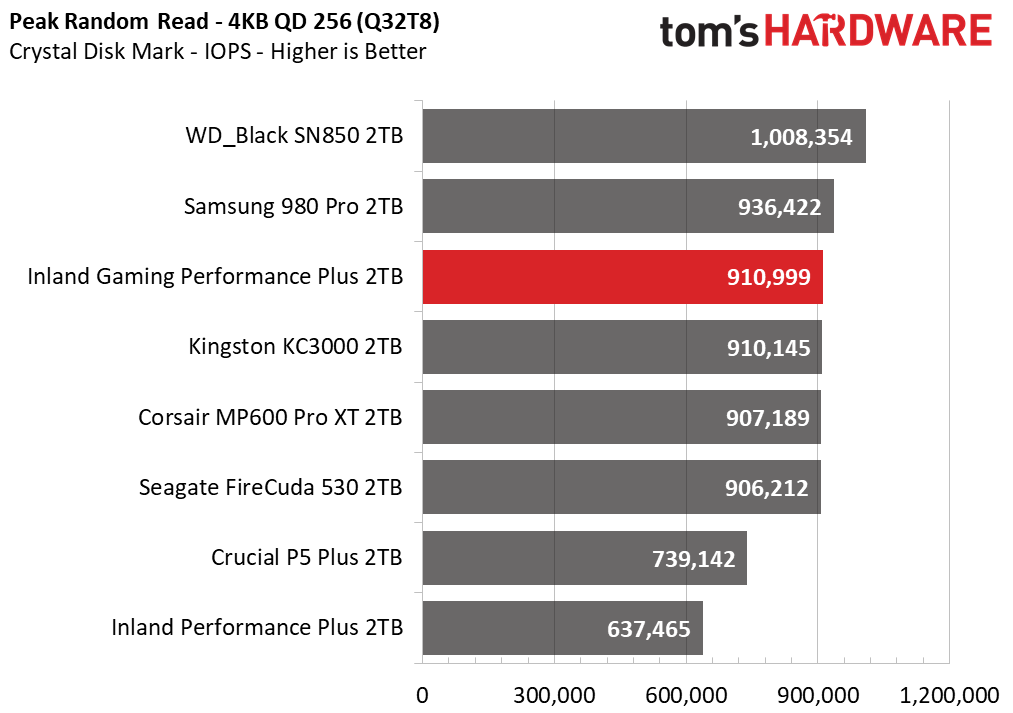
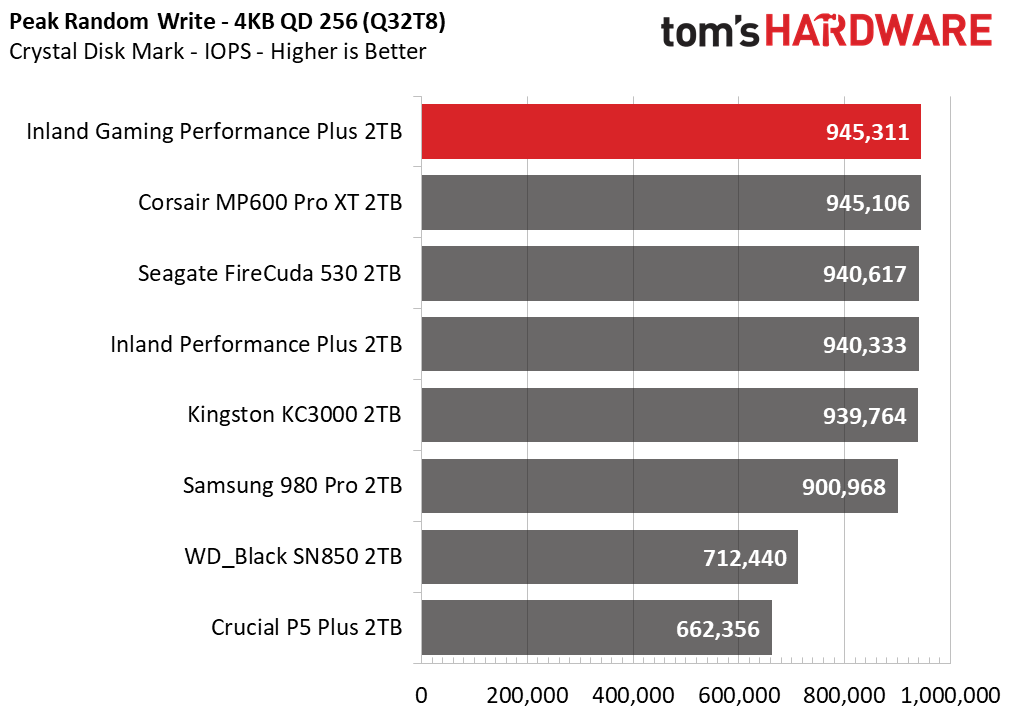
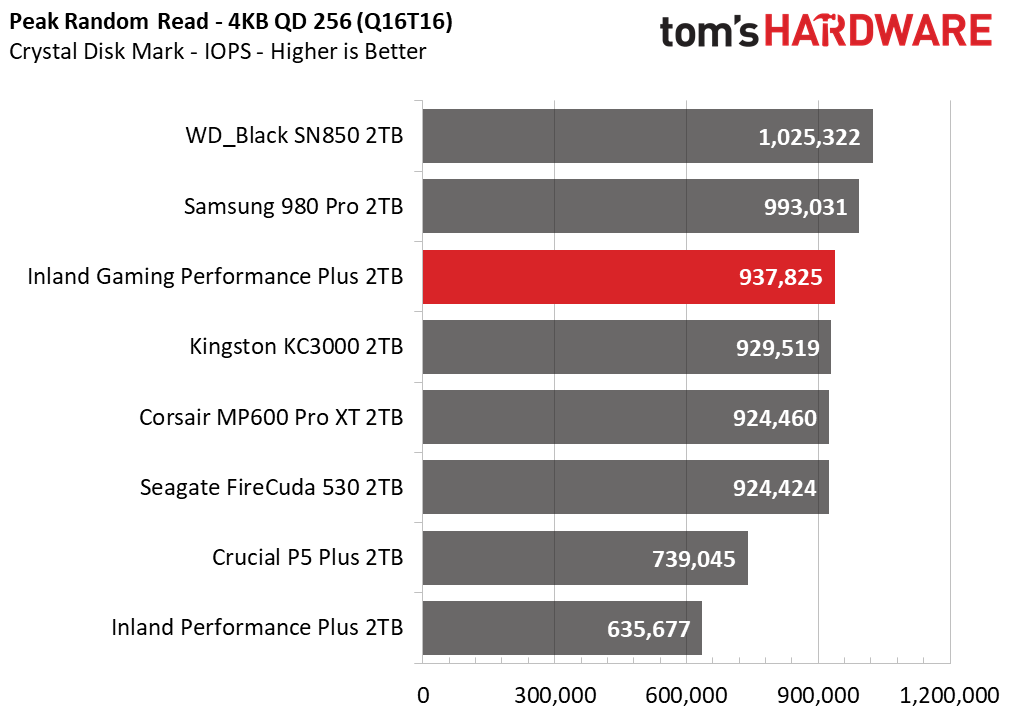
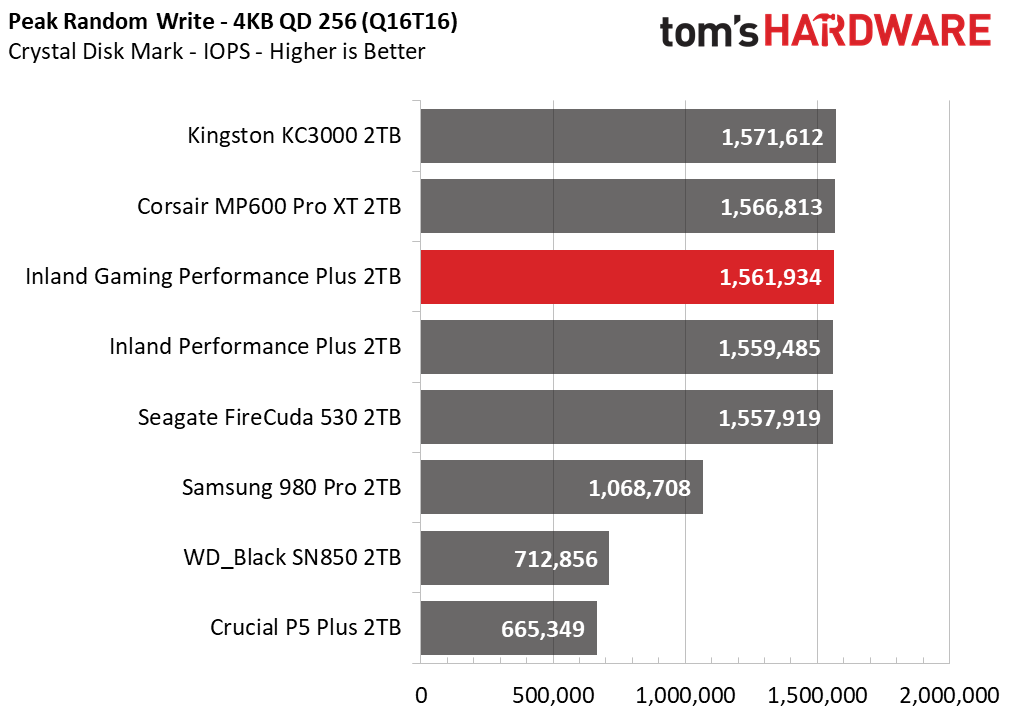
The Gaming Performance Plus performs excellently in CrystalDiskMark (CDM). It also scores high marks in ATTO along with the other E18-based drives, particularly at larger block sizes. Curiously the B27B flash on the Performance Plus does a little bit better, matching what we saw in the Sabrent Rocket 4.0 Plus 2TB review, although that model can now come with B47R. This does not necessarily mean much, although it should be mentioned that adding more layers does have some drawbacks.
Both types of flash use two decks - that is, two separate structures with layers that are bonded together - but there are significantly more layers per deck with B47R. Other architectural differences in flash can impact certain characteristics. For example, Micron changed the geometry of its B27B flash from the original B27A, allowing it to be rated higher in endurance. One reason for this could be the much smaller block size - through fewer pages per block - which corresponds to lower write amplification because garbage collection (GC) and wear-leveling utilize block-level granularity. Changes like this can indirectly impact performance.
Micron’s B47R uses smaller blocks than B27B but also a new type of architecture altogether, albeit still charge trap flash (CTF). Increased layer count brings additional issues which is why dies have to be split into decks; even Samsung, who is the best at etching, will be forced to switch above 200 layers. Likewise, putting peripheral circuitry under the array, which Samsung also has finally done, presents challenges. This is all to say that there are sometimes performance quirks with different flash, although it’s not clear if the result above is just due to an E18 firmware relic.
Sustained Write Performance and Cache Recovery
Official write specifications are only part of the performance picture. Most SSDs implement a write cache, which is a fast area of (usually) pseudo-SLC programmed flash that absorbs incoming data. Sustained write speeds can suffer tremendously once the workload spills outside of the cache and into the "native" TLC or QLC flash. We use Iometer to hammer the SSD with sequential writes for 15 minutes to measure both the size of the write cache and performance after the cache is saturated. We also monitor cache recovery via multiple idle rounds.
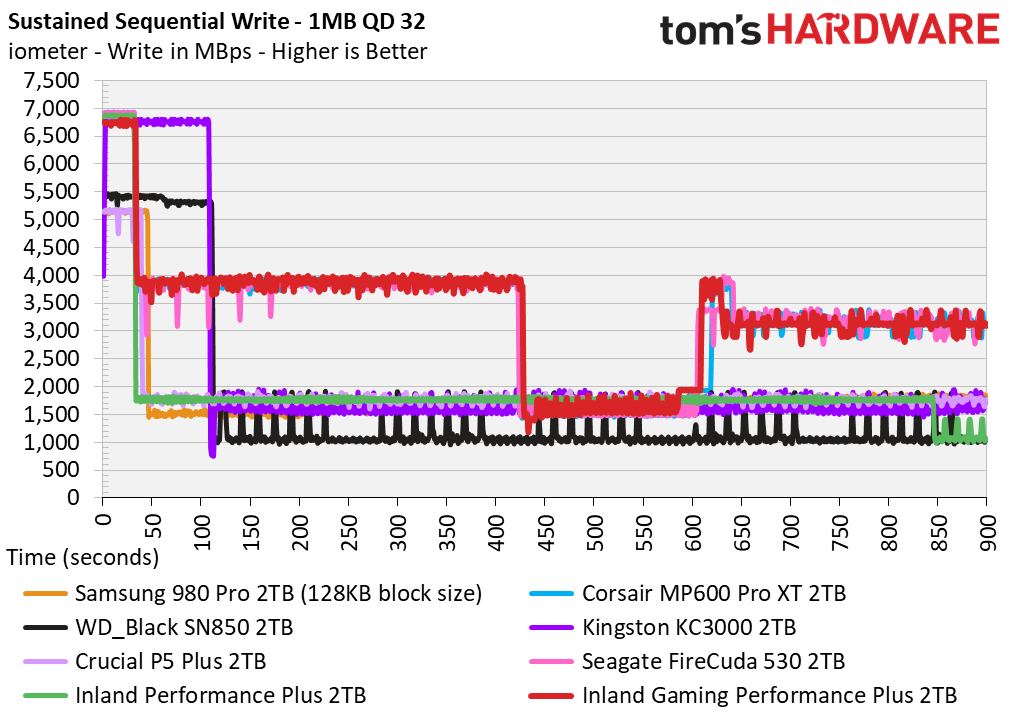
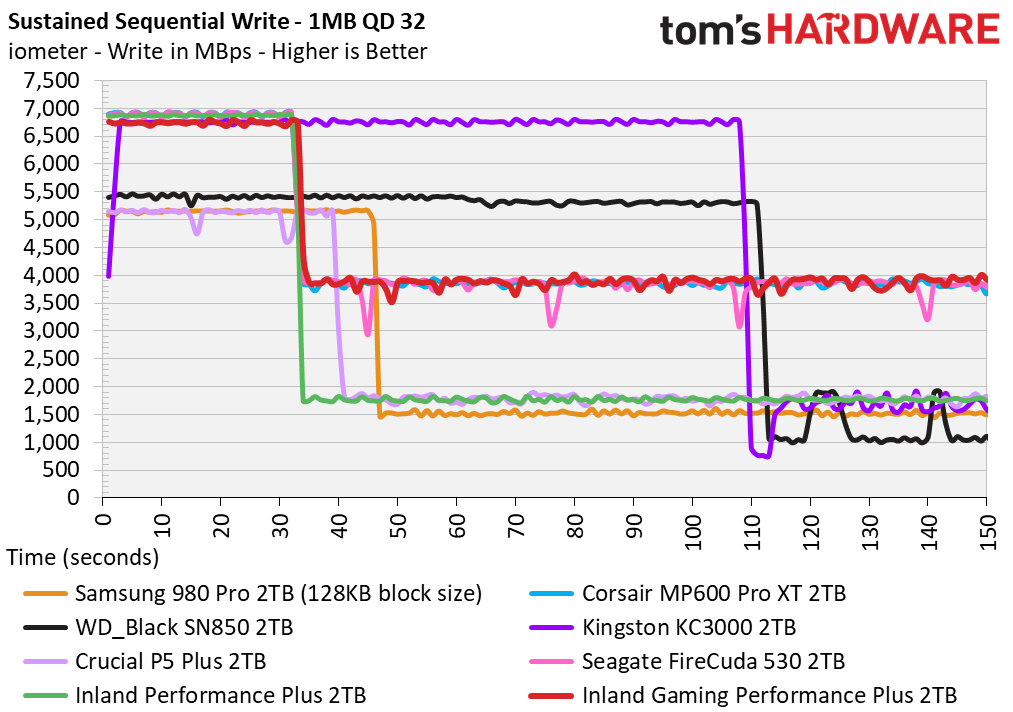
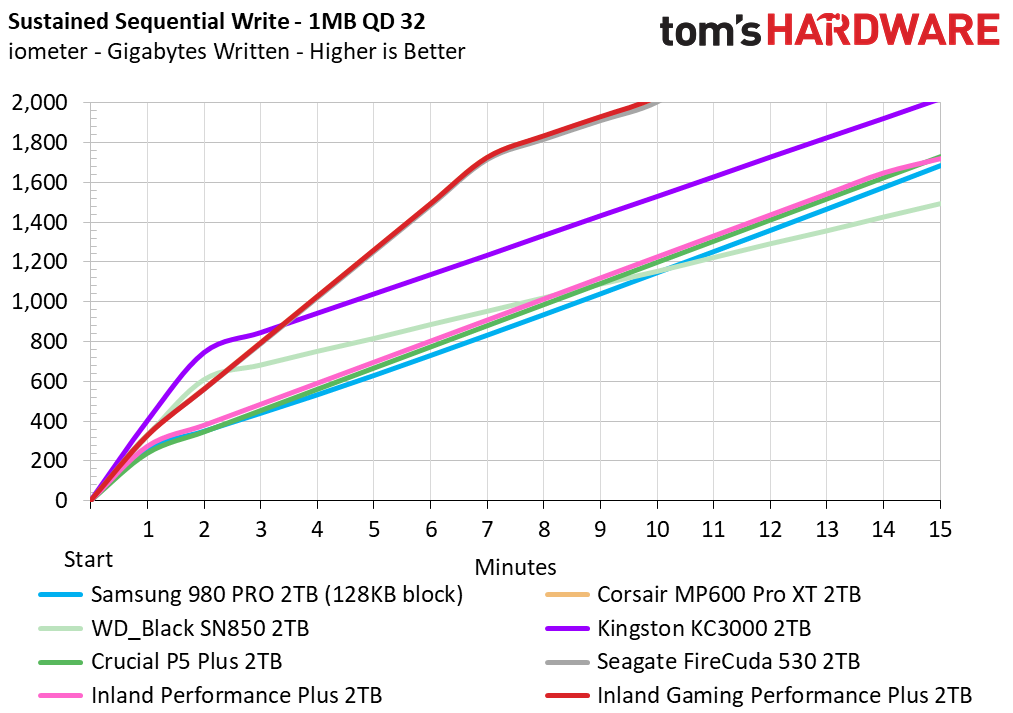
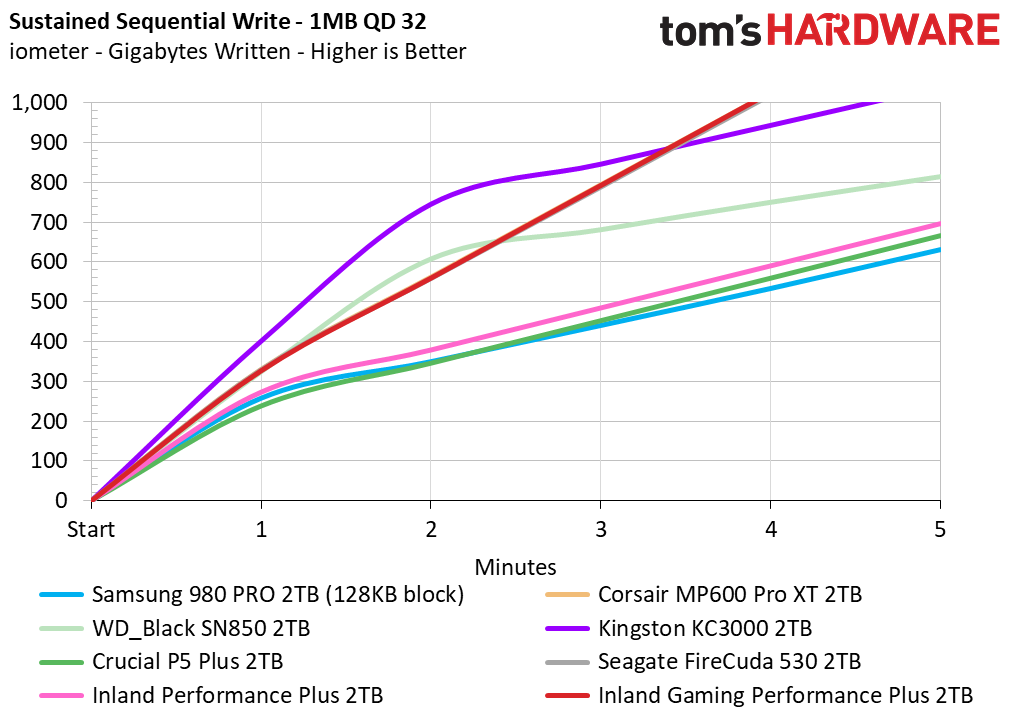
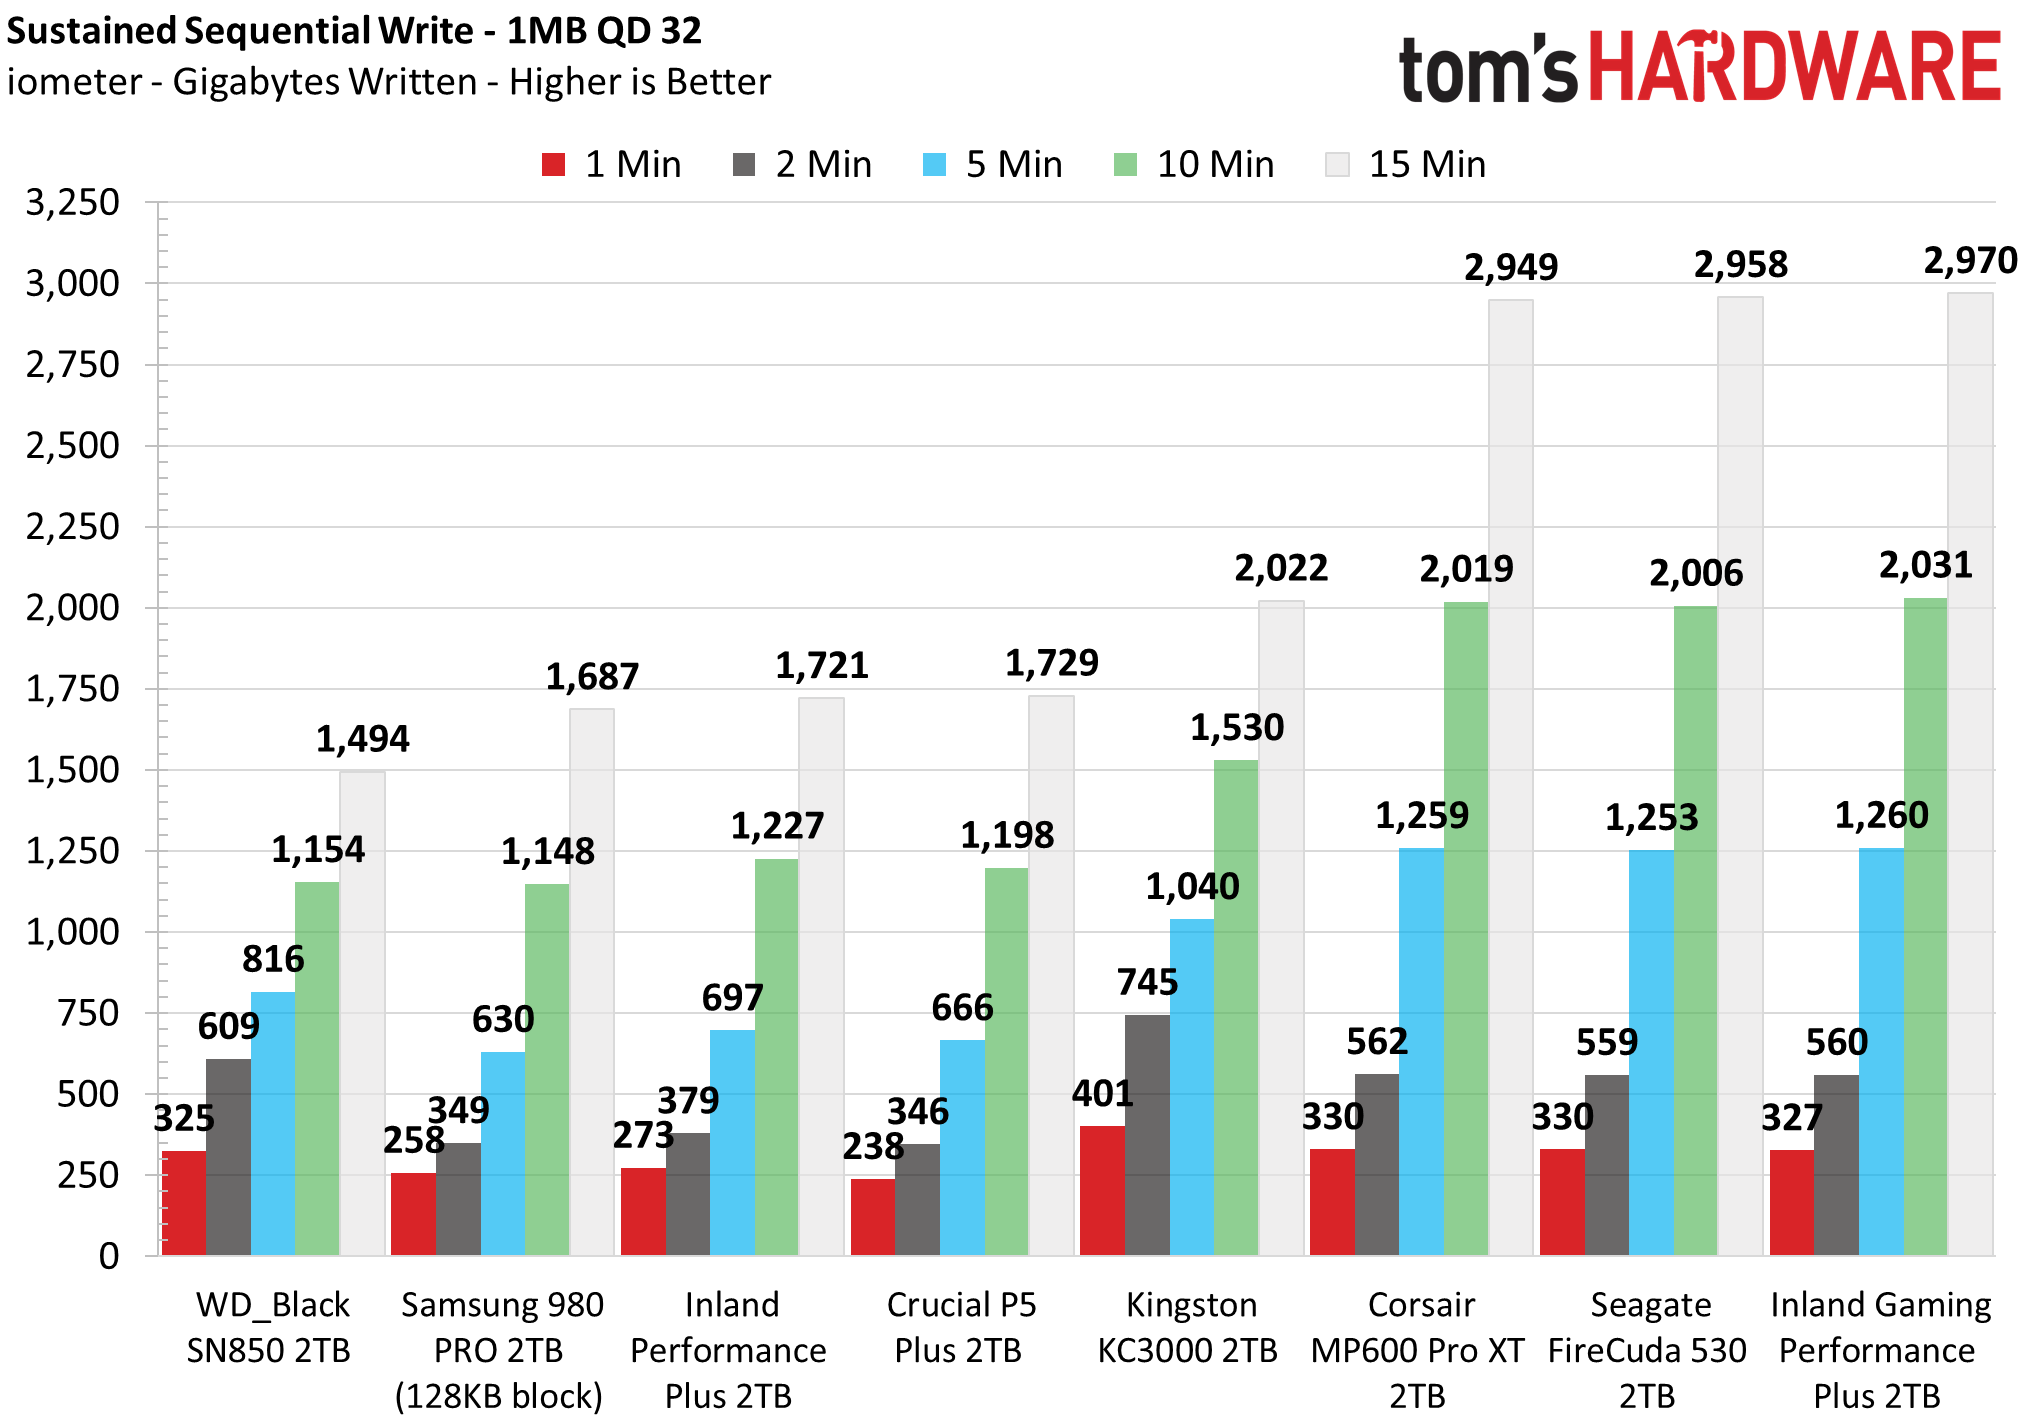
The Game Performance Plus SLC caching scheme is reminiscent of the one seen in the FireCuda 530, MP600 Pro XT, and A440 Pro (not shown). While the A440 Pro had lower direct-to-TLC speeds in our recent review, thanks to Team allocating lower-tier flash in our original test sample, the overall scheme remained more consistent. We also see that with Gaming Performance Plus and the other listed drives.
Our first performance tier lands in the SLC cache for a bit more than 30 seconds, which at 6.8 GBps indicates a cache of 220 or more GB, followed by a long but fast direct-to-TLC writing phase. The final, slowest tier is when bottlenecking occurs, as incoming writes must wait for folding to occur in order to free up space.
Many users buy PCIe 4.0 drives specifically for bandwidth, and burst bandwidth, in particular, is popular. For that reason, many drives have very large SLC caches, such as the Kingston KC3000 and Fury Renegade drives. Full-drive SLC caching, as on those two drives, offers the largest SLC cache possible, but there are many caveats with such a caching scheme. The cache still shrinks as the drive is filled, and, further, post-SLC performance can be quite poor. It’s nice to have options that promise a bit more consistency, which is particularly true with hybrid caching schemes — that is, drives that use both static and dynamic SLC, as with Samsung’s TurboWrite 2.0 on the 980 Pro.
Alternatively, the dynamic SLC cache can be more limited in size, which offers a more consistent compromise between static-only, such as on the SN750, for example, and full-drive SLC caching. This is particularly nice with the E18 and B47R flash because you can get some seriously strong TLC performance. While this is demonstrated well in this sustained sequential write test, such performance is also reflected in fuller-drive tests that track latency. In many cases, users might complain of a poor user experience with DRAM-less and QLC-based drives in that edge case, but B47R is also significantly faster than previous generations of flash in other metrics.
This all means that a drive like the Gaming Performance Plus not only offers astounding peak performance but also has a good balance of consistency and endurance — keeping in mind that dynamic SLC can introduce additive wear. In any case, such things tend not to make much difference for consumer usage, especially for gaming. That being said, a premium drive like this could end up being used for more serious tasks down the line.
While the Gaming Performance Plus did not recover the cache in our idle phase, much like the FireCuda 530 and MP600 Pro XT, the high direct-to-TLC performance ensured we could still retain reasonable write performance.
Power Consumption and Temperature
We use the Quarch HD Programmable Power Module to gain a deeper understanding of power characteristics. Idle power consumption is an important aspect to consider, especially if you're looking for a laptop upgrade as even the best ultrabooks can have mediocre storage.
Some SSDs can consume watts of power at idle while better-suited ones sip just milliwatts. Average workload power consumption and max consumption are two other aspects of power consumption, but performance-per-watt is more important. A drive might consume more power during any given workload, but accomplishing a task faster allows the drive to drop into an idle state more quickly, ultimately saving energy.
We also monitor the drive’s temperature via the S.M.A.R.T. data and an IR thermometer to see when (or if) thermal throttling kicks in and how it impacts performance. Remember that results will vary based on the workload and ambient air temperature.
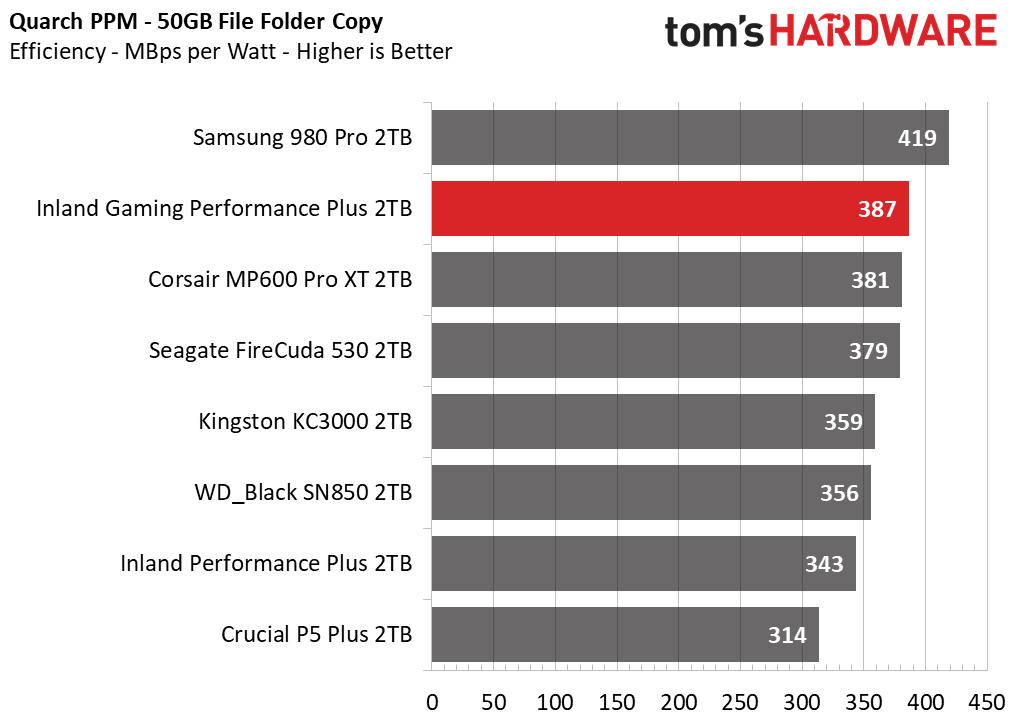
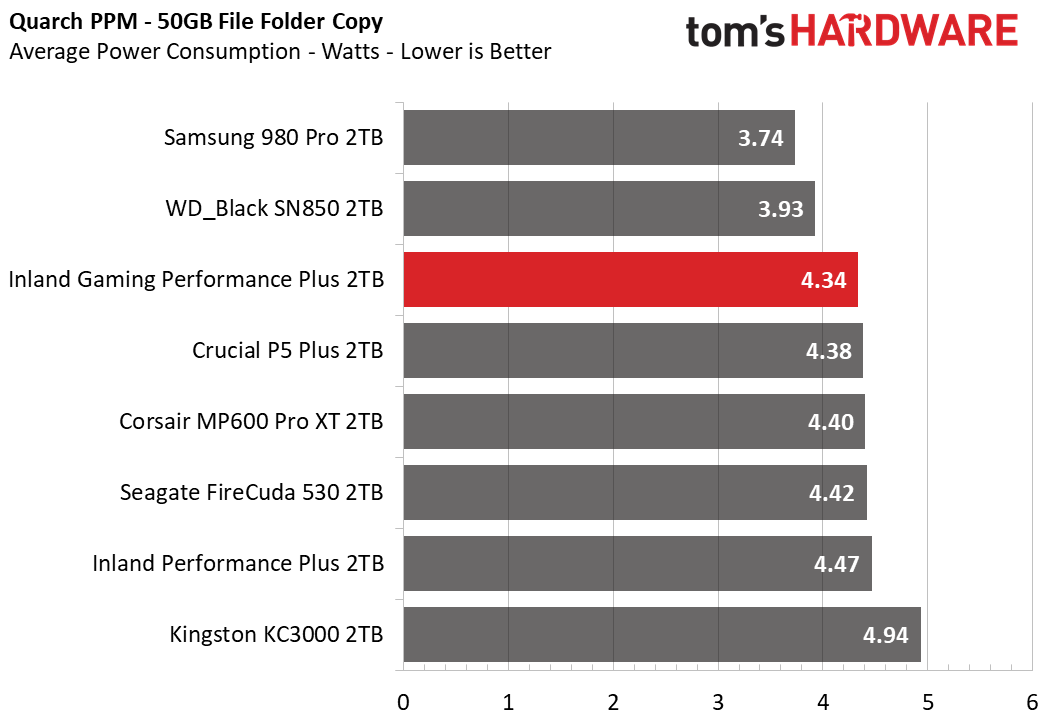
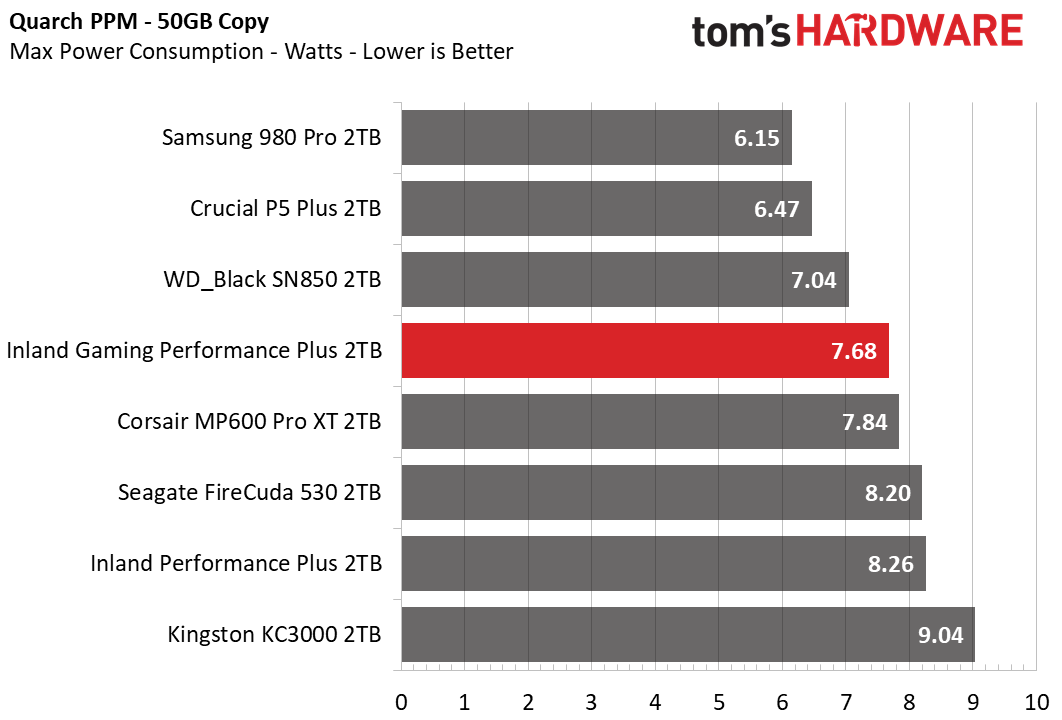
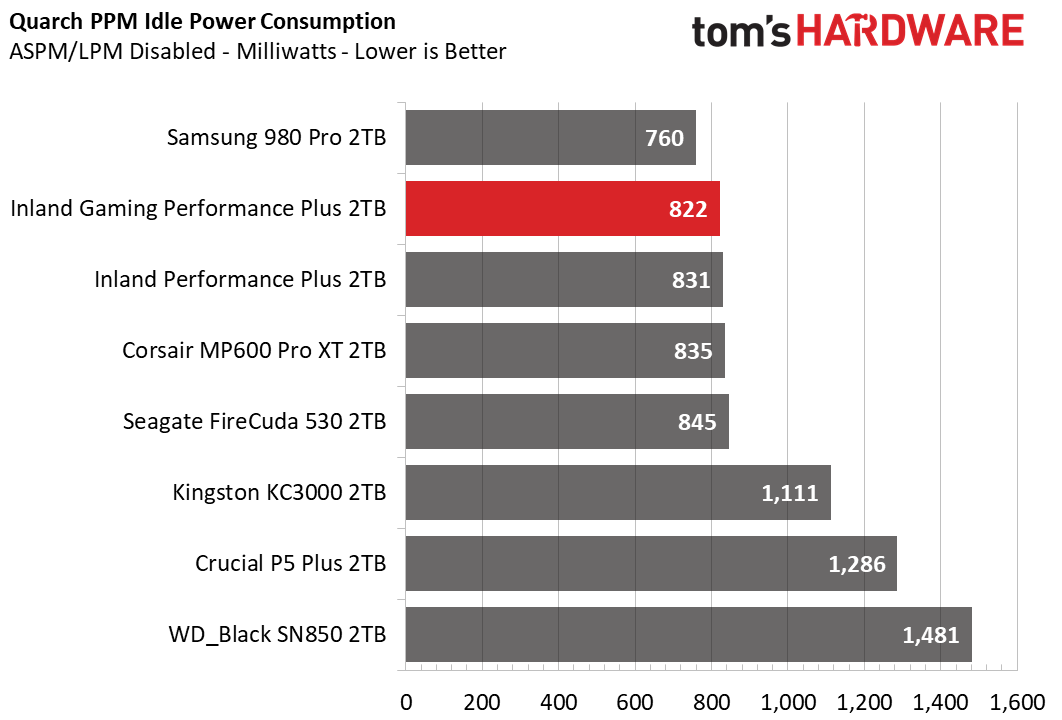
Power consumption is one of those things that many people ignore for various reasons, but it’s becoming more important over time as components get both more powerful and more intelligent. GPUs are certainly pushing new limits, but SSDs are also hitting the edge as they move towards PCIe 5.0. Luckily, controllers made in a smaller process node and the gains made with higher layer-count NAND ensure things remain reasonable for consumer drives.
The Gaming Performance Plus does extremely well here, thanks to its 12nm controller and 176-layer flash. It clearly outperforms the older Performance Plus, which utilizes 96-layer flash, although notably, both types of flash utilize CMOS-under-Array (CuA) technology which improves power efficiency. The SN850 with 96-layer BiCS4 does not, but WD’s proprietary controller tech - typically the controller is labeled SanDisk - has a history of solid efficiency. We see that Phison’s focus on scalability pays off versus the more complex design utilized in the P5 Plus, albeit performance optimizations on the two controllers are different.
The drive also has a decent if understated heatsink, which keeps the drive cool even under sustained load. Sometimes, simple is better. Temperatures were kept below 70C, and we saw no throttling.
Test Bench and Testing Notes
| CPU | Intel Core i9-11900K |
| Motherboard | ASRock Z590 Taichi |
| Memory | 2x8GB Kingston HyperX Predator DDR4 5333 |
| Graphics | Intel UHD Graphics 750 |
| CPU Cooling | Alphacool Eissturm Hurricane Copper 45 3x140mm |
| Case | Streacom BC1 Open Benchtable |
| Power Supply | Corsair SF750 Platinum |
| OS Storage | WD_Black SN850 2TB |
| Operating System | Windows 10 Pro 64-bit 20H2 |
We use a Rocket Lake platform with most background applications such as indexing, windows updates, and anti-virus disabled in the OS to reduce run-to-run variability. Each SSD is prefilled to 50% capacity and tested as a secondary device. Unless noted, we use active cooling for all SSDs.
Conclusion
On the whole, there’s very little not to like about this drive. It’s tempting to give it a bit of a lower score, but honestly, as we stated above, it’s kind of nice that the SSD market has gotten to a place where you can easily find a reliable, premium drive like this, including something you can actually buy in person. While most people would be better served with something cheaper, whether entry-level PCIe 4.0 for a console or high-end PCIe 3.0 for the PC, it’s nice to have this option.
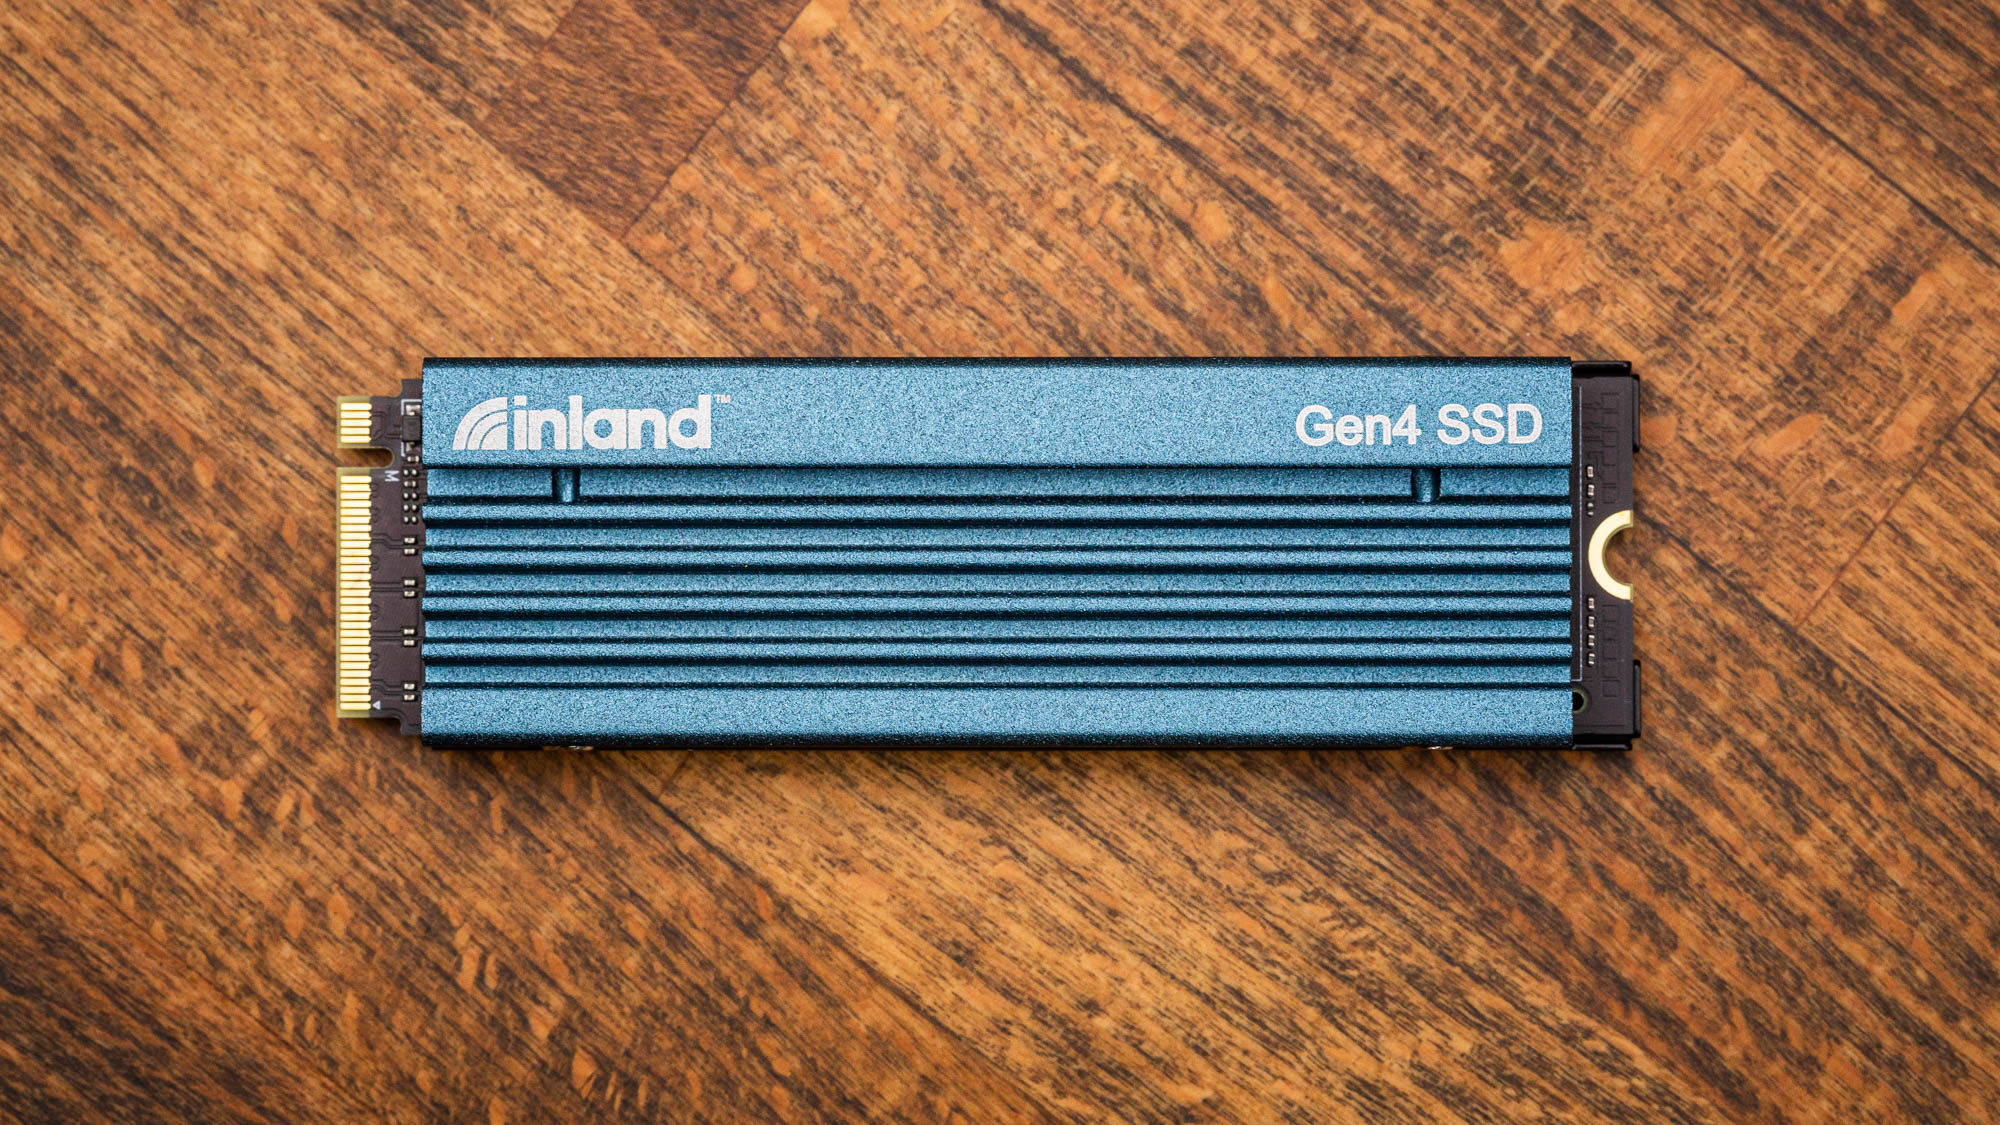
The Inland Gaming Performance Plus 2TB SSD offers high performance and minimum frills but is made more attractive by its six-year warranty, availability at brick and mortar outlets, and cool-running design. While it has no software and the heatsink design is aesthetically conservative, it meets all the criteria of a gaming drive — including, of course, PS5 compatibility.
Performance is on par with what we expect from the Phison E18 when paired with Micron’s very fast 176-layer B47R TLC flash. This includes strong efficiency, which, while not super important, helps keep the drive run cool. The SLC cache is on the conservative side, which largely makes sense as games tend to be read- rather than write-heavy. While files and games may be copied drive to drive, even over very fast PCIe 4.0, the TLC speeds are fast enough to get the job done. If used for heavier workloads, particularly with a fuller drive, this also means more consistent performance in general.
Our main complaints would be pricing and software support. Users popping this into a PS5 do not require software, and such support is largely unnecessary, although some users like to see cloning software with their drives. As for the price: this market segment is becoming crowded and competitive, plus prices are falling. There will be sales, and this is probably worth the premium for people picking it up from a physical store on a whim, though.
MORE: Best SSDs
MORE: How We Test HDDs And SSDs
MORE: All SSD Content

Shane Downing is a Freelance Reviewer for Tom’s Hardware US, covering consumer storage hardware.
-
DonQuixoteIII Hmm... Cash for comments? Well, gotta pay the bills somehow.Reply
This is a mediocre SSD both in performance and longevity, priced at the upper end. Glowingly praised by the author, and sporting the big bucks moniker 'Gaming'. -
WrongRookie Inland...this company is only US based isn't it? Because from my area, Inland is never brought up.Reply
Honestly, from a glimpse of the review, there is still not a lot to talk about when an average joe is better off getting KingstonKC3000 , WD750 Black or 980 Pro for that price.
Now if this was the KingstonA2000 of gen 4, that would be different. -
Sleepy_Hollowed This is quite the interesting drive.Reply
Considering that it's a drive for a console, is there any chance to include power-loss protection tests on these reviews?
I'm only mentioning this because since it's not mentioned, I'm assuming it's not supported, and recently there were some tests even on drives that announce they provide some protection, but they really don't.
While this is not a big deal if Sony managed to consider this on their OS (which I hope they did!), some of us living in places with power outages might want to know.
For example, on the PS4 I bought an SSD certified for power loss protection that I had tested on my PCs.