Intel SSD 760p Review: The New NVMe Value Leader
Why you can trust Tom's Hardware
256GB And 128GB Class Performance
Comparison Products
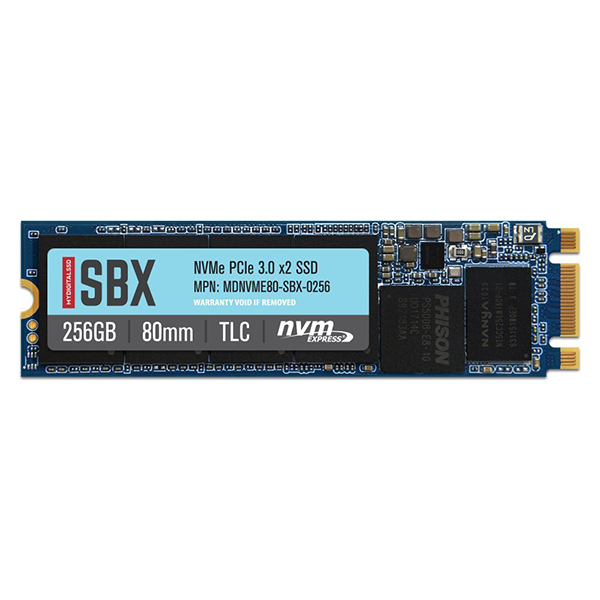
We're focusing on Intel's 256GB and 128GB 760p models in this section. We also have the 128GB MyDigitalSSD SBX. These are the two new low-cost NVMe products that make up the value-focused segment of the market. We rarely test 128GB-class products, but these two are worth your time.
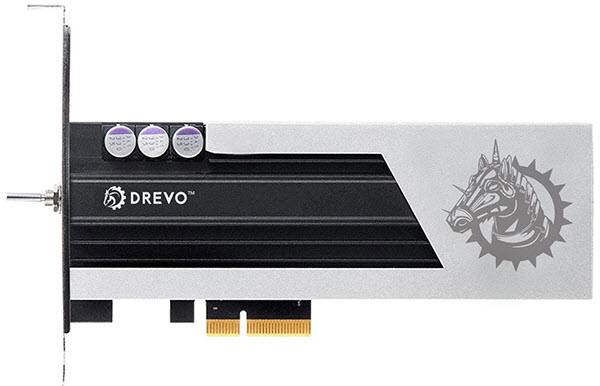
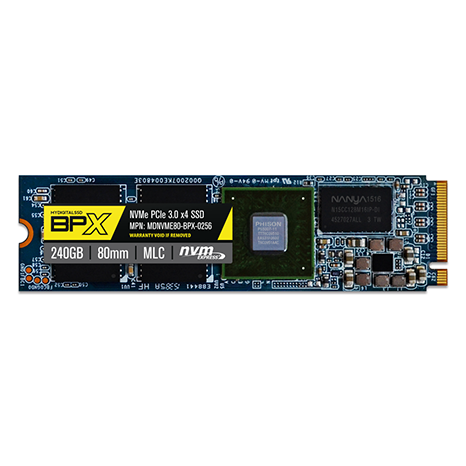
The Drevo Ares is the only SSD in our test pool with an add-in card form factor. This low-cost NVMe SSD never caught on with enthusiasts. The MyDigitalSSD BPX was 2017's value leader. It comes armed with Toshiba 15nm MLC flash and the Phison PS5007-E7 controller. The 256GB SBX, its PCIe 3.0 x2 successor, also makes an appearance. Samsung's 960 EVO and Toshiba's RD400 round out the list.
Sequential Read Performance
To read about our storage tests in-depth, please check out How We Test HDDs And SSDs. We cover four-corner testing on page six of our How We Test guide.
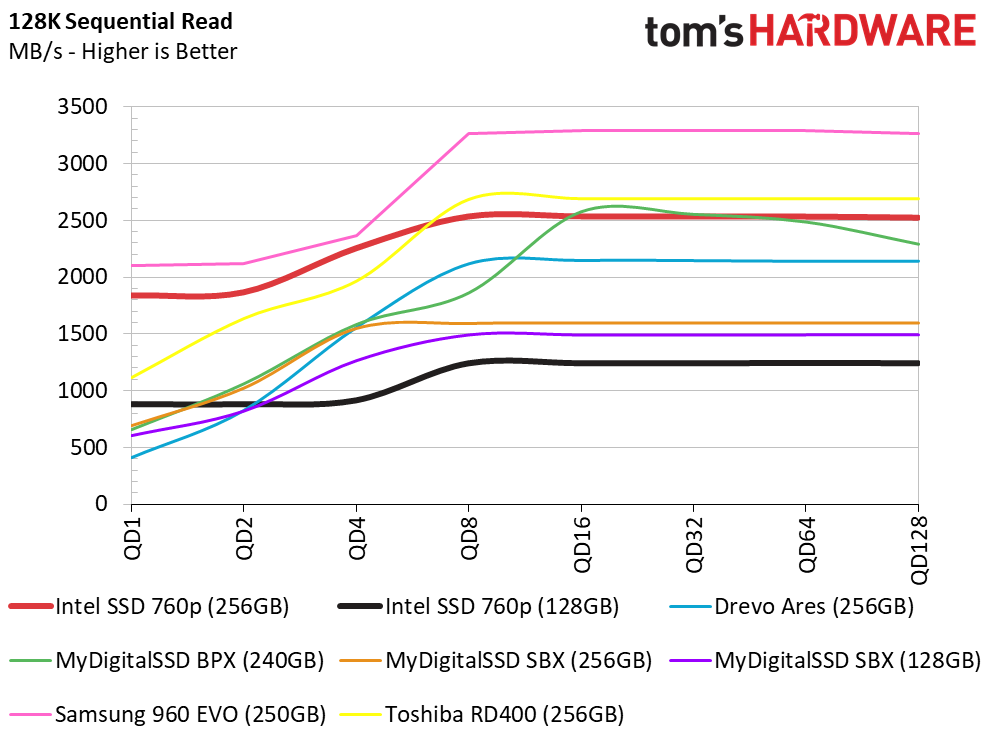
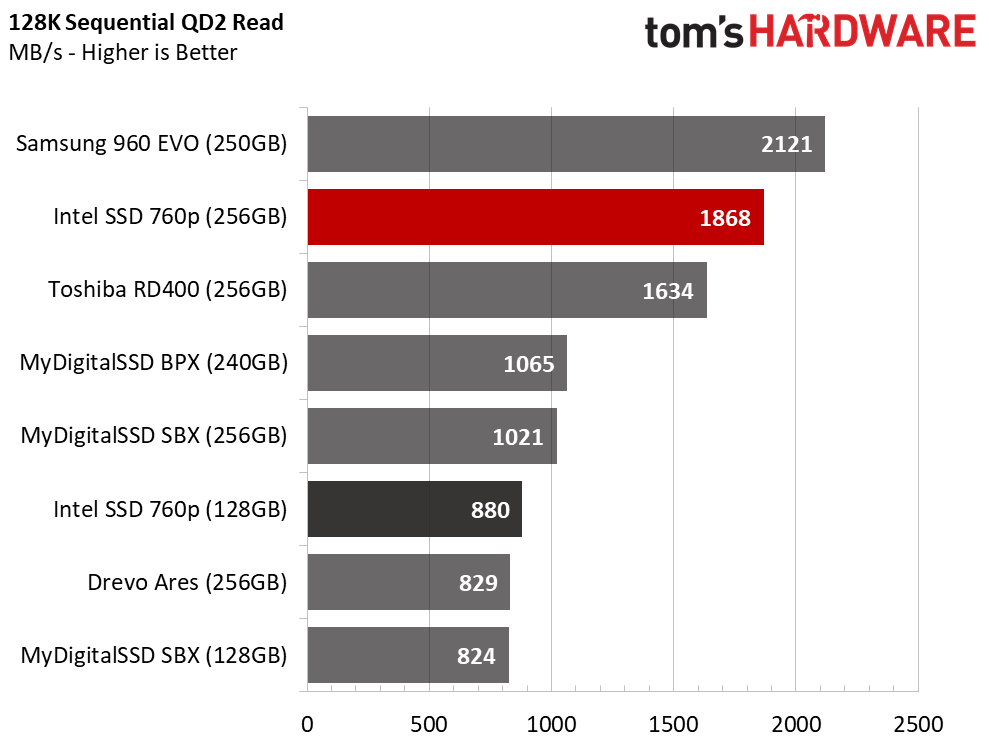
The smaller drives provide a wide range of performance. The 256GB 760p performs very well at low queue depths and lands only a few hundred megabytes per second behind the Samsung 960 EVO. The 128GB 760p outperforms the 128GB SBX at low queue depths, but it doesn't scale as well as we intensify the load.
Sequential Write Performance
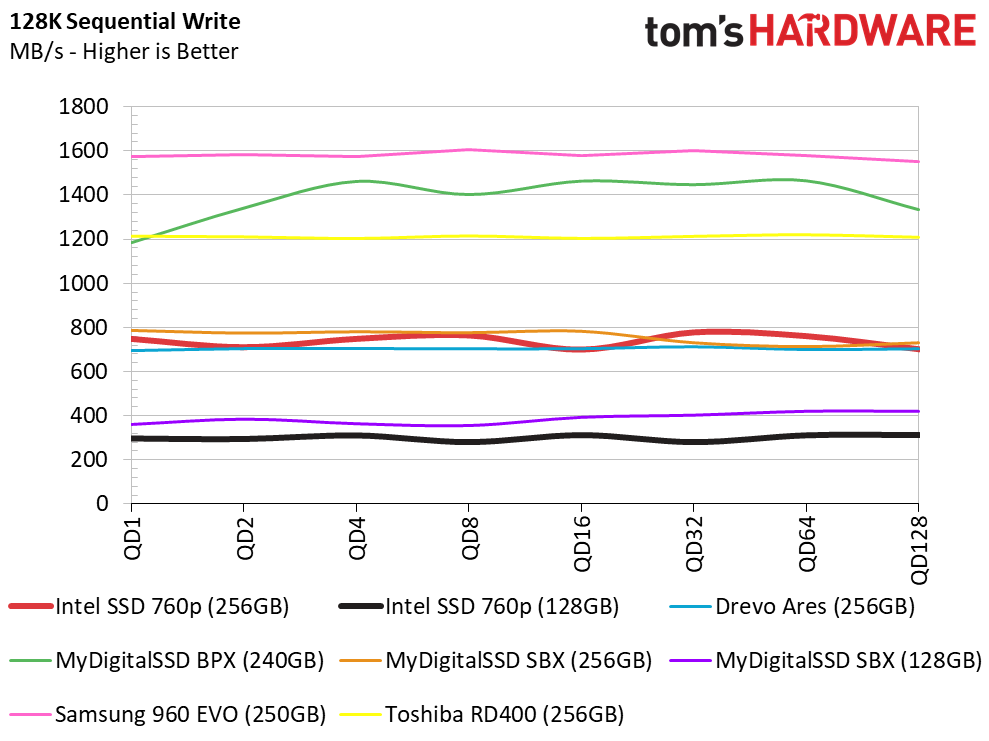
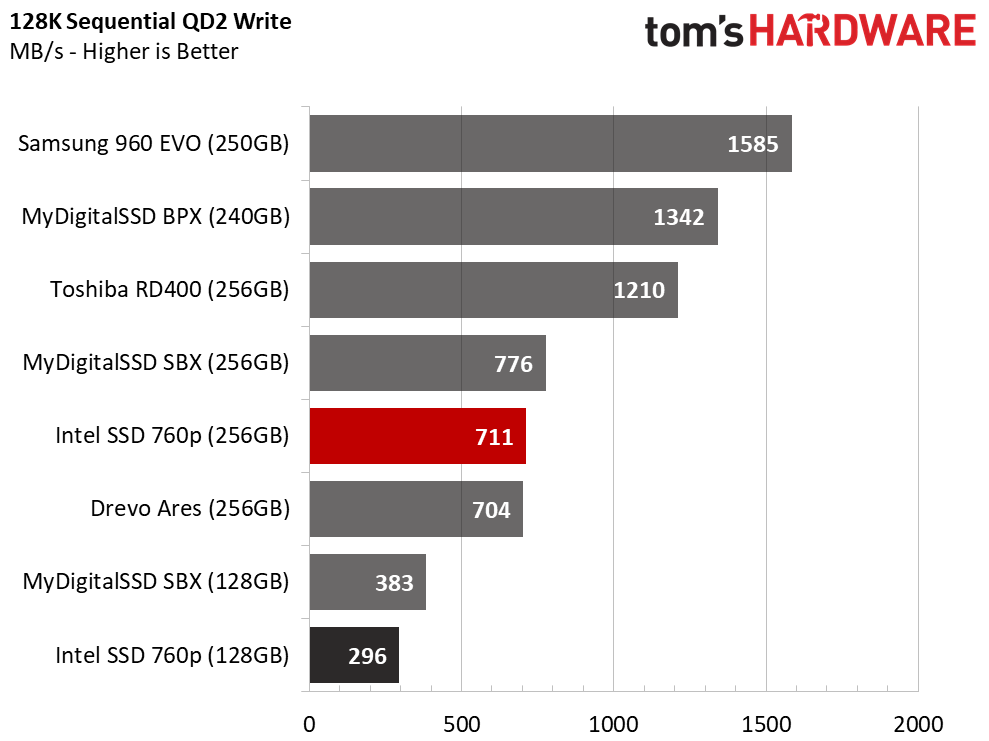
The sequential write test divides this group of products into premium, mainstream, and value classes. The 256GB 760p is disappointing in this test. Its sequential write performance is nearly identical to the Drevo Ares. The 256GB MyDigitalSSD SBX has a PCIe 3.0 x2 interface yet delivers the same level of performance.
The 128GB SBX is actually faster than the 128GB 760p in the sequential write test. The SBX features a larger SLC cache than the 760p. That allows it to absorb more incoming write data before it drops to native TLC speeds.
Sequential Sustained Write Performance
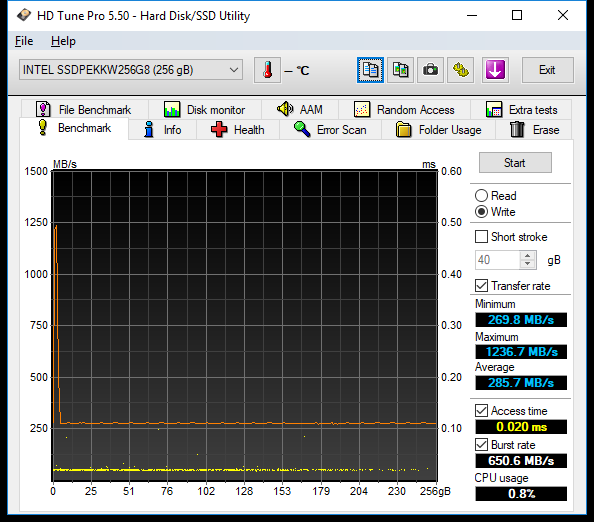
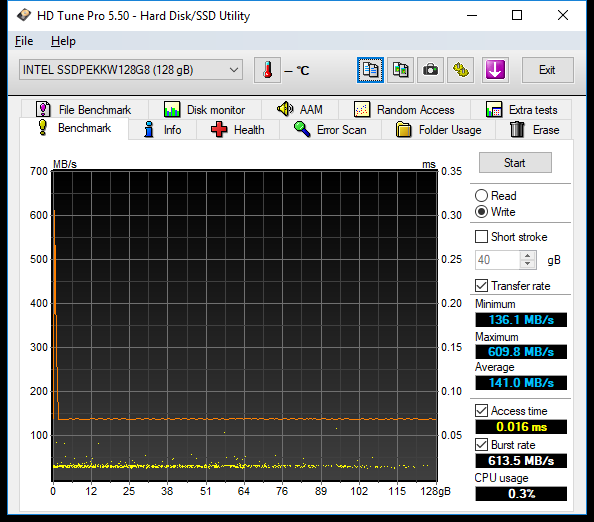
The 760p's SLC cache is very small for a modern NVMe SSD. Once you write enough data to fill the cache, sequential write speed drops to 270 MB/s for the 256GB drive and 136 MB/s for the 128GB. Intel did not adopt direct-to-die write technology for the 760p, so all incoming data must pass through the SLC layer and then fold into the TLC. This slows down data transfers to the drive, but it also reduces wear on the flash.
Get Tom's Hardware's best news and in-depth reviews, straight to your inbox.
Random Read Performance
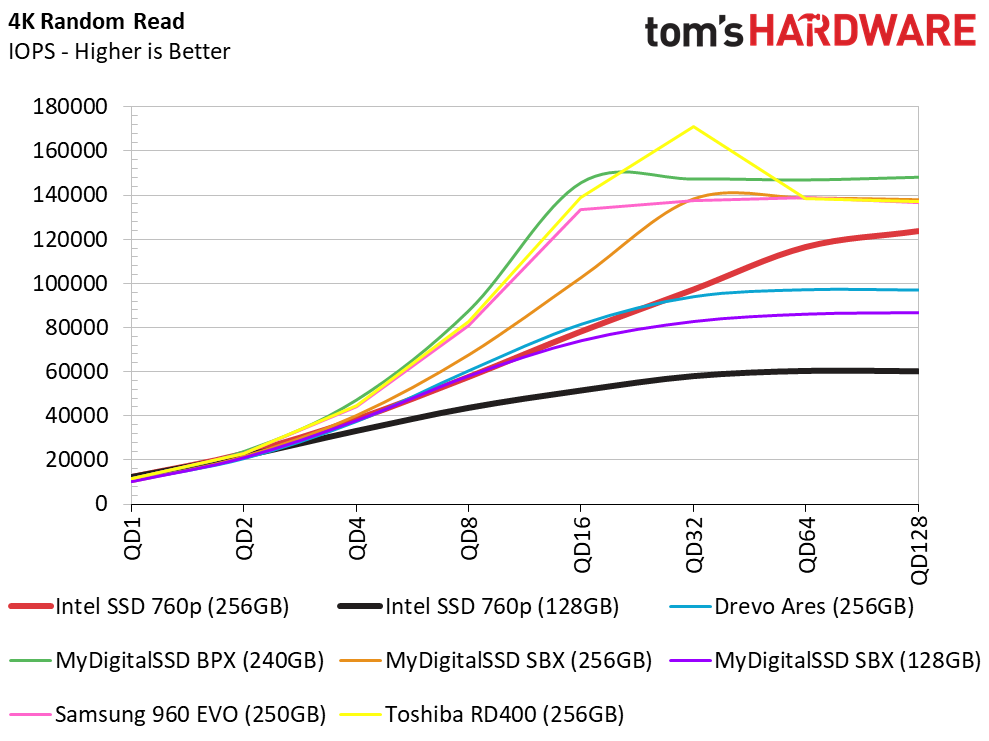
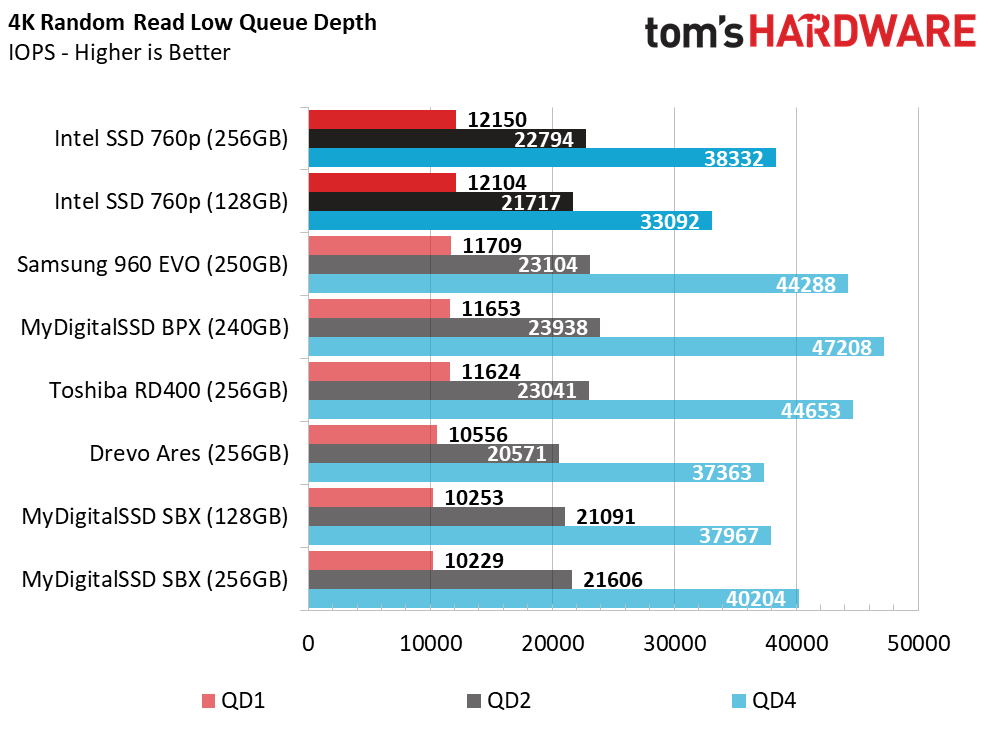
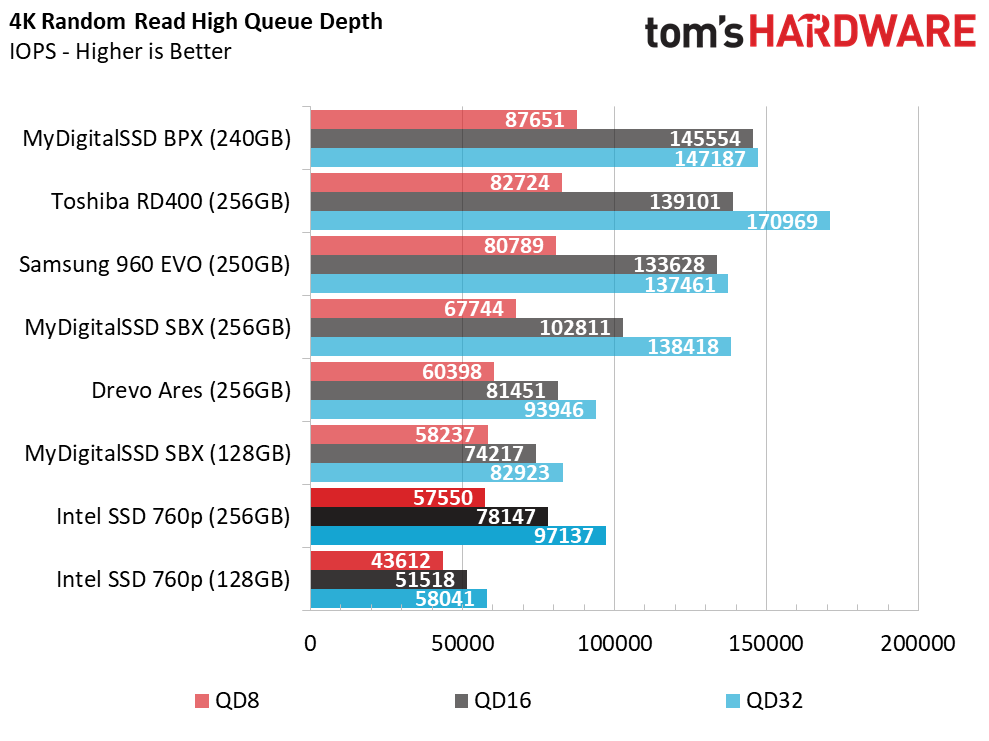
All of the products surpass 10,000 random read IOPS at QD1. There is very little separation between the drives, but it's worth noting that the 760p SSDs deliver the highest performance at QD1. The other products have caught up to the Intel drives at QD2, but no product stands out from the rest. We see larger gaps at higher queue depths, but it's too little, too late. That type of load is far beyond what you will see with consumer applications.
Random Write Performance
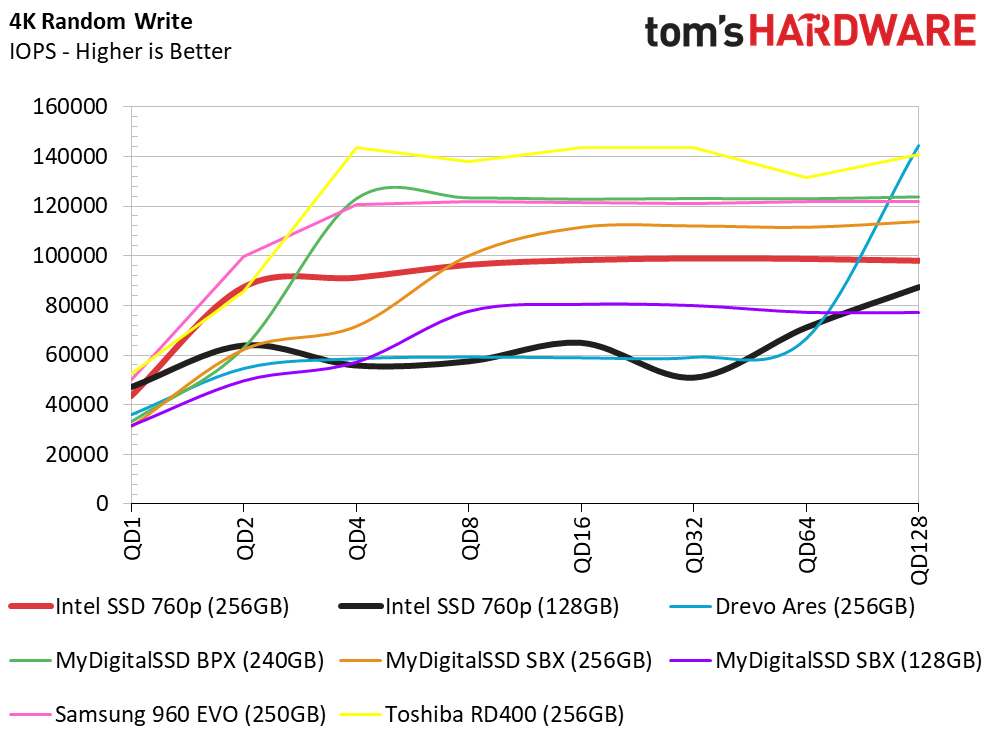
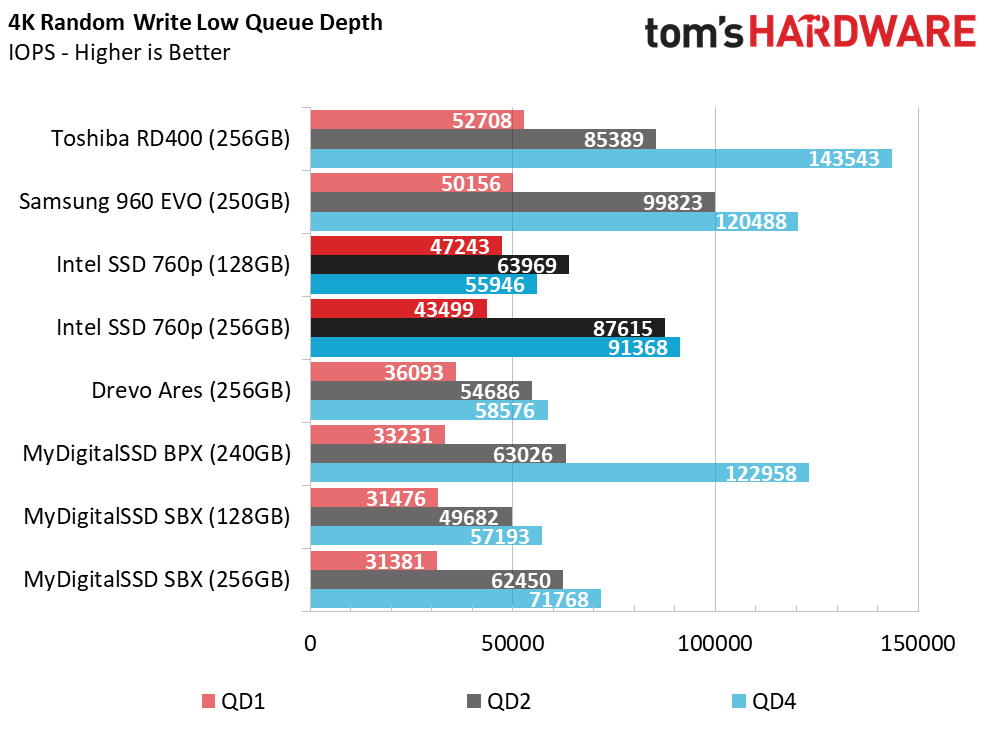
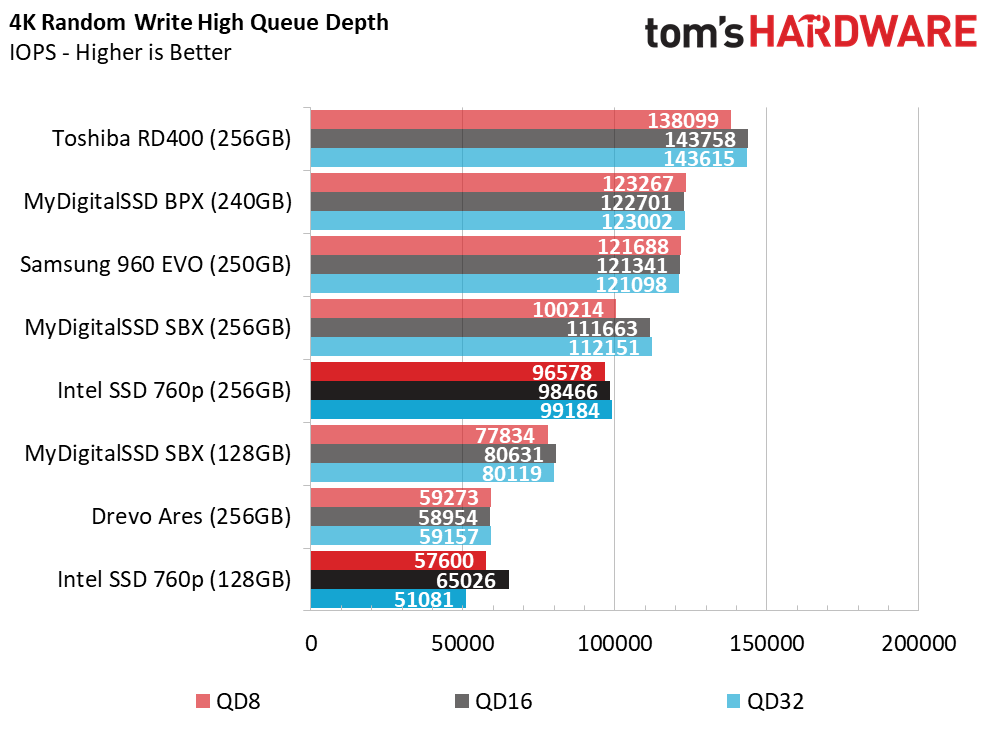
Advanced SLC cache technology has largely moved random write performance beyond what applications can use. The smaller blocks easily fit in the SLC cache and it takes more transactions to fill the cache, unlike sequential data that has larger blocks. To put it simply, even a very small SLC cache is large enough to handle your bursty random writes many times over.
70% Mixed Sequential Workload
We describe our mixed workload testing in detail here and describe our steady state tests here.
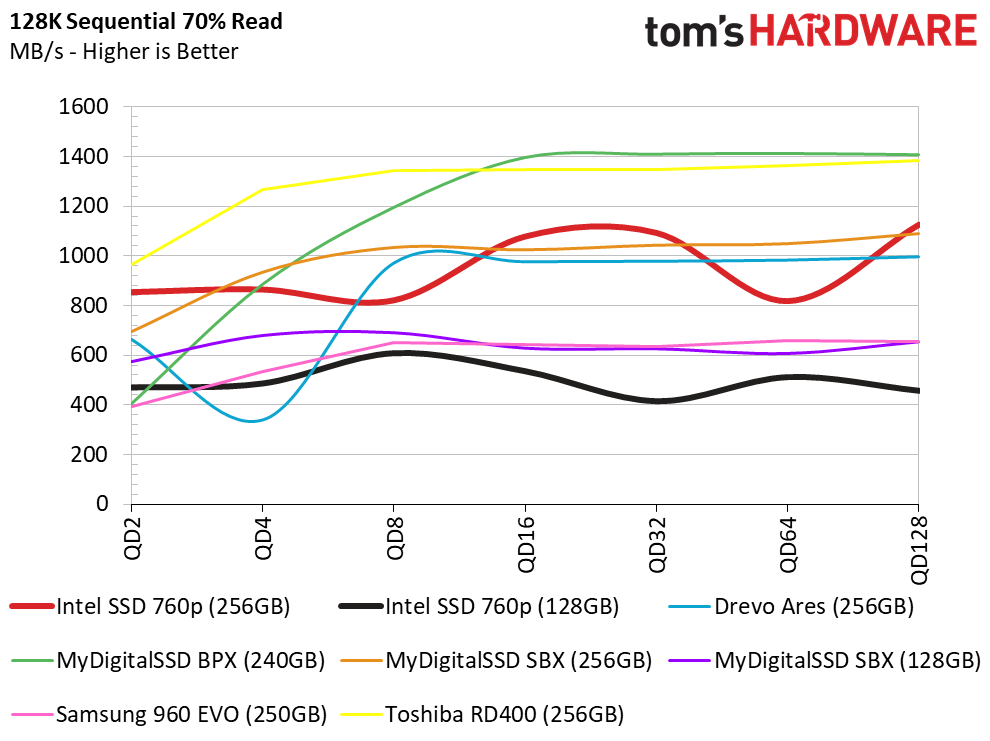
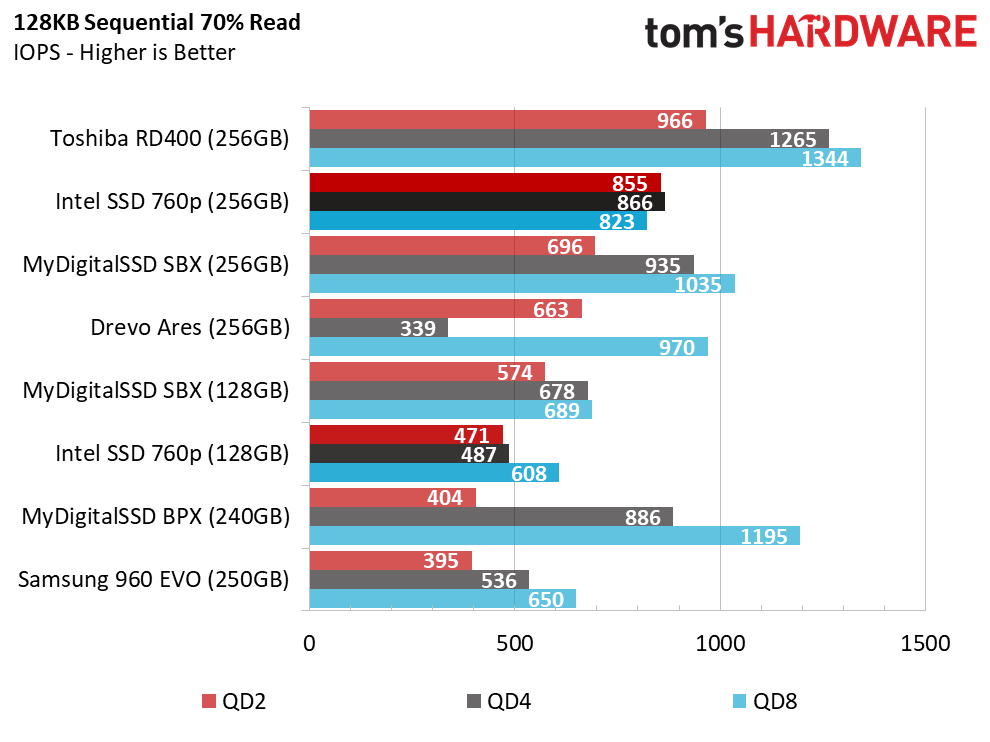
The 760p's small SLC cache capacity causes inconsistent performance in our mixed workload test.
70% Mixed Random Workload
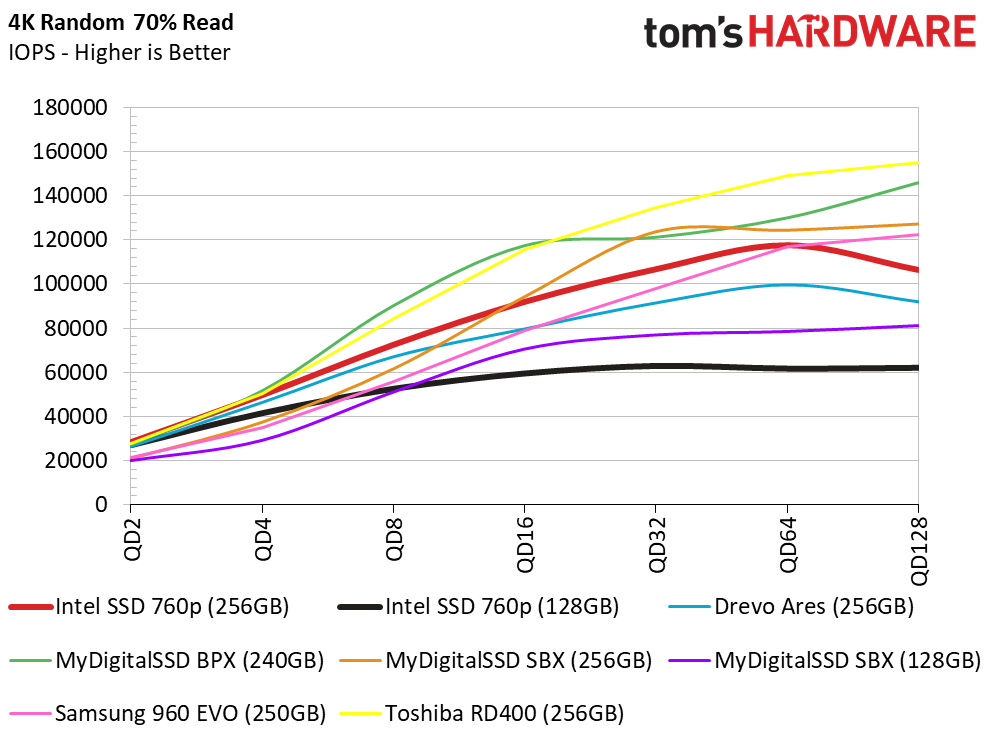
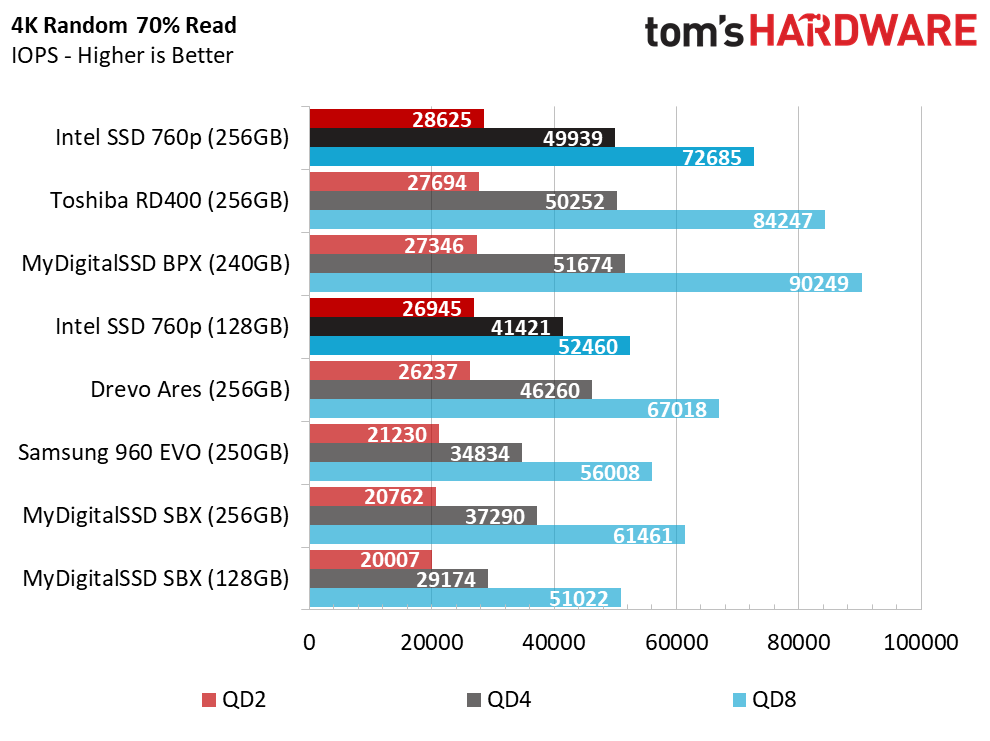
Here we see the performance increase predictably as we scale up the queue depth.
Sequential Steady-State
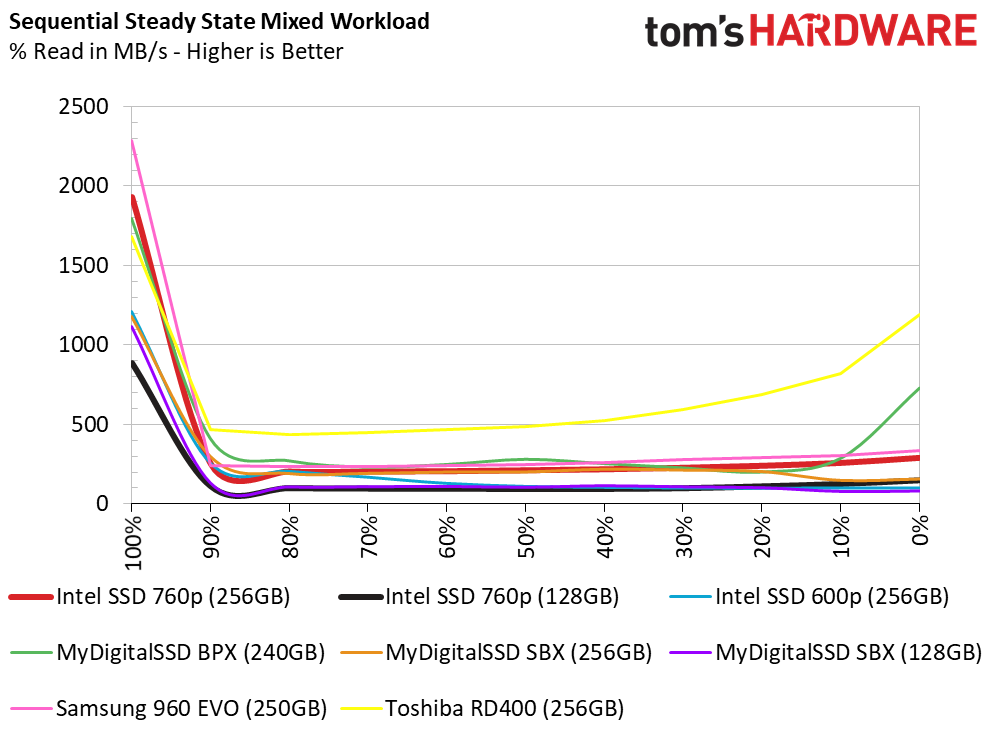
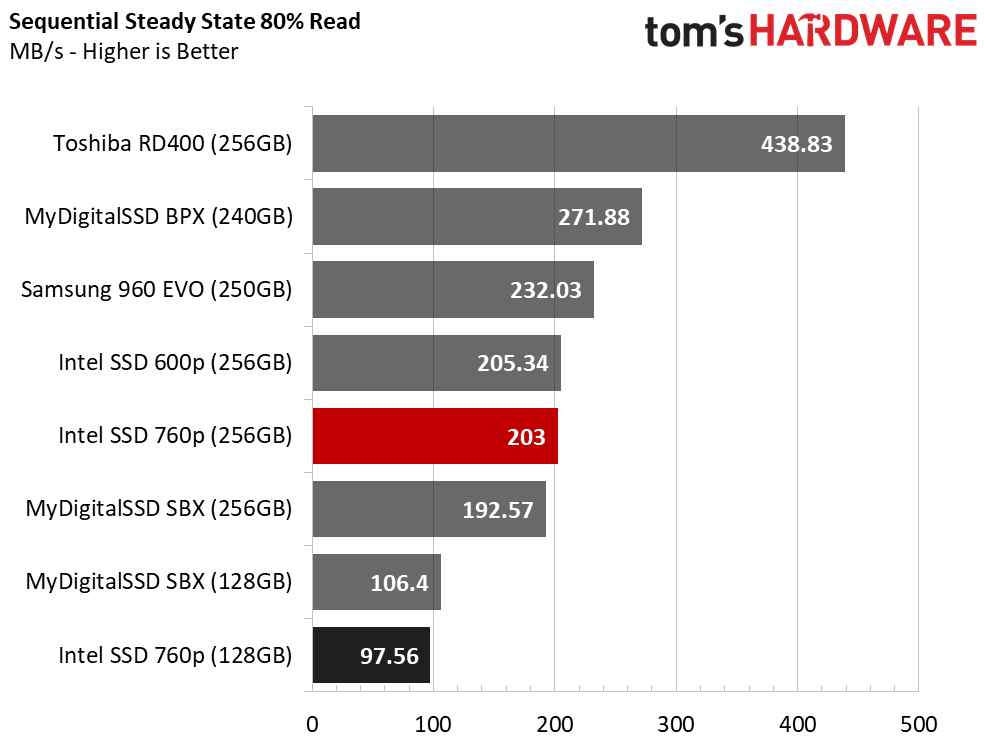
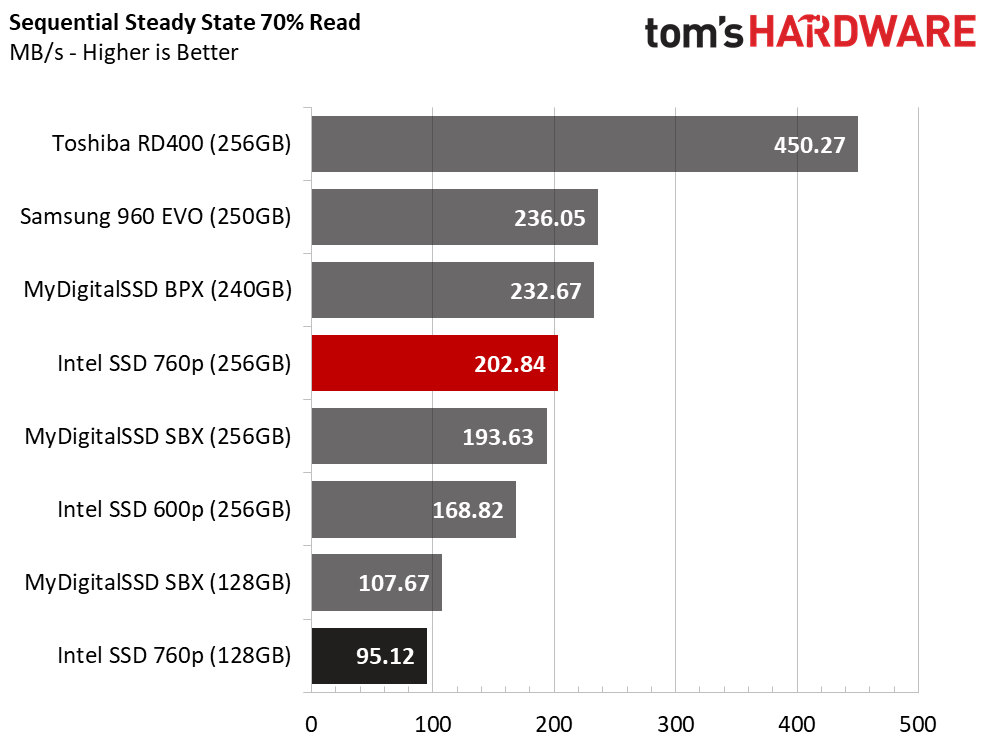
The Toshiba RD400 and MyDigitalSSD BPX are the only products in our test with 2-bit per cell (MLC) flash. Toshiba brands the RD series as a workstation product and we can trace its lineage back to array-on-card products that had a low-cost RAID controller linked to eight onboard SSDs. The BPX is a mainstream SSD that came to market with the last remaining Toshiba 15nm planar MLC flash. Phison purchased and stockpiled that flash specifically for the NAND shortage. The two MLC drives show us the difference between a purpose-built workstation-class NVMe SSD and one built for typical consumer use.
It's important to make that distinction because Intel has matched the MyDigitalSSD BPX's steady-state performance with its new 64-layer TLC. Intel designed the 760p for consumer workloads, and not workstation use. You could stretch its heavy workload performance by overprovisioning the drive, but you will still not get RD400-level performance.
Random Steady-State
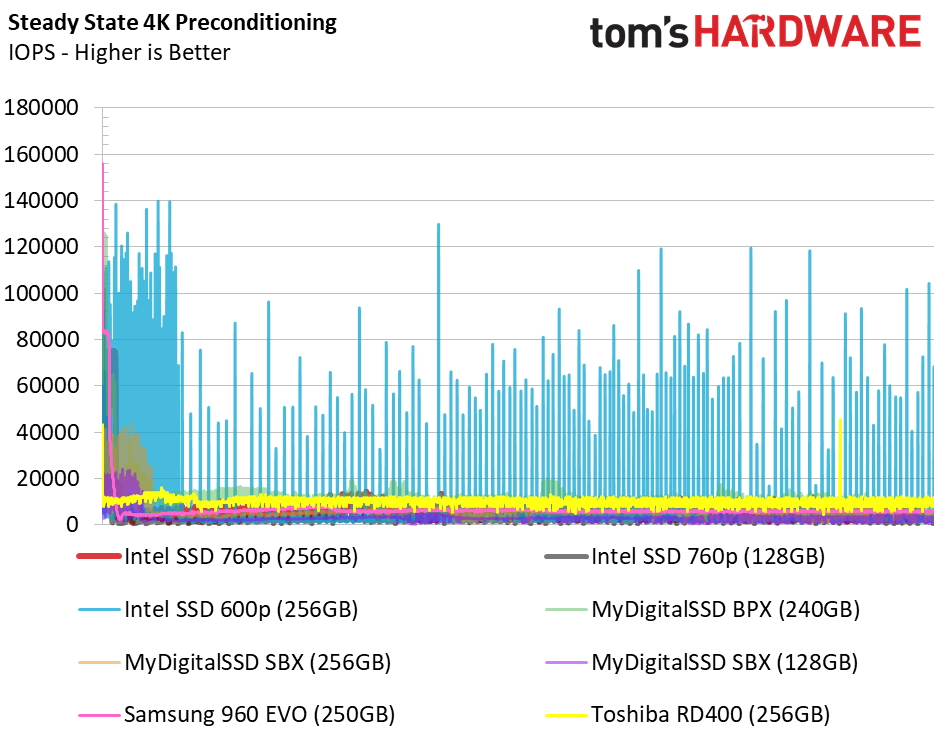
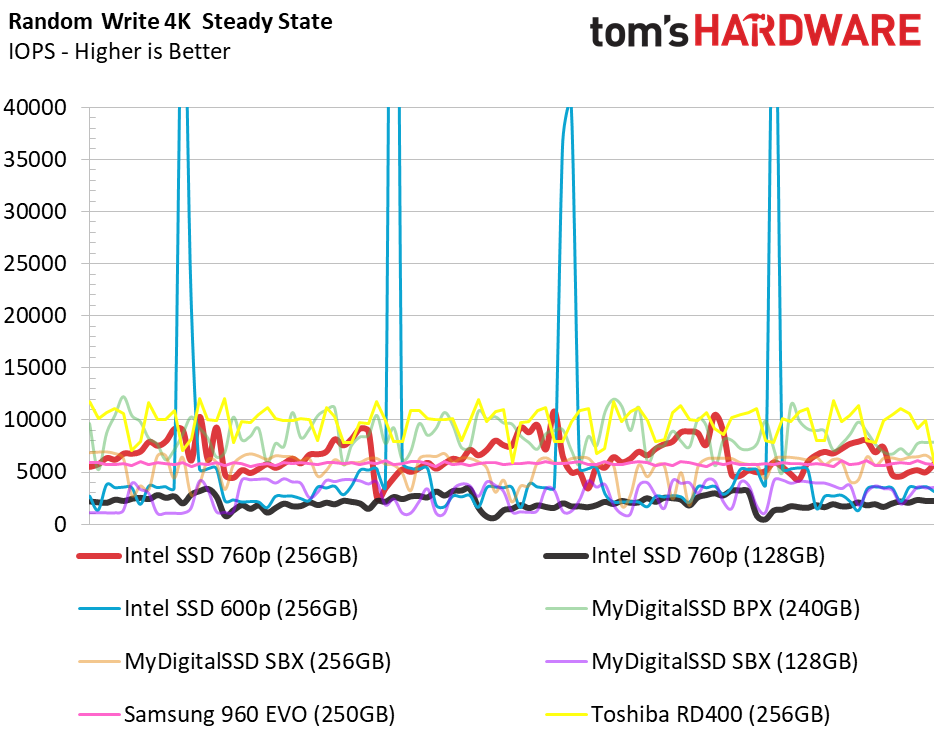
For many years, Intel preached the benefits of performance consistency as it led the SSD industry with enterprise SSDs that crossed over to the consumer market. We hear less about performance consistency from Intel now that it makes true consumer SSDs, but that doesn't detract from the importance of consistent performance. The random steady-state test shows us worst-case random write performance with a single drive. This helps us to determine if a product should be used in a RAID array. Performance peaks and valleys increase in magnitude as you add drives to an array.
The 250GB 760p is not as consistent as the 250GB Samsung 960 EVO, and the blame falls on its caching algorithm. You can see the data folding into the TLC in waves. The transfer rate is high for a brief moment as data writes to the SLC then performance crashes as the SLC flushes. This process repeats for the entire duration of an extended write workload. It's not an ideal algorithm for RAID in a workstation, but the performance is good enough for gaming systems where you simply want a single large volume with satisfactory performance.
PCMark 8 Real-World Software Performance
For details on our real-world software performance testing, please click here.
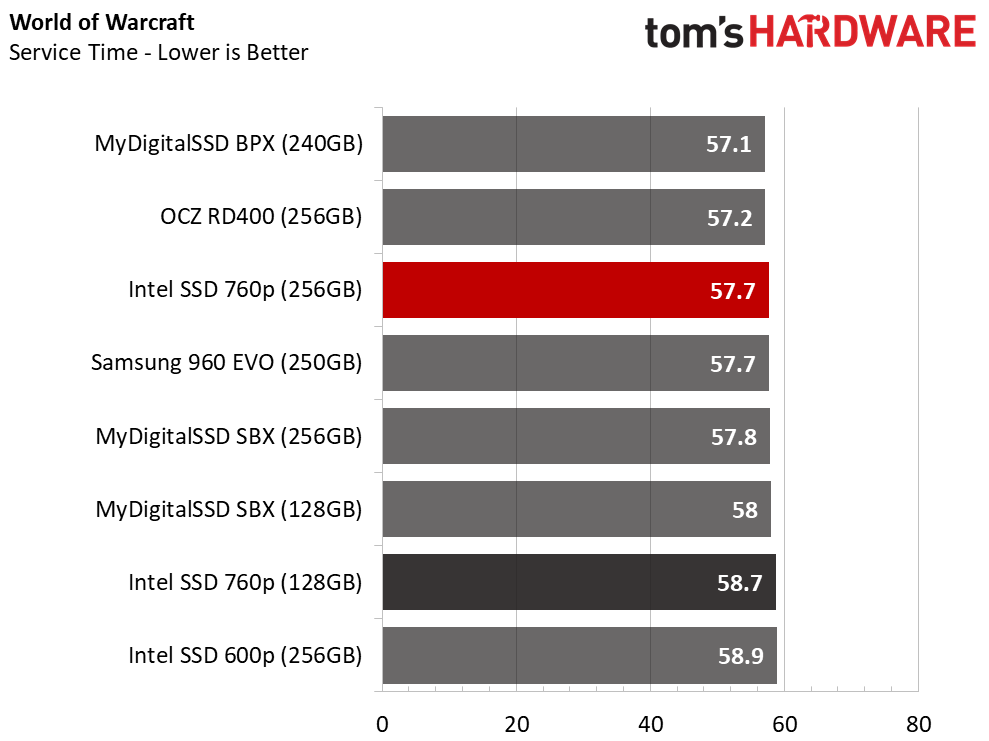
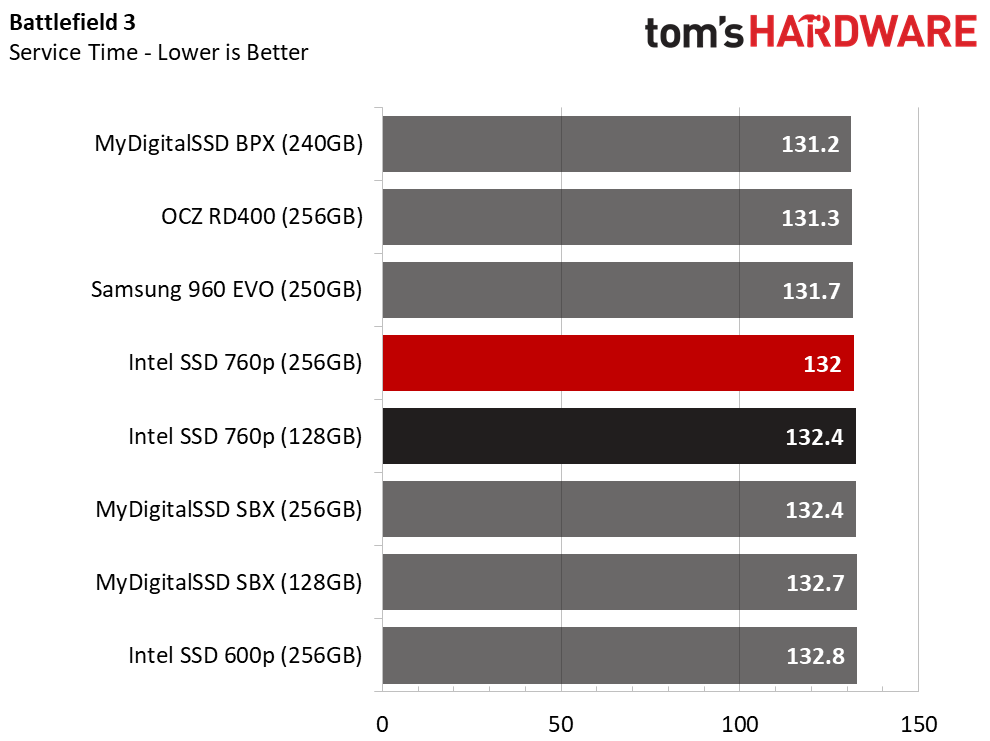
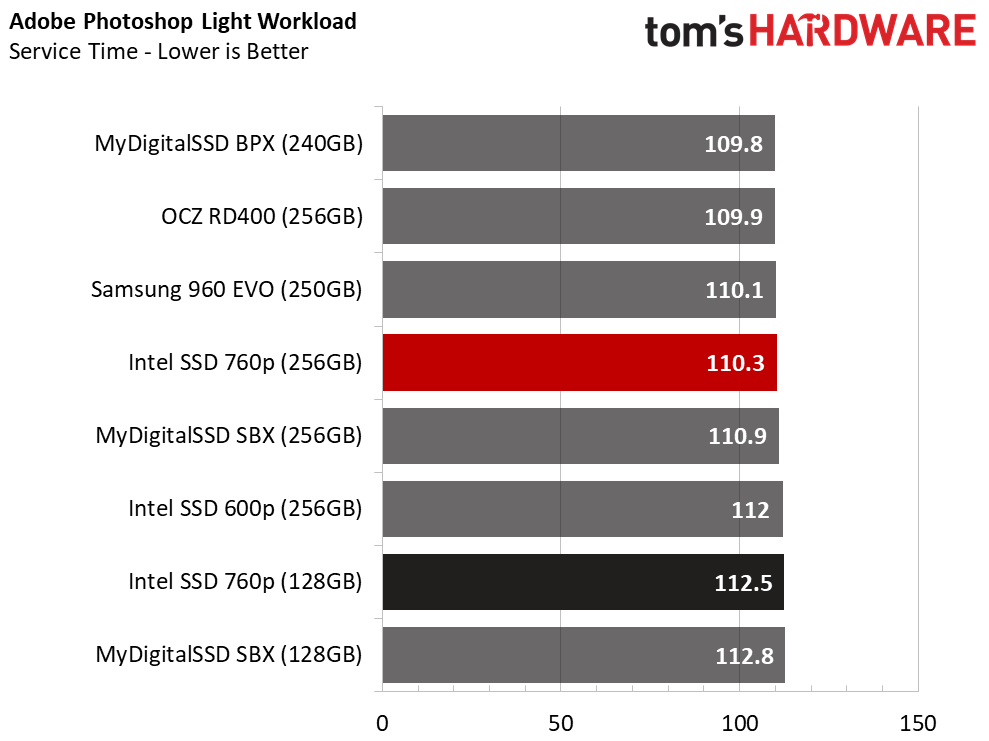
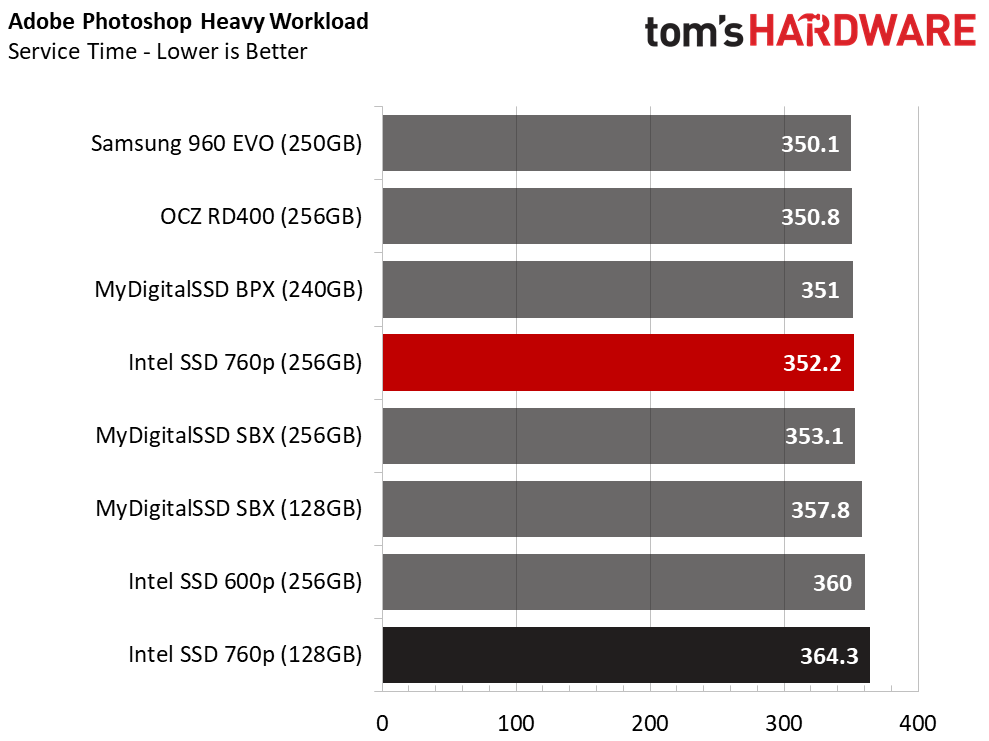
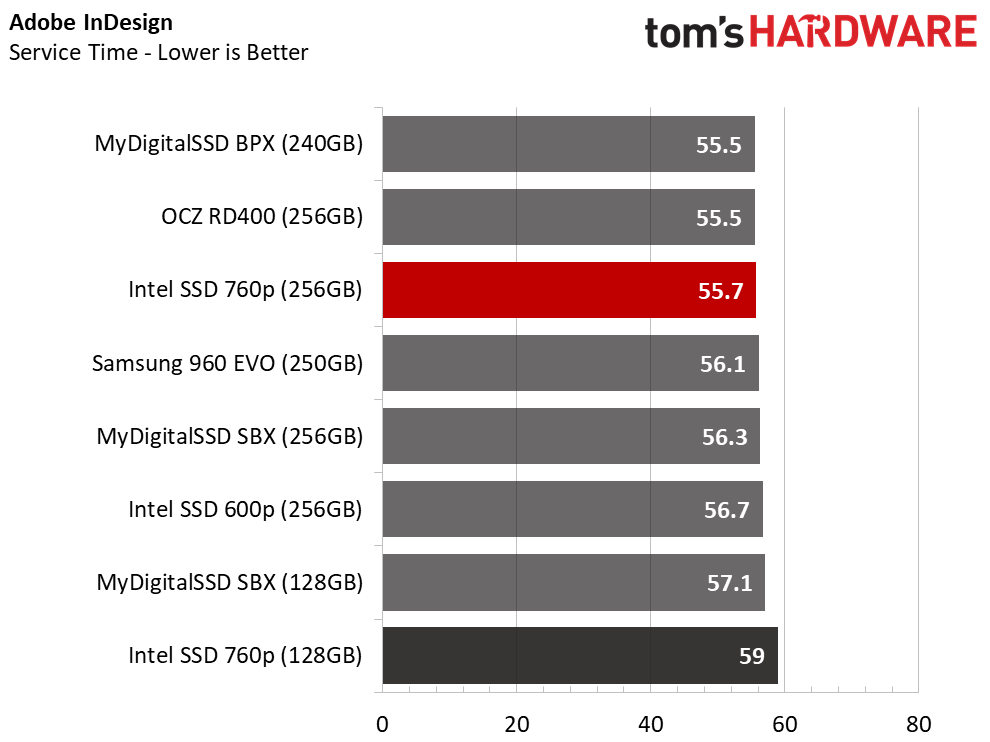
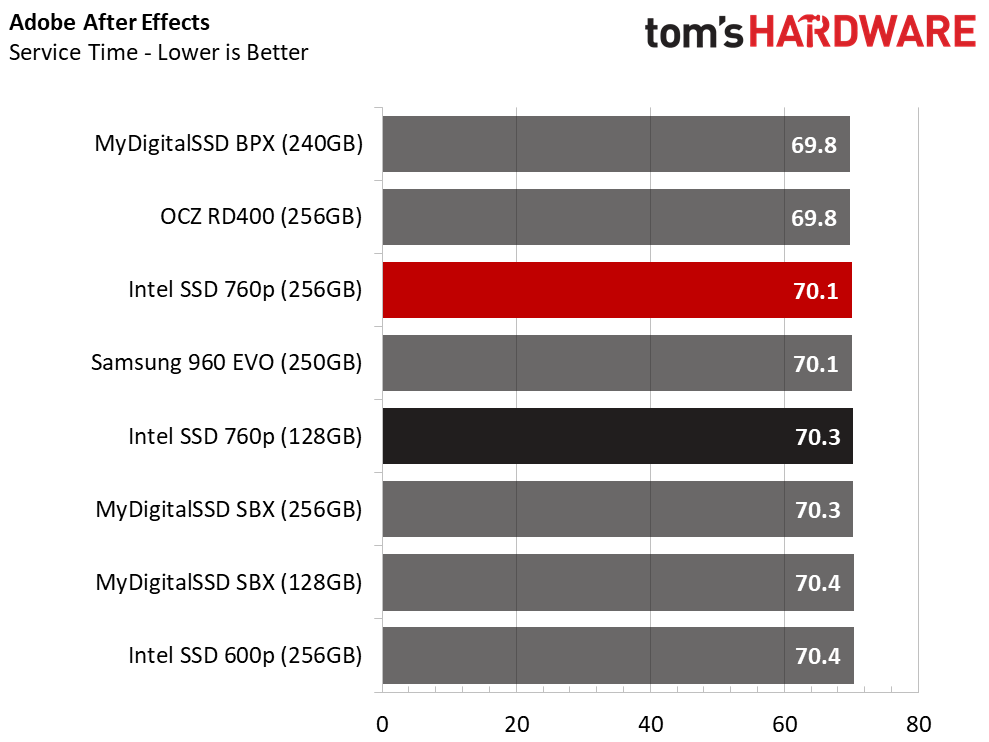
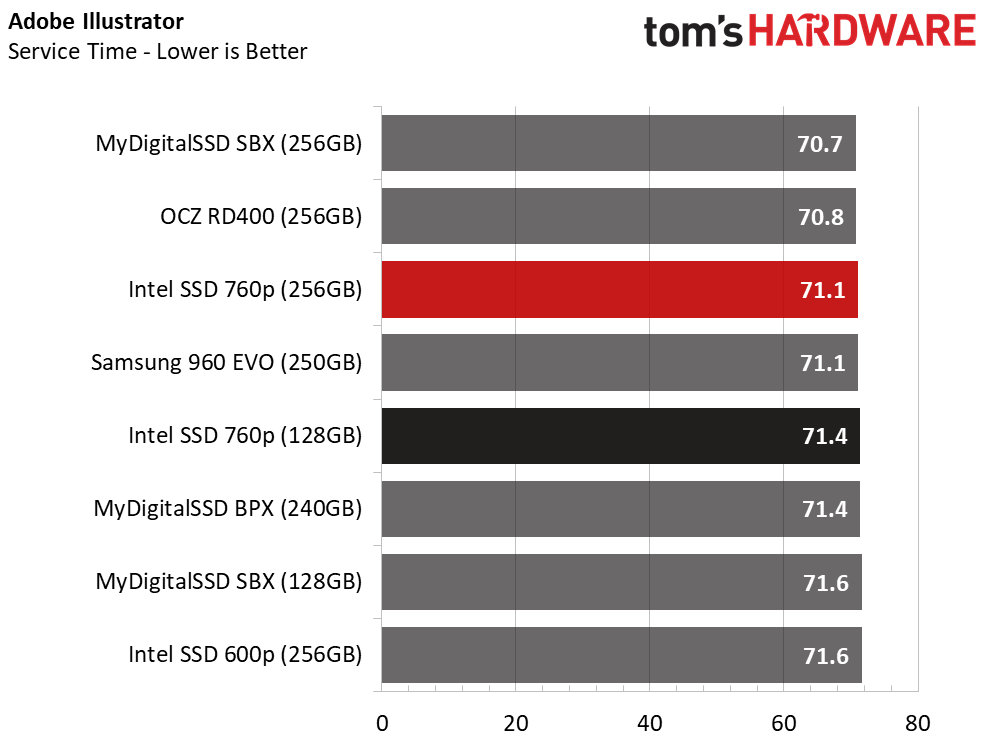
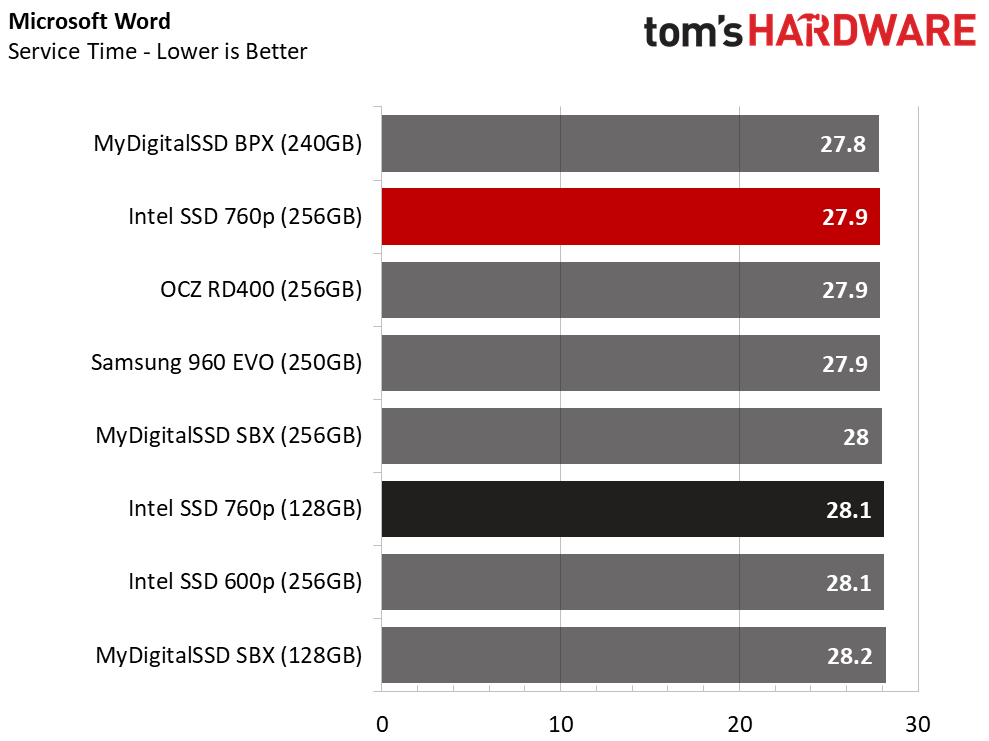
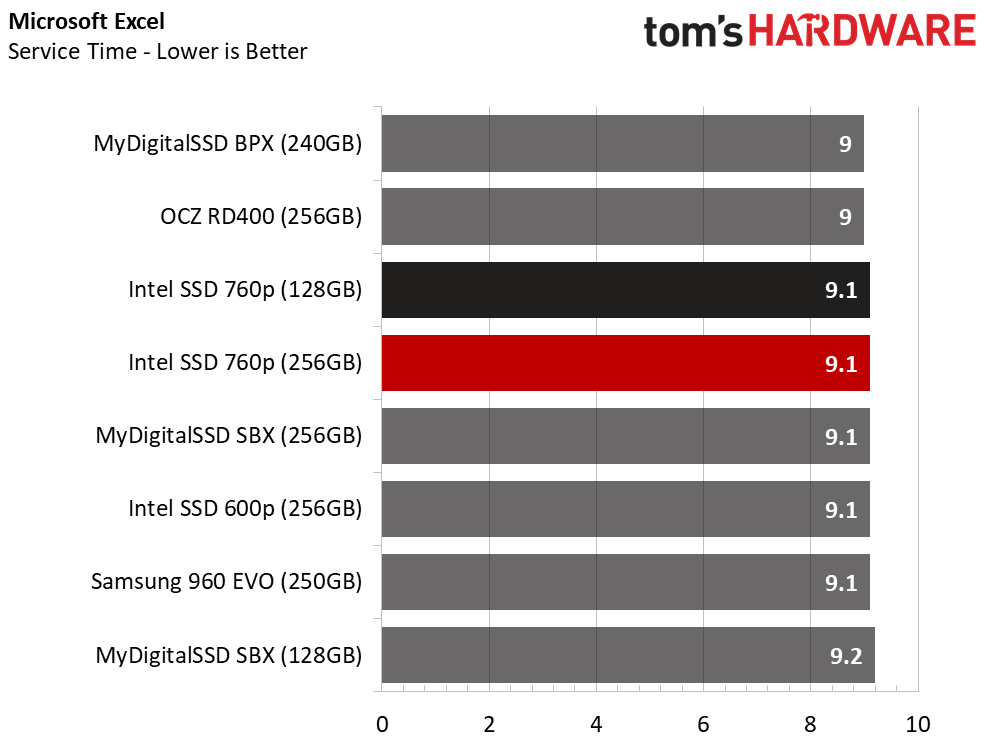
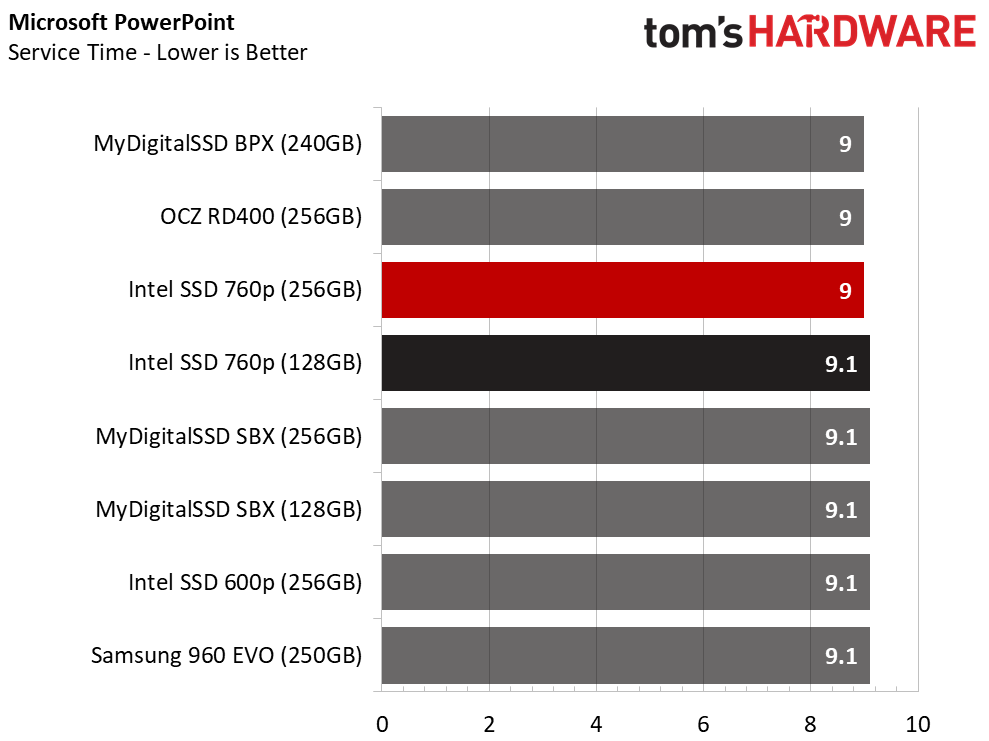
It isn't surprising to see the two MLC SSDs at the top of several of the applications tests. The RD400 and BPX are no longer in production, but there is still stock available online for purchase. It won't be long before the stock clears, leaving us with only TLC products to chose from. The Intel 760p and Samsung 860 EVO dominate the other TLC products in these charts.
Application Storage Bandwidth
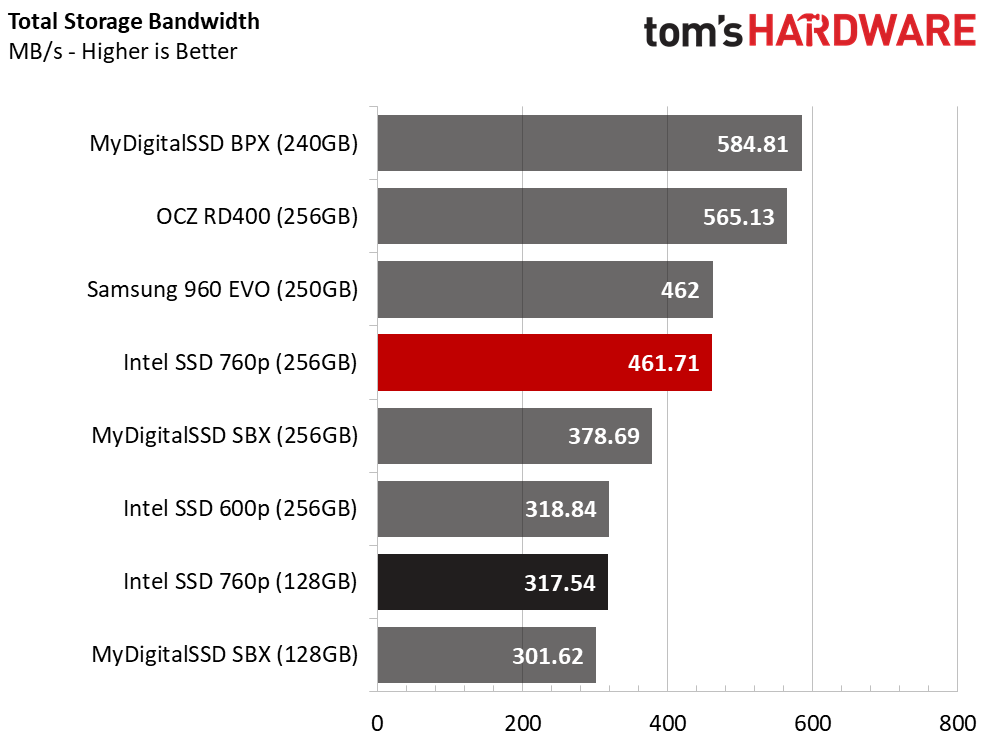
These results show us the hierarchy with more clarity. The MLC drives tower over the TLC products, but the 850 EVO and 760p are on a different performance level than the other 256GB-class NVMe SSDs.
The performance gap shrinks between the 128GB drives. This capacity point is more about pricing than performance, but it's nice to see the NVMe SSDs can still deliver superior application performance compared to modern mainstream SATA SSDs.
PCMark 8 Advanced Workload Performance
To learn how we test advanced workload performance, please click here.
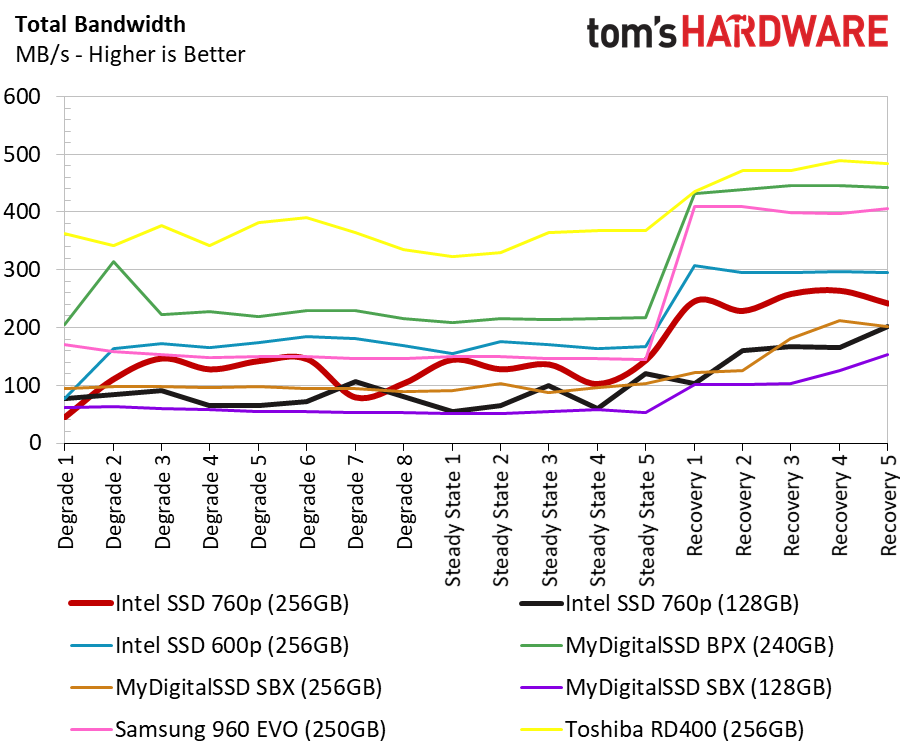
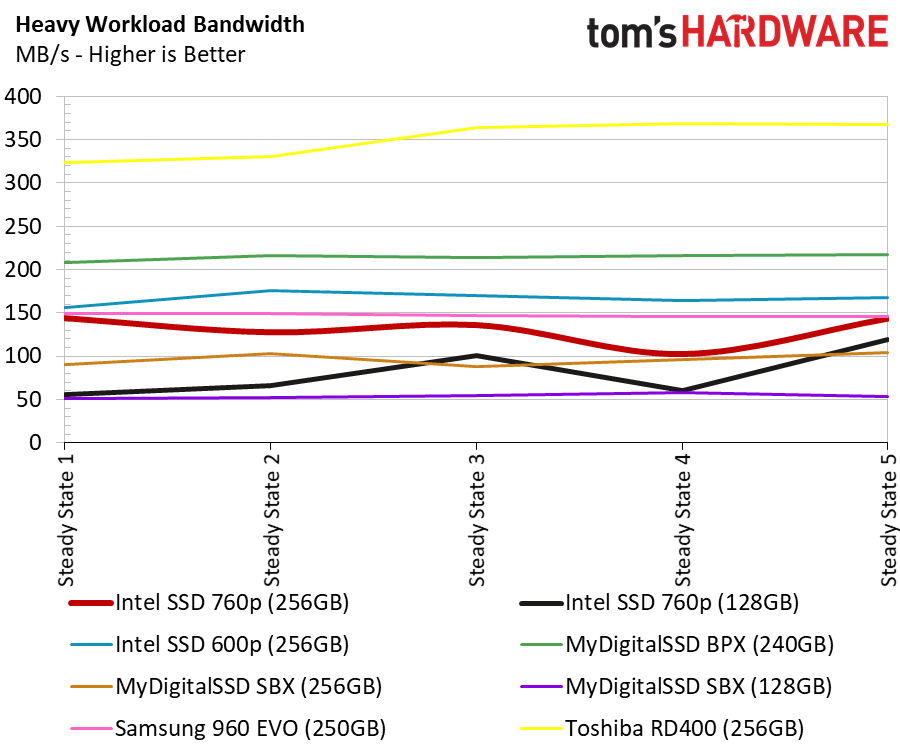
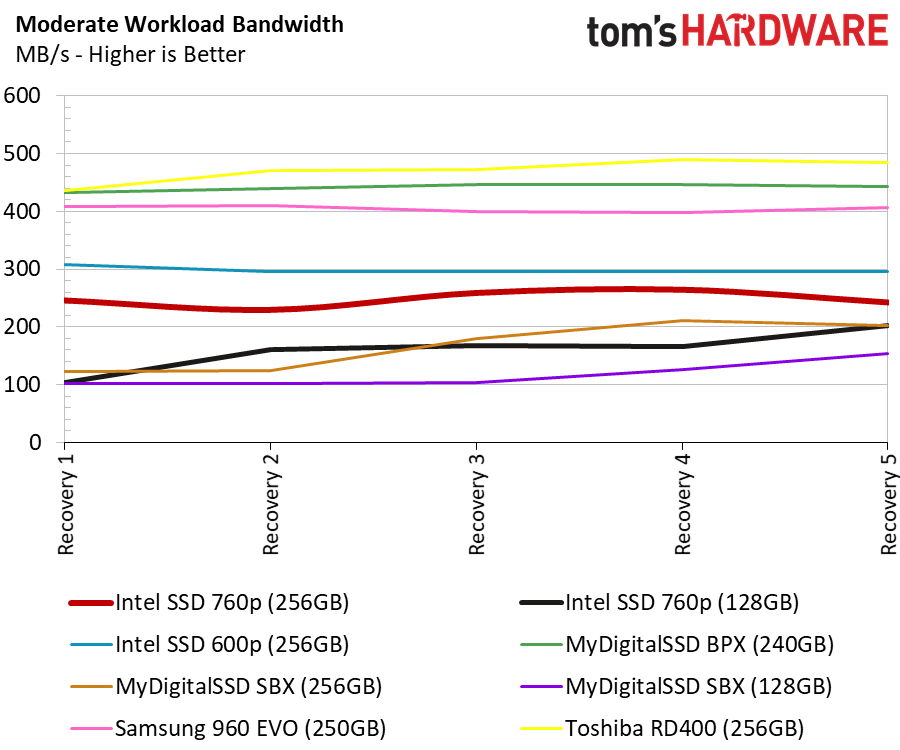
The workload you run on a drive plays a role in its performance in the future. Modern SSDs will use idle time to clean dirty flash cells. That speeds up incoming write traffic, but the companies all use different algorithms for background activities. Some drives will clean up as soon as the drive moves into an idle state, while others will let the tasks build up and then tackle a larger job. This can impact power consumption and performance at any given time. You are most susceptible to heavy workload strain after installing the operating system or new applications.
Total Service Time
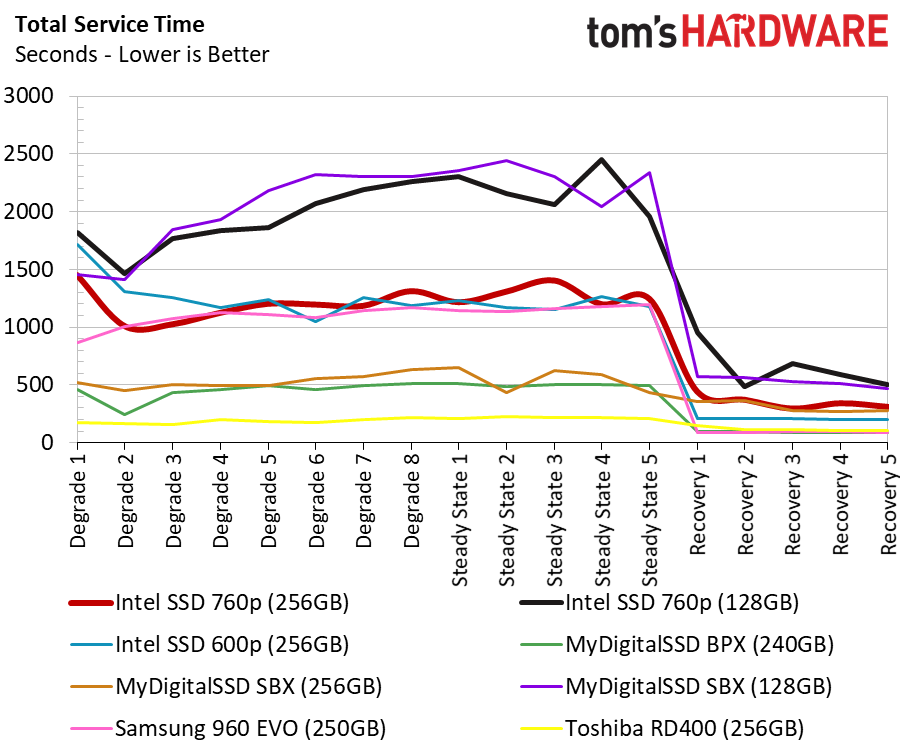
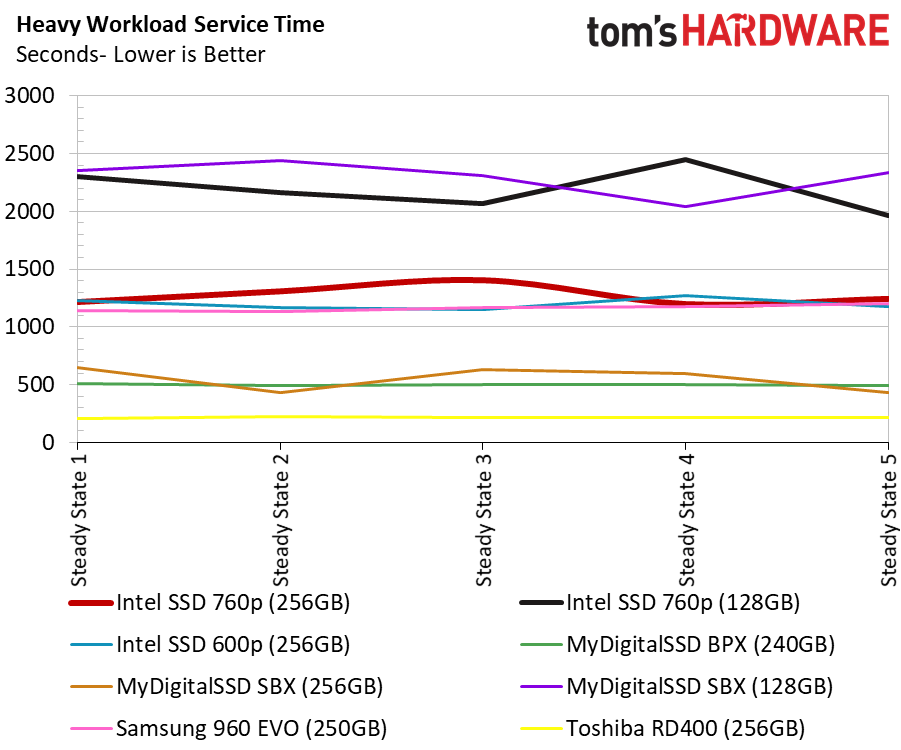
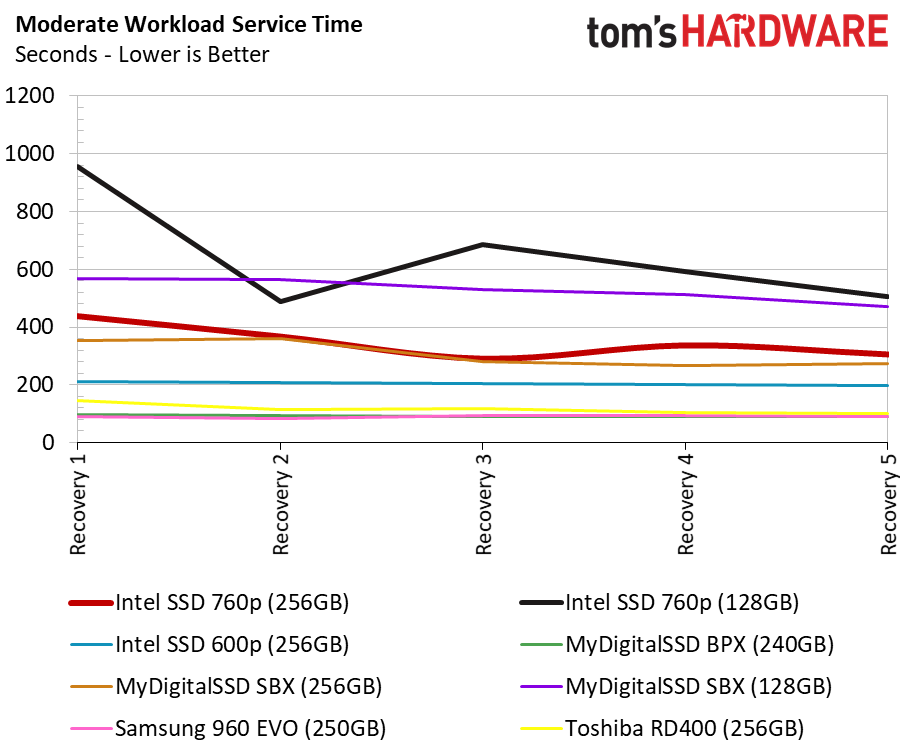
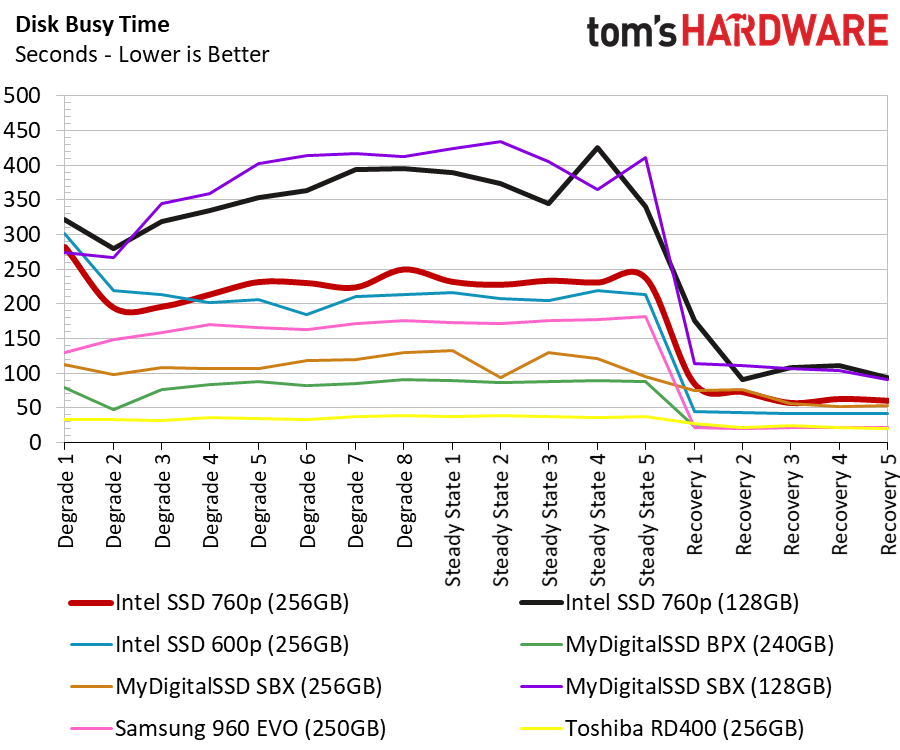
Throughput should not be your primary concern after running a heavy workload. Service time is the disk busy time plus the access time. This test shows latency over the entire range of applications in the PCMark 8 suite. We focus on the recovery results of the tests.
The 256GB 600p surprisingly performs better than new 760p. The 600p uses Intel's first-generation 32-layer flash that is plagued with high latency. The 600p also has a less-than-stellar controller. The new 760p should outperform the 600p in every test, but that isn't the case with the 256GB drives.
Disk Busy Time
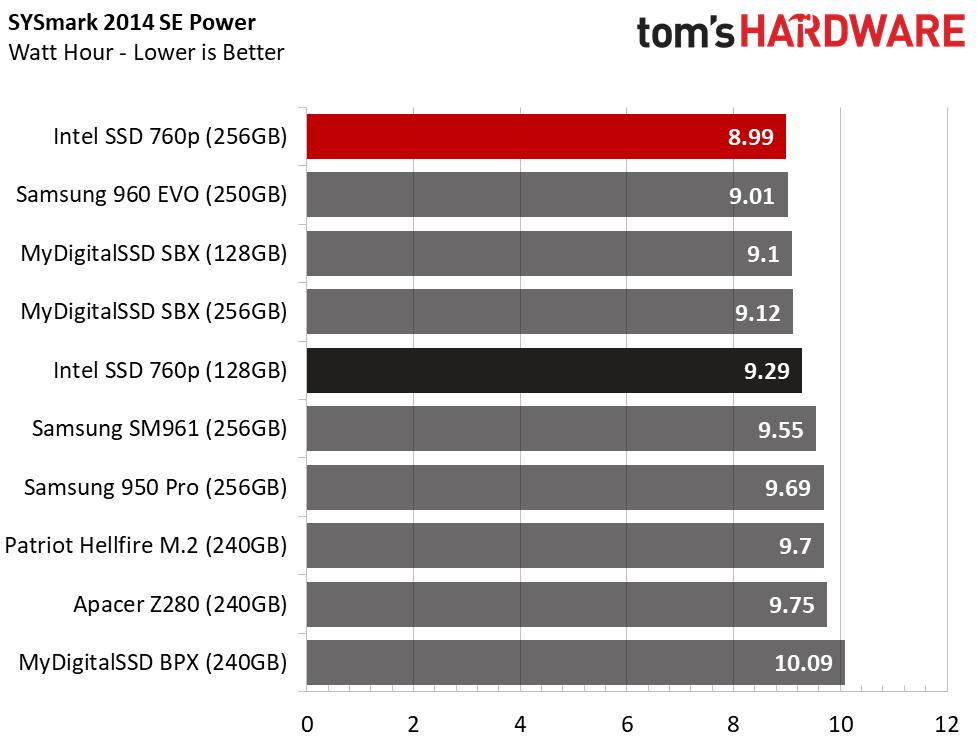
The disk busy time test measures how long the drives took to complete the workloads. The longer the drives are active, the less time they spend in a low-power idle state or performing background cleanup operations. That has an impact on responsiveness and power consumption.
BAPCo SYSmark 2014 SE Responsiveness Test
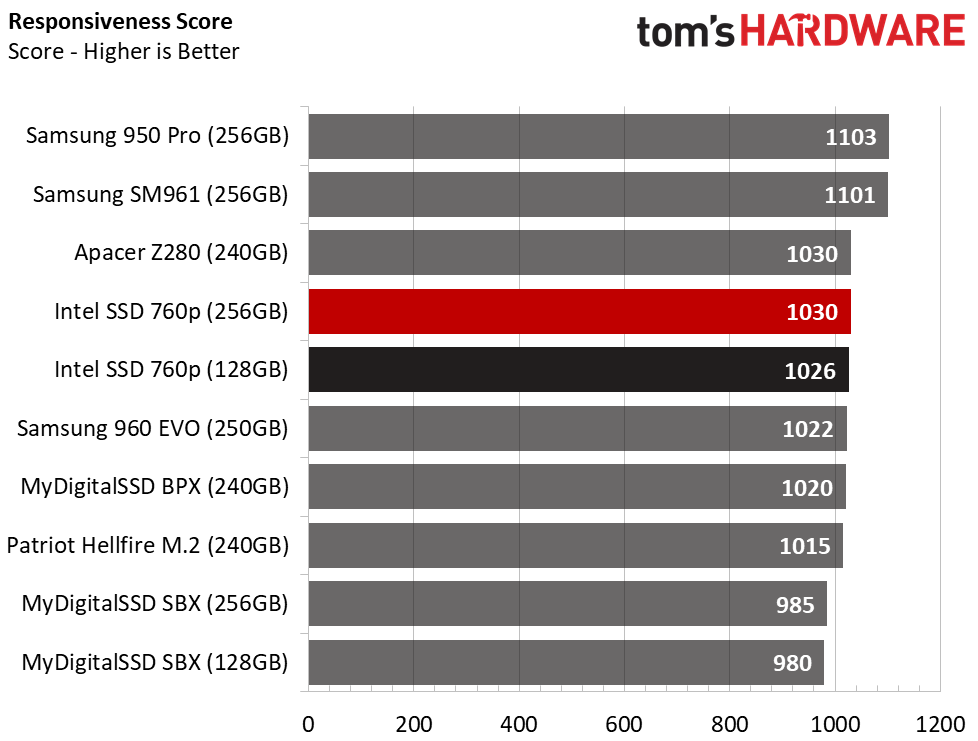
The responsiveness test is a direct latency measurement, but the results filter into a scoring system based on an 850 EVO-like Samsung SATA SSD. The baseline system delivers a score of 1000. Most of the NVMe SSDs, except the SBX models, beat that bar. Both Intel SSD 760p SSDs outperform the Samsung 960 EVO 250GB in this important test. The two Samsung professional series products with MLC are more responsive than the 760p, but they also cost significantly more.
BAPCo MobileMark 2012.5 Notebook Battery Life
To learn how we test advanced workload performance, please click here.
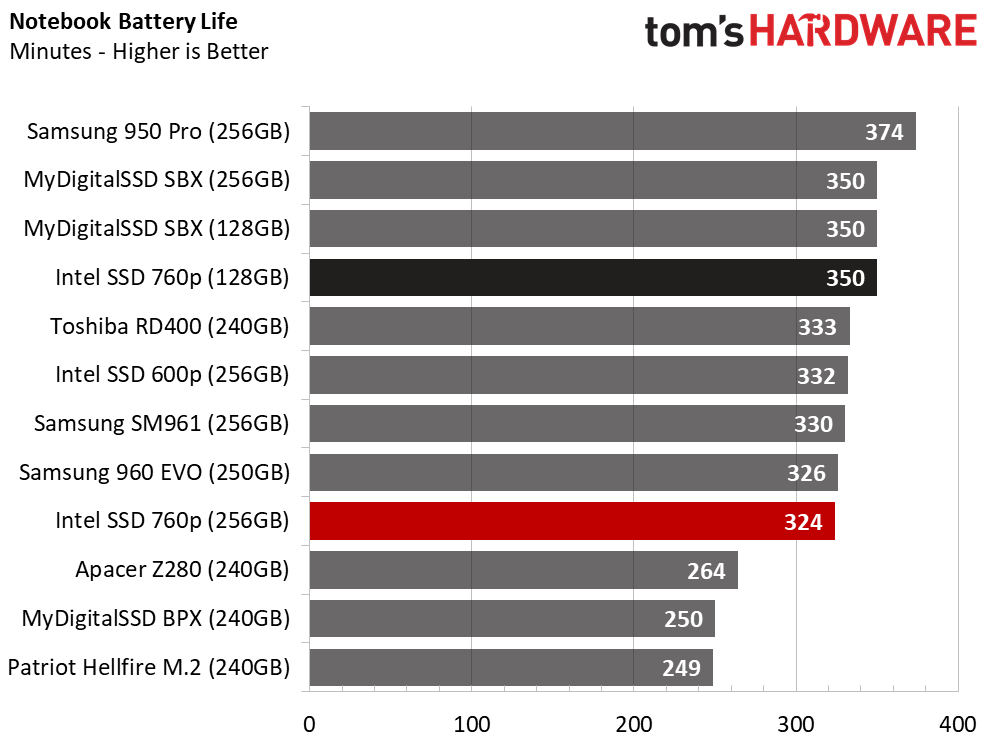
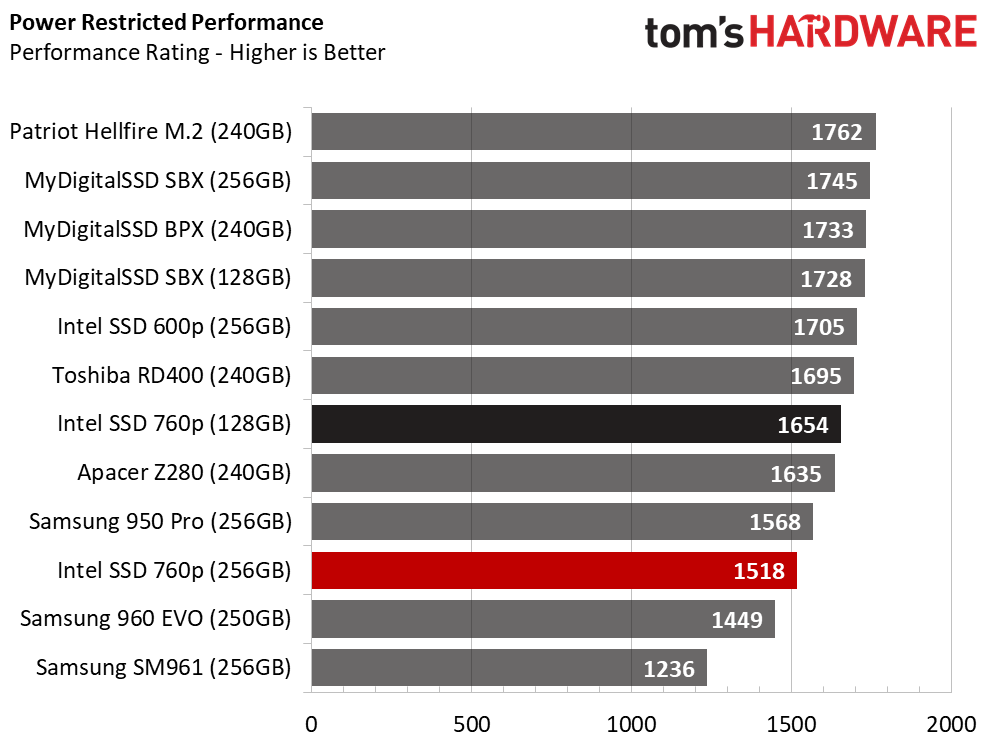
The high disk busy time measurement from earlier helps us understand why the 256GB Intel 760p falls short of the 600p result in the notebook battery life test. The 256GB 760p performed better than products using the Phison PS5007-E7 controller, but we expected more from an Intel NVMe SSD.
MORE: Best SSDs
MORE: How We Test HDDs And SSDs
MORE: All SSD Content
Current page: 256GB And 128GB Class Performance
Prev Page 512GB Class Performance Next Page Conclusion
Chris Ramseyer was a senior contributing editor for Tom's Hardware. He tested and reviewed consumer storage.
-
AgentLozen I'm really impressed with the 760p. It isn't a performance king but for what it can do, it has an amazing price point. Intel made good on it's promise of 2x the performance of the 600p.Reply
$200 for a 512GB NVMe SSD is a good price, but it's still expensive compared to similarly sized SATA drives. Do you suppose NVMe drives will fall enough in the next year to make them competitive with SATA pricing? -
mcconkeymike I own the 600p in a laptop, while it isn't bad, I can see its shortcomings. I hope that once this 760p launches and gets a firmware update that it will be as good as we hope. With that price, I'm sure I'll be eyeballing it hard.Reply -
nooneymous I find it funny that all of these measurements are used to compare ssds, but when it comes to the "real world" there's little difference in perf. PCmark8 shows almost no sensitivity for all the goodness. Does that mean just by the cheapest SSD with a reasonable warranty?Reply -
237841209 Meltdown affects processors, not SSDs. They wouldn't include a whole updated copy of Windows 10 if that's what you're implying.Reply -
Co BIY 1. Also looking forward to the review of the new MyDigitalSSD. I have been pleased with my BPX.Reply
2. Imagine if Intel stirred in a little Xpoint cache into the drives. We know they have the algorithms. I am a lot out of my depth but would the Xpoint work well for the "Datamap/Addressing list" that seems to be a major bottle neck for the newer drives. Seems like a place for synergy.
3. When is Microsoft going to get off the dime and improve the OS handling of these technologies ? It seems like Microsoft should be the next major innovator in the storage space. -
cryoburner ReplySome users may want to run the drive in a workstation environment, but we don't recommend even light professional applications due to the relatively low endurance rating.
The 512GB drive you tested allows for 288TB to be written to it. At 10GB of writes per day, it would take someone nearly 80 years to hit that amount of writes to the drive. In order to hit that amount of writes within the drive's 5-year warranty, one would need to write close to 160GB to it every single day, 7 days a week for those 5 years. Unless the system were being used in some extreme usage scenario, the differences in endurance between any of these drives shouldn't matter much at all.
I could see a particularly heavy user potentially running into the write limit of the lowest capacity 128GB drive, since you would only need to write about 40GB per day to hit that within 5 years, but for any of the other capacities it seems fairly unlikely. And I would still not classify 40GB of writes per day as "light" professional use.
