Why you can trust Tom's Hardware
Intel Core i9-11900K and Core i5-11600K Gaming Performance — The TLDR
Below you can see the geometric mean of our gaming tests at 1080p and 1440p, with each resolution split into its own chart to give us a decent overall view of the current landscape. As per usual, we're testing with an Nvidia GeForce RTX 3090 to reduce GPU-imposed bottlenecks as much as possible, and differences between test subjects will shrink with lesser cards or higher resolutions. You'll find the game-by-game breakdowns further below.
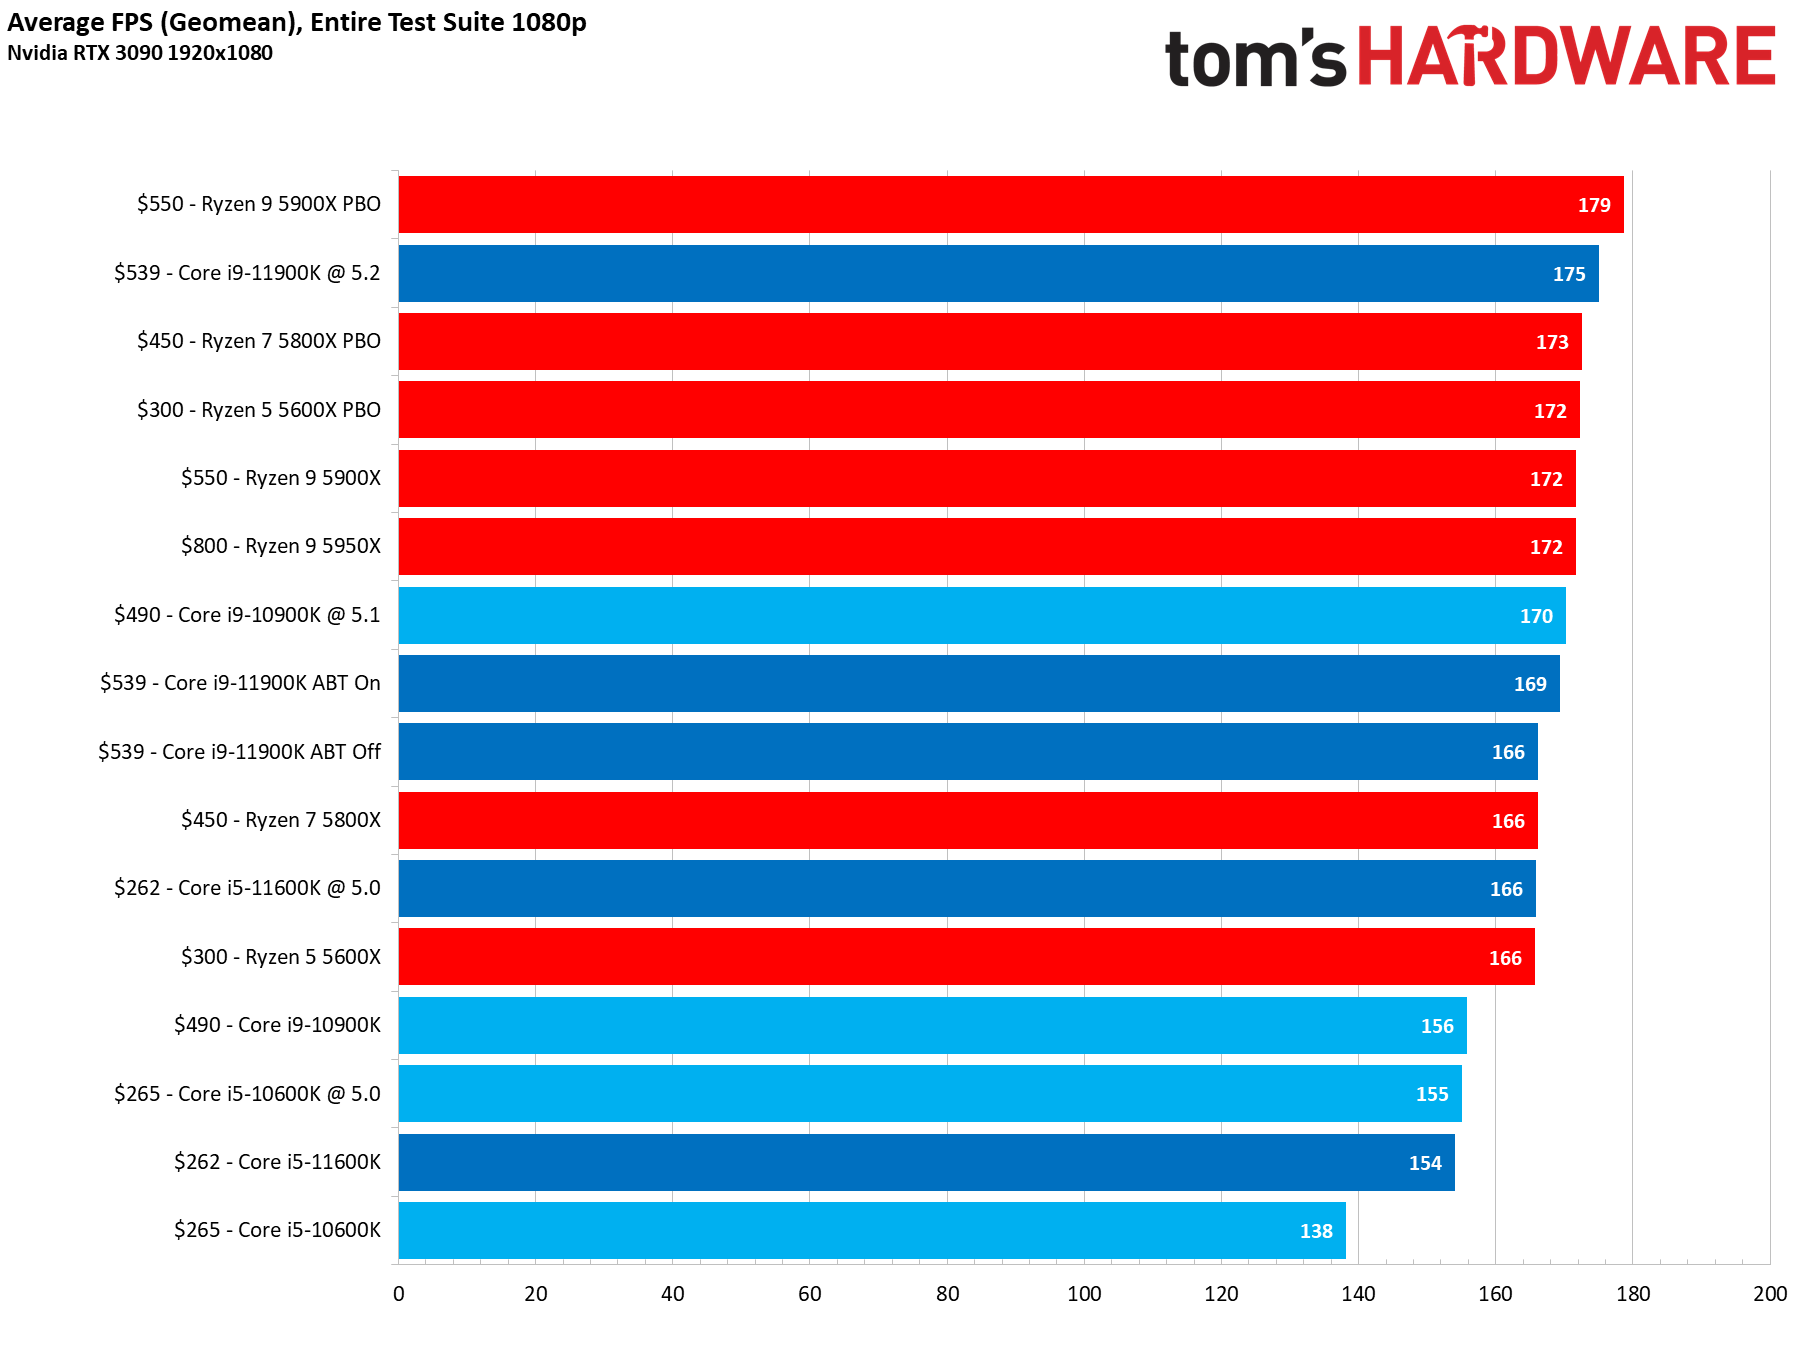
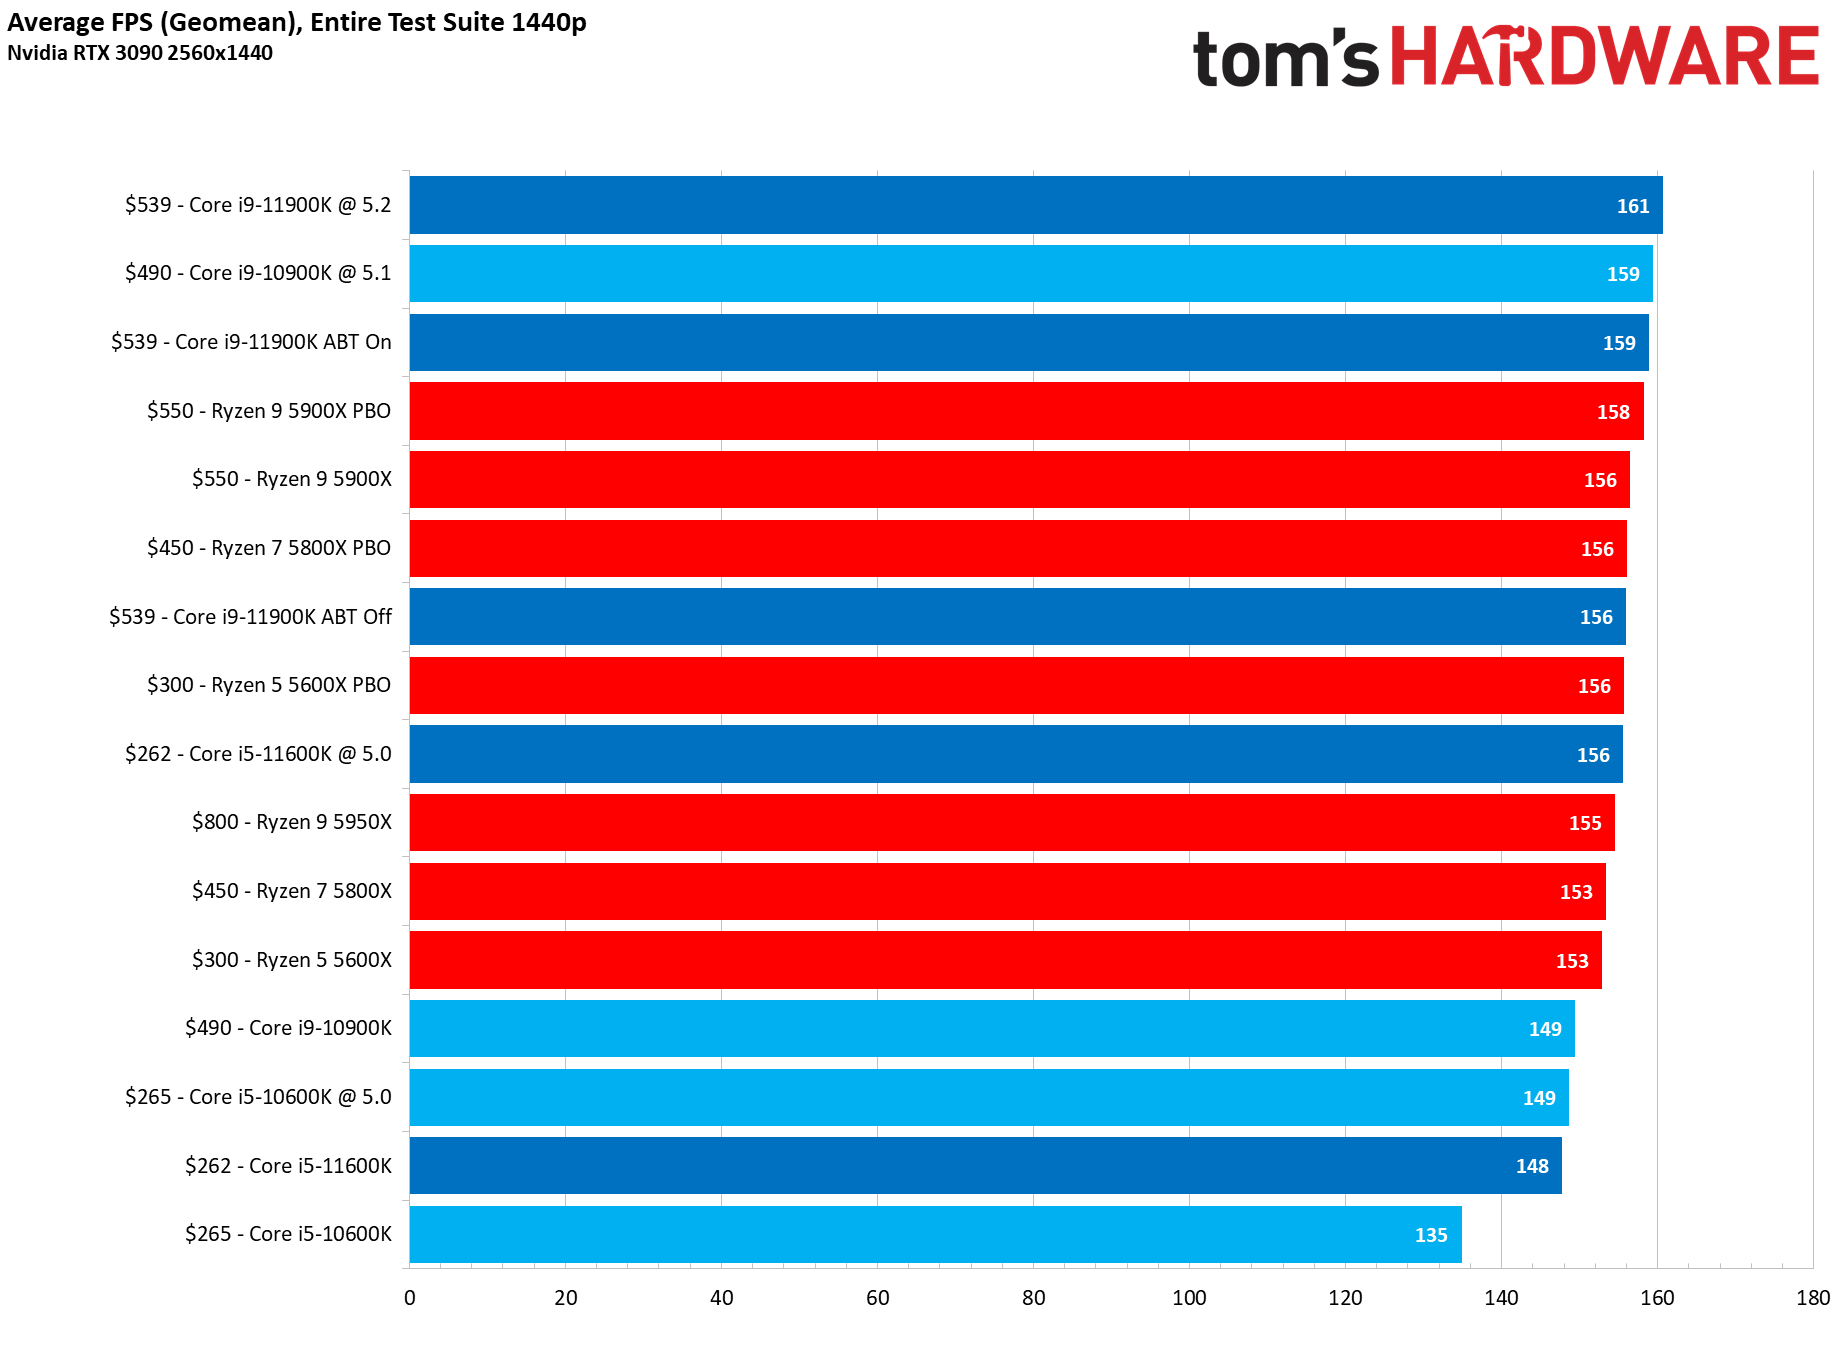
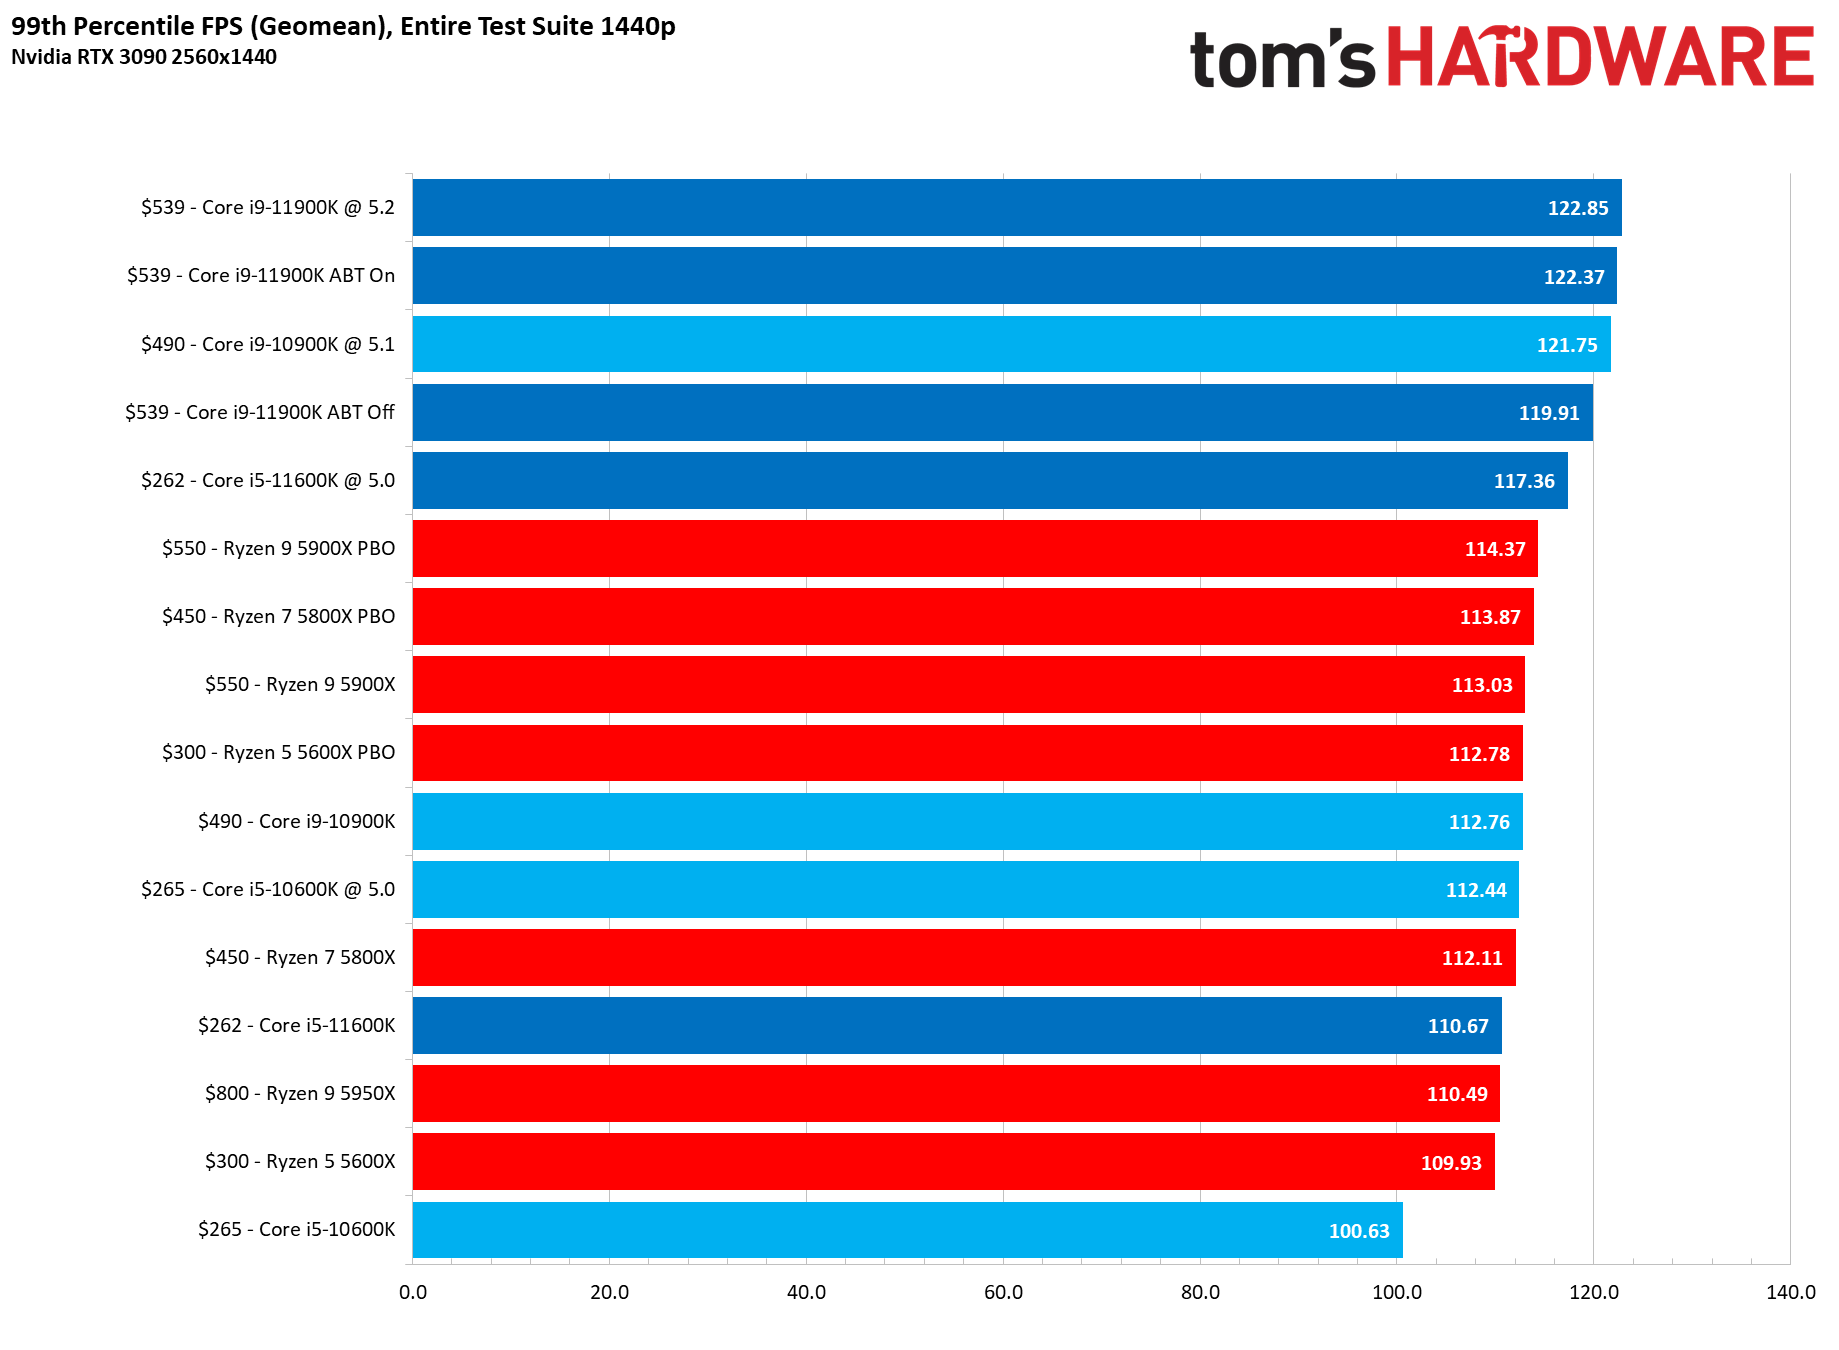
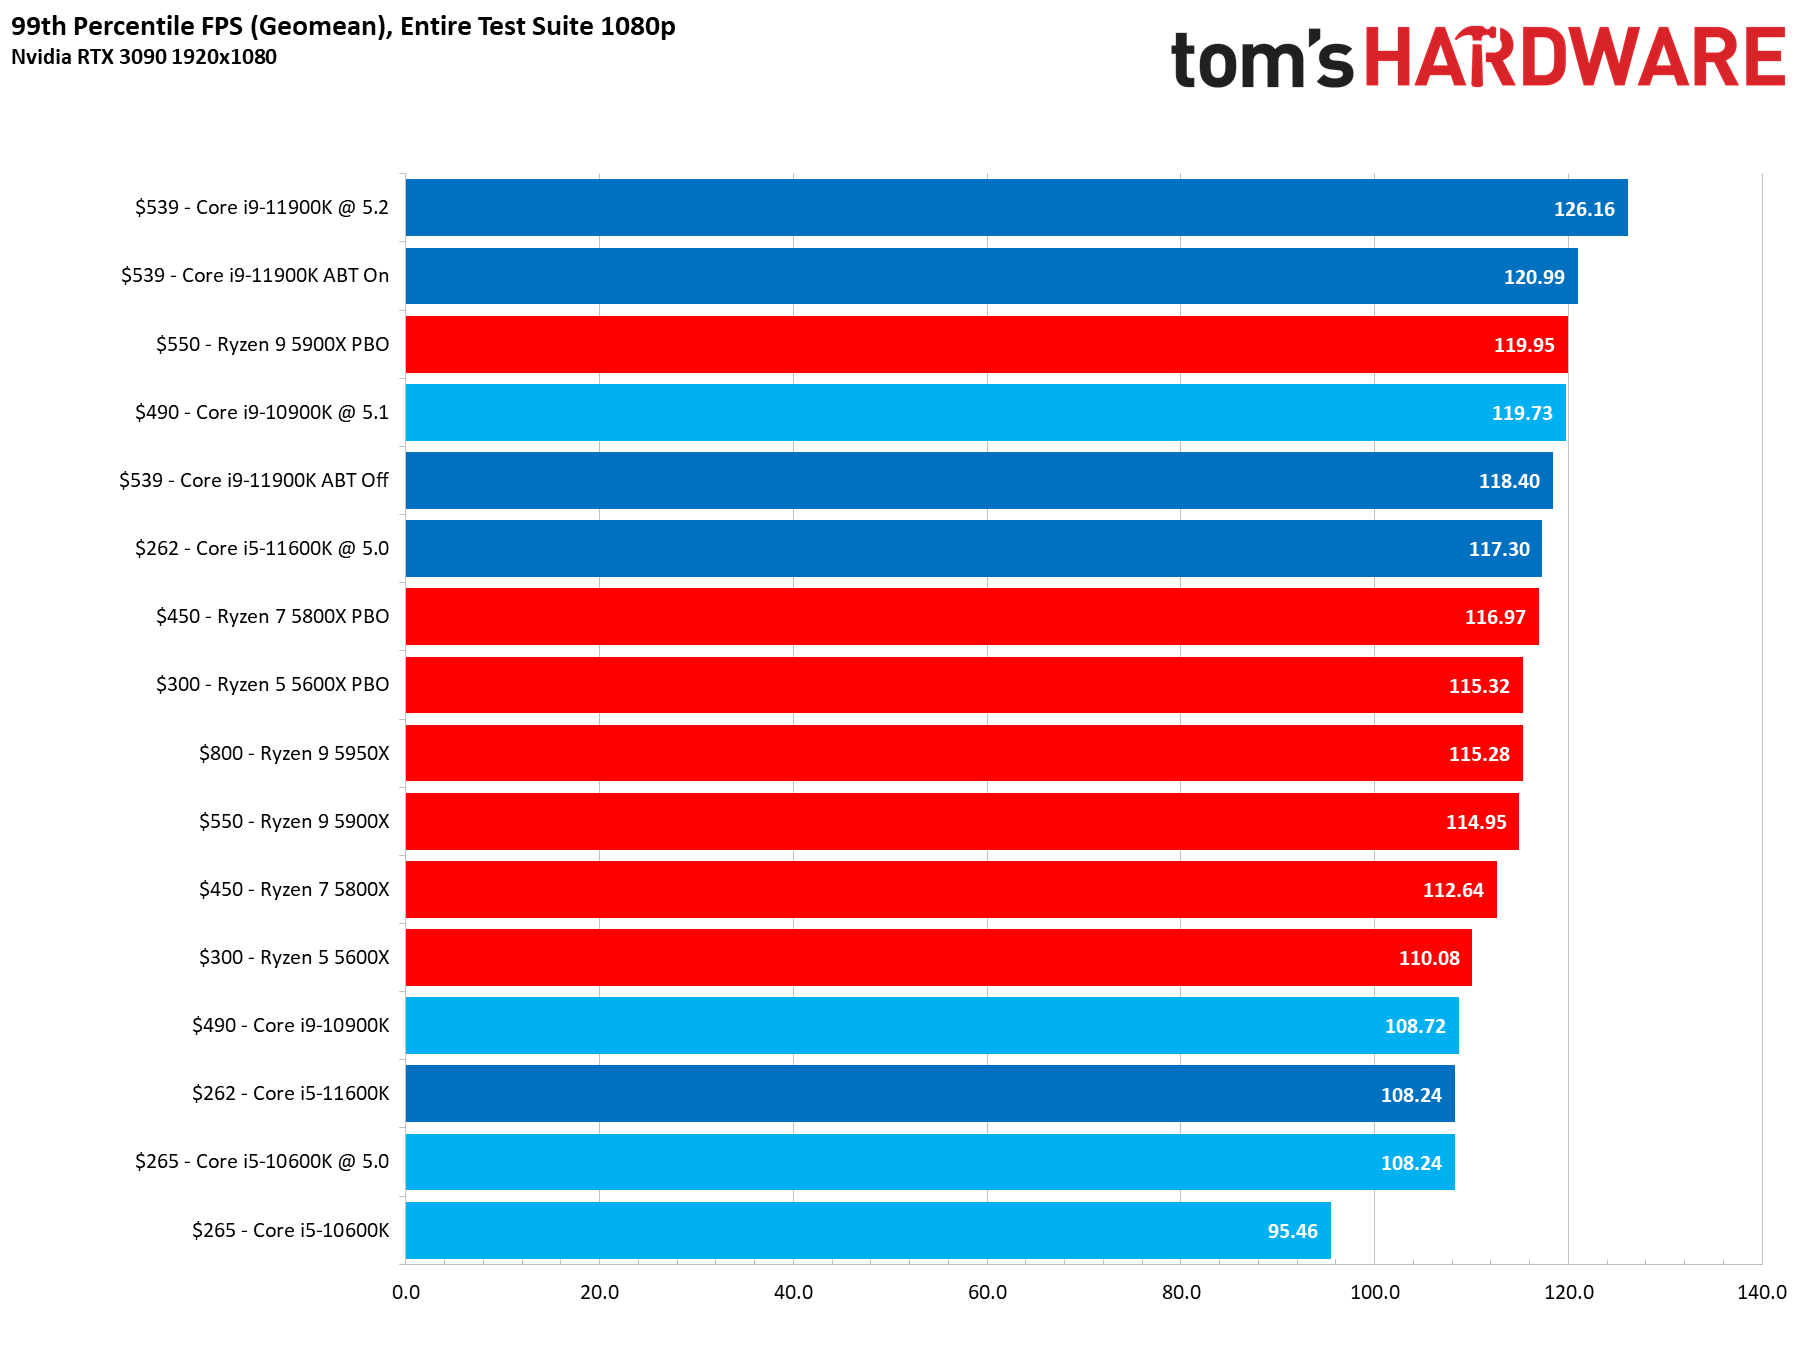
For our stock configurations, we tested the Core i9-11900K with both ABT enabled and disabled. As you can see, the delta between these two settings lands at 3 fps for 1080p when measured over our entire test suite, meaning the difference in gaming typically isn't going to be noticeable. However, a few heavily-threaded titles will benefit. We see a bit more gaming uplift with our overclocked setup, amounting to a more substantial 5.5% increase over the non-ABT configuration.
At 1080p, the bare stock 11900K configuration trails the Ryzen 9 5950X and 5900X by 6 fps, and toggling ABT shrinks the gap to 3 fps. Without ABT, the 11900K ties the 5800X and 5600X. The 11900K has taken a big step forward over the 10900K in gaming, bringing Intel into closer competition with AMD and narrowing the delta between the highest-end chips, at least when viewed as a cumulative measure. The Core i9-11900K is more competitive after overclocking, but the Ryzen 9 5900X still leads in both stock and overclocked configurations though, giving AMD the bragging rights, if only by slim margins.
AMD's Ryzen 5 5800X trails the ABT 11900K by 3 fps, and after tuning, the delta shrinks to 2 fps. Given its much cheaper price point (if we look at MSRPs), not to mention the 5600X that's just as good at gaming and a far better deal, Intel hasn't really solidified a meaningful enough lead in gaming with the 11900K to make it a key differentiating feature worthy of charging such a hefty premium.
The picture is a bit brighter for Intel on the lower-end, with the Core i5-11600K gaining 11.5% over the previous-gen 10600K at stock settings in the 1080p benchmarks and gaining 9.6% at 1440p.
The $265 11600K faces off with the $300 Ryzen 5 5600X, and the latter still maintains a healthy lead at stock settings — you'll have to overclock the Core i5-11600K to match the stock Ryzen 5 5600X. You can tune the Ryzen chip, too, for some additional uplift that will give it the lead over the 11600K.
Assuming you can find both the 11600K and 5600X at suggested/tray pricing, Intel's aggressive pricing here is a key attraction. The 11600K serves up quite a bit of performance for a $262 chip, and the graphics-less 11600KF is a steal for $237 if you can find it close to that price point.
3D Mark, VRMark, Stockfish Chess Engine on Core i9-11900K and i5-11600K
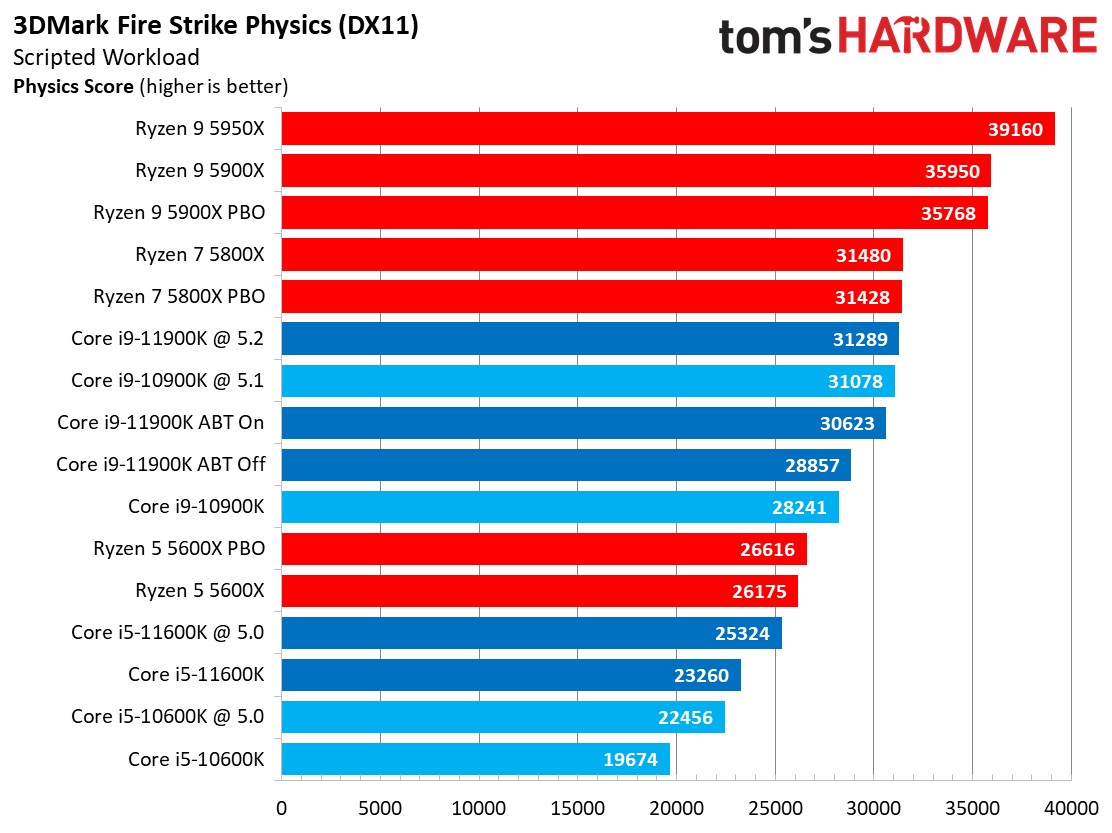
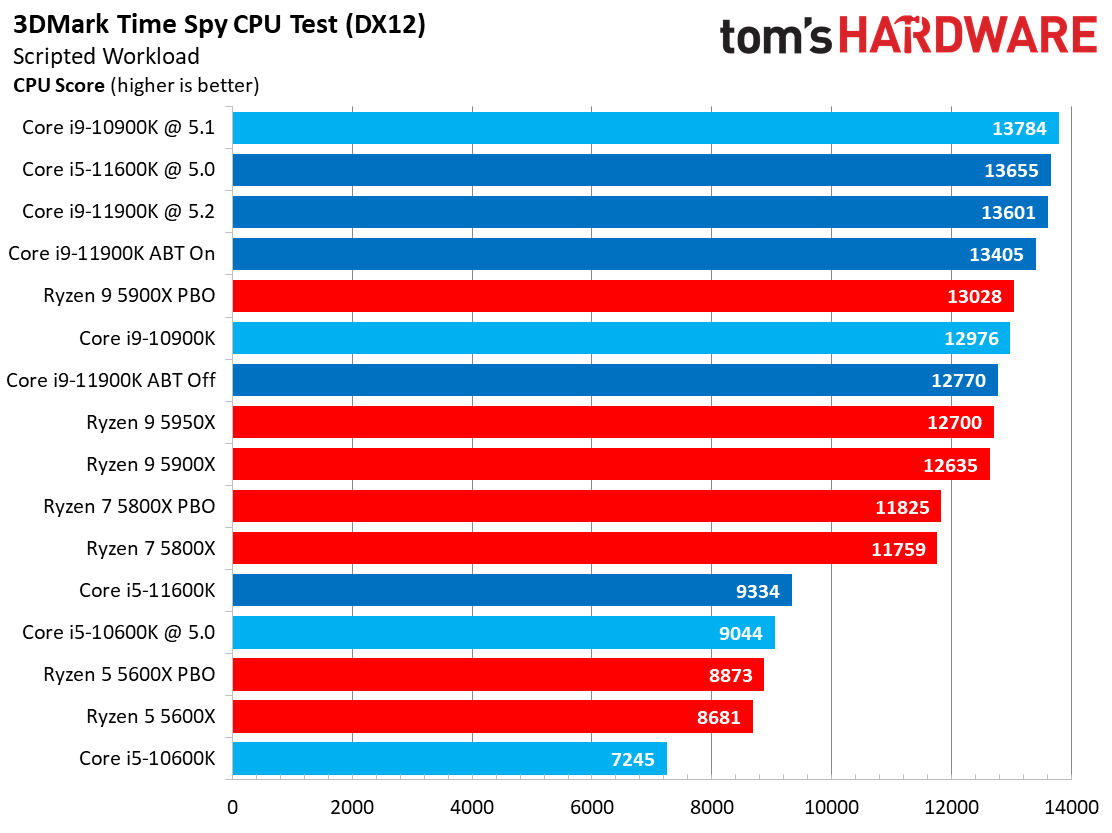
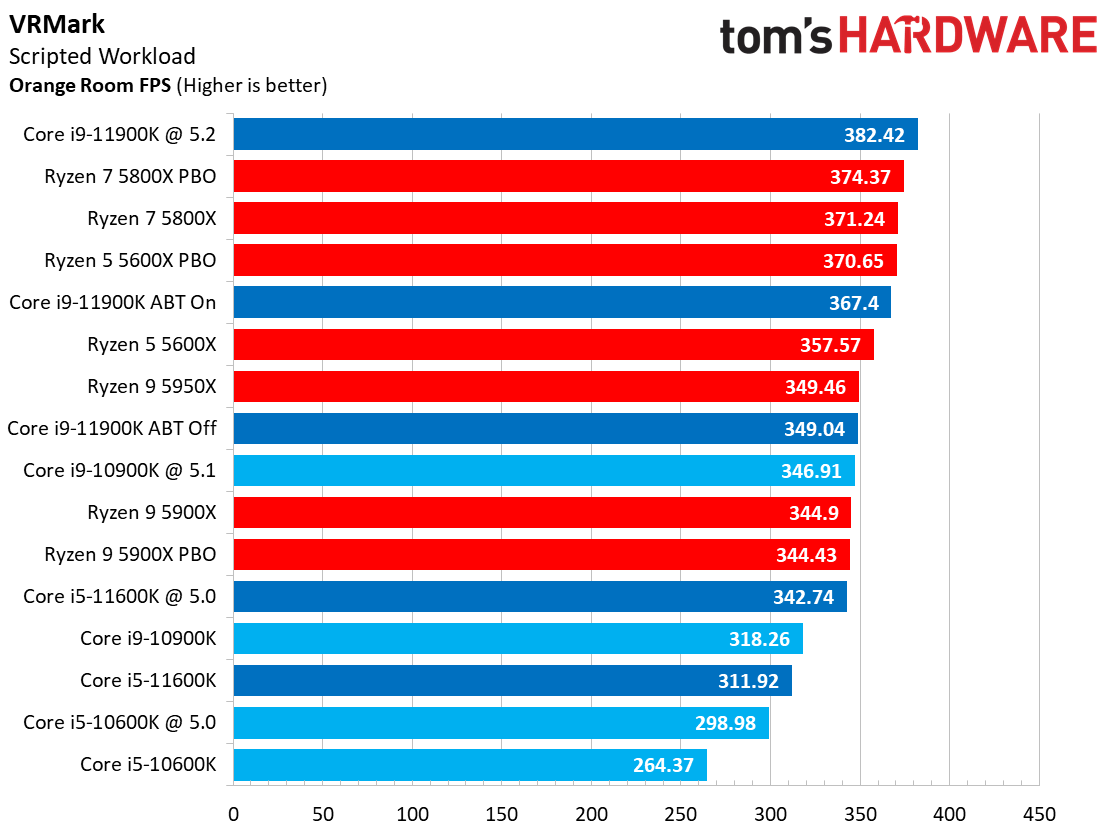
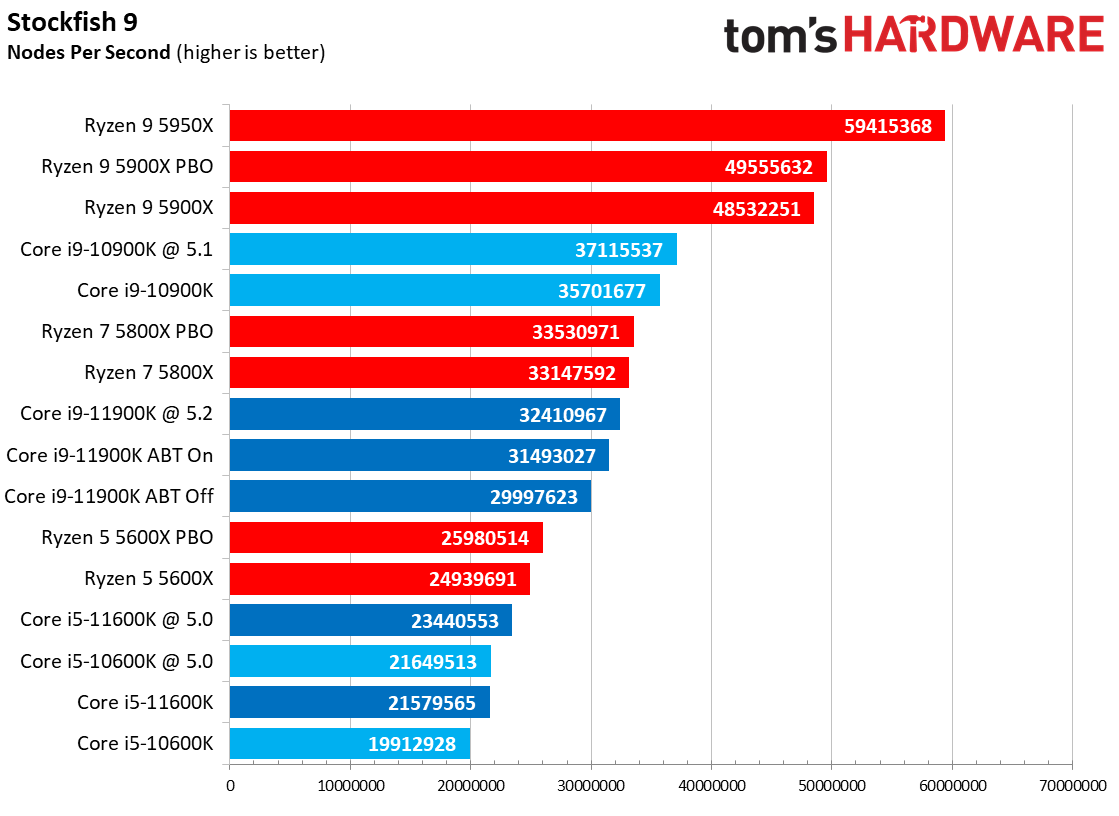
We run these synthetic gaming tests as part of our main application test script. We use an RTX 2080 Ti for these tests to facilitate faster testing, but we use an Nvidia GeForce RTX 3090 for all other gaming benchmarks (we don't include these synthetic tests for the preceding cumulative measurements).
AMD's core-heavy Ryzen 9 processors easily lead in threaded synthetic tests, like the Stockfish chess engine. The 11900K doesn't fare nearly as well, landing ~12% behind its predecessor, the 10900K, which drops Core i9 a rank in this benchmark to land below the Ryzen 7 5800X. Meanwhile, the 11600K takes a small step forward over the 10600K.
Both Rocket Lake chips take big steps forward in VRMark, which leans heavily on per-core performance (a mixture of IPC and frequency).
Get Tom's Hardware's best news and in-depth reviews, straight to your inbox.
Borderlands 3 on Core i9-11900K and i5-11600K
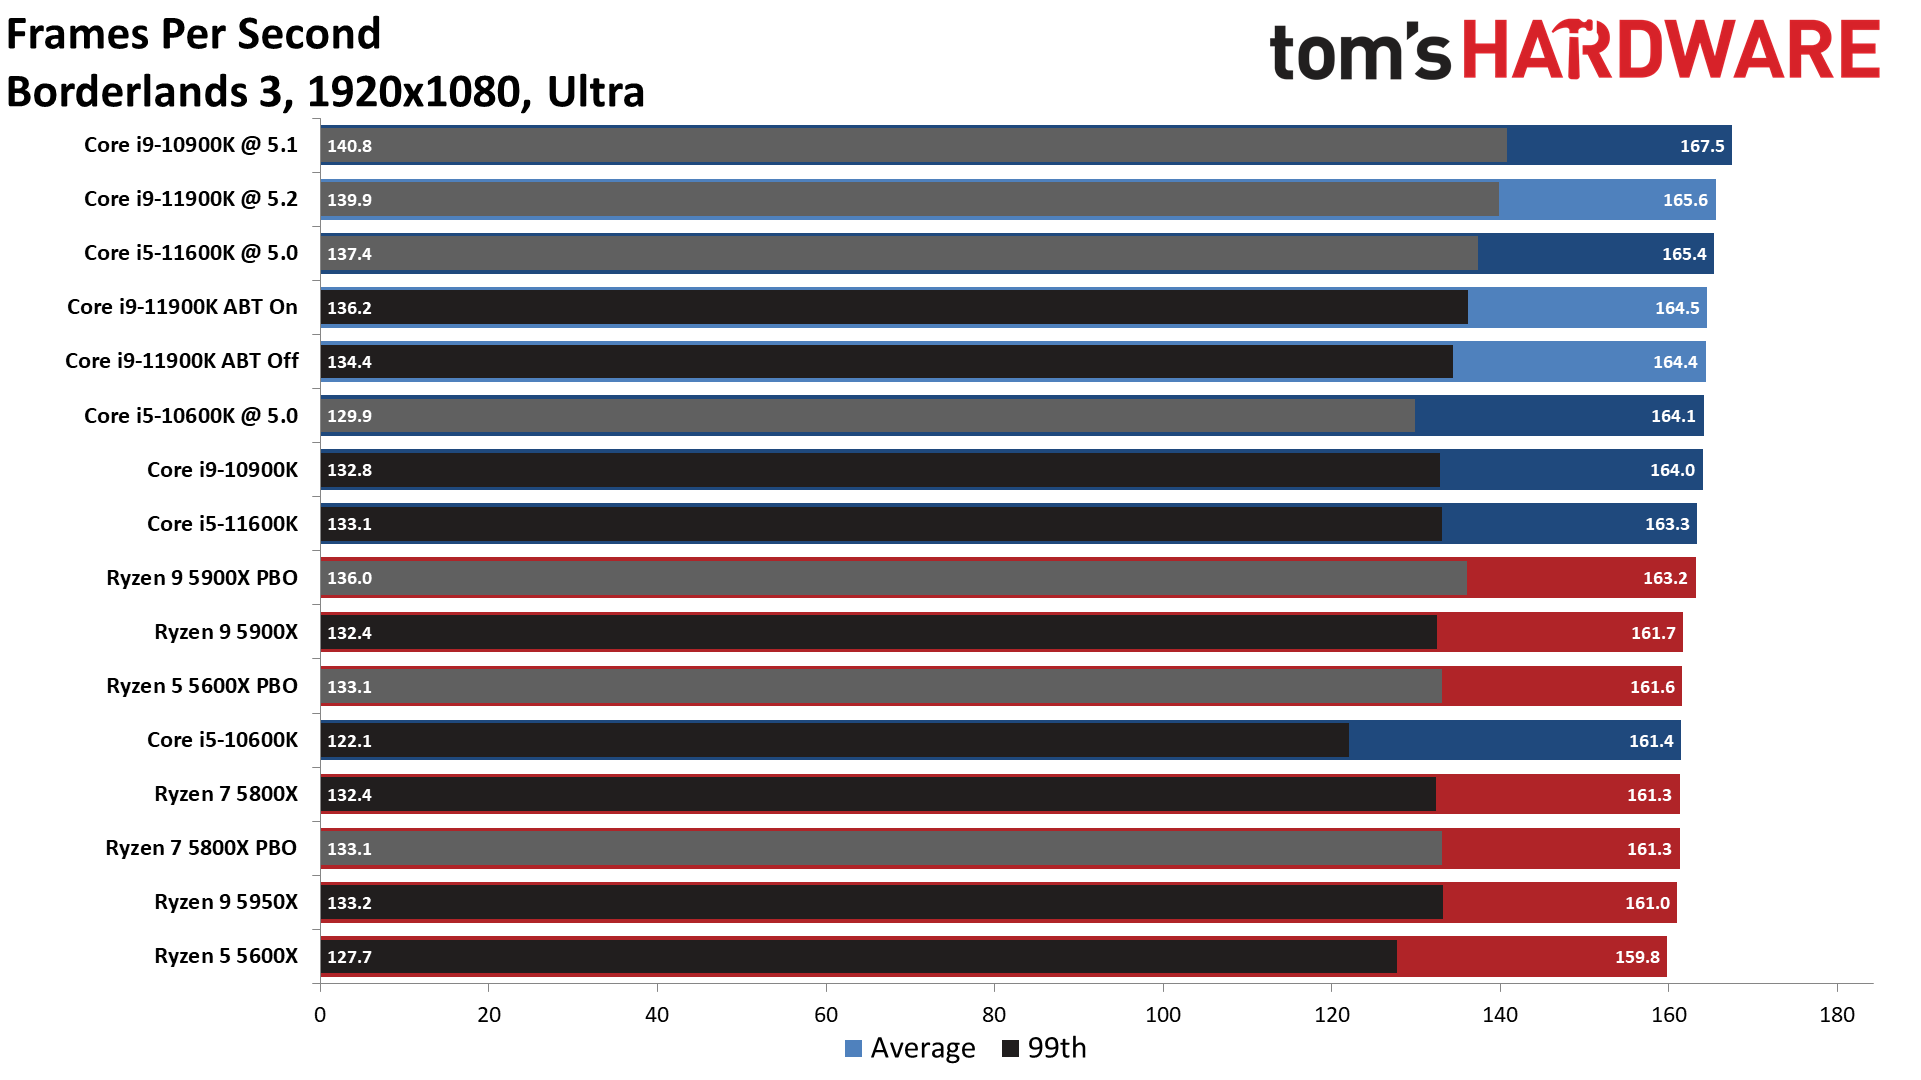
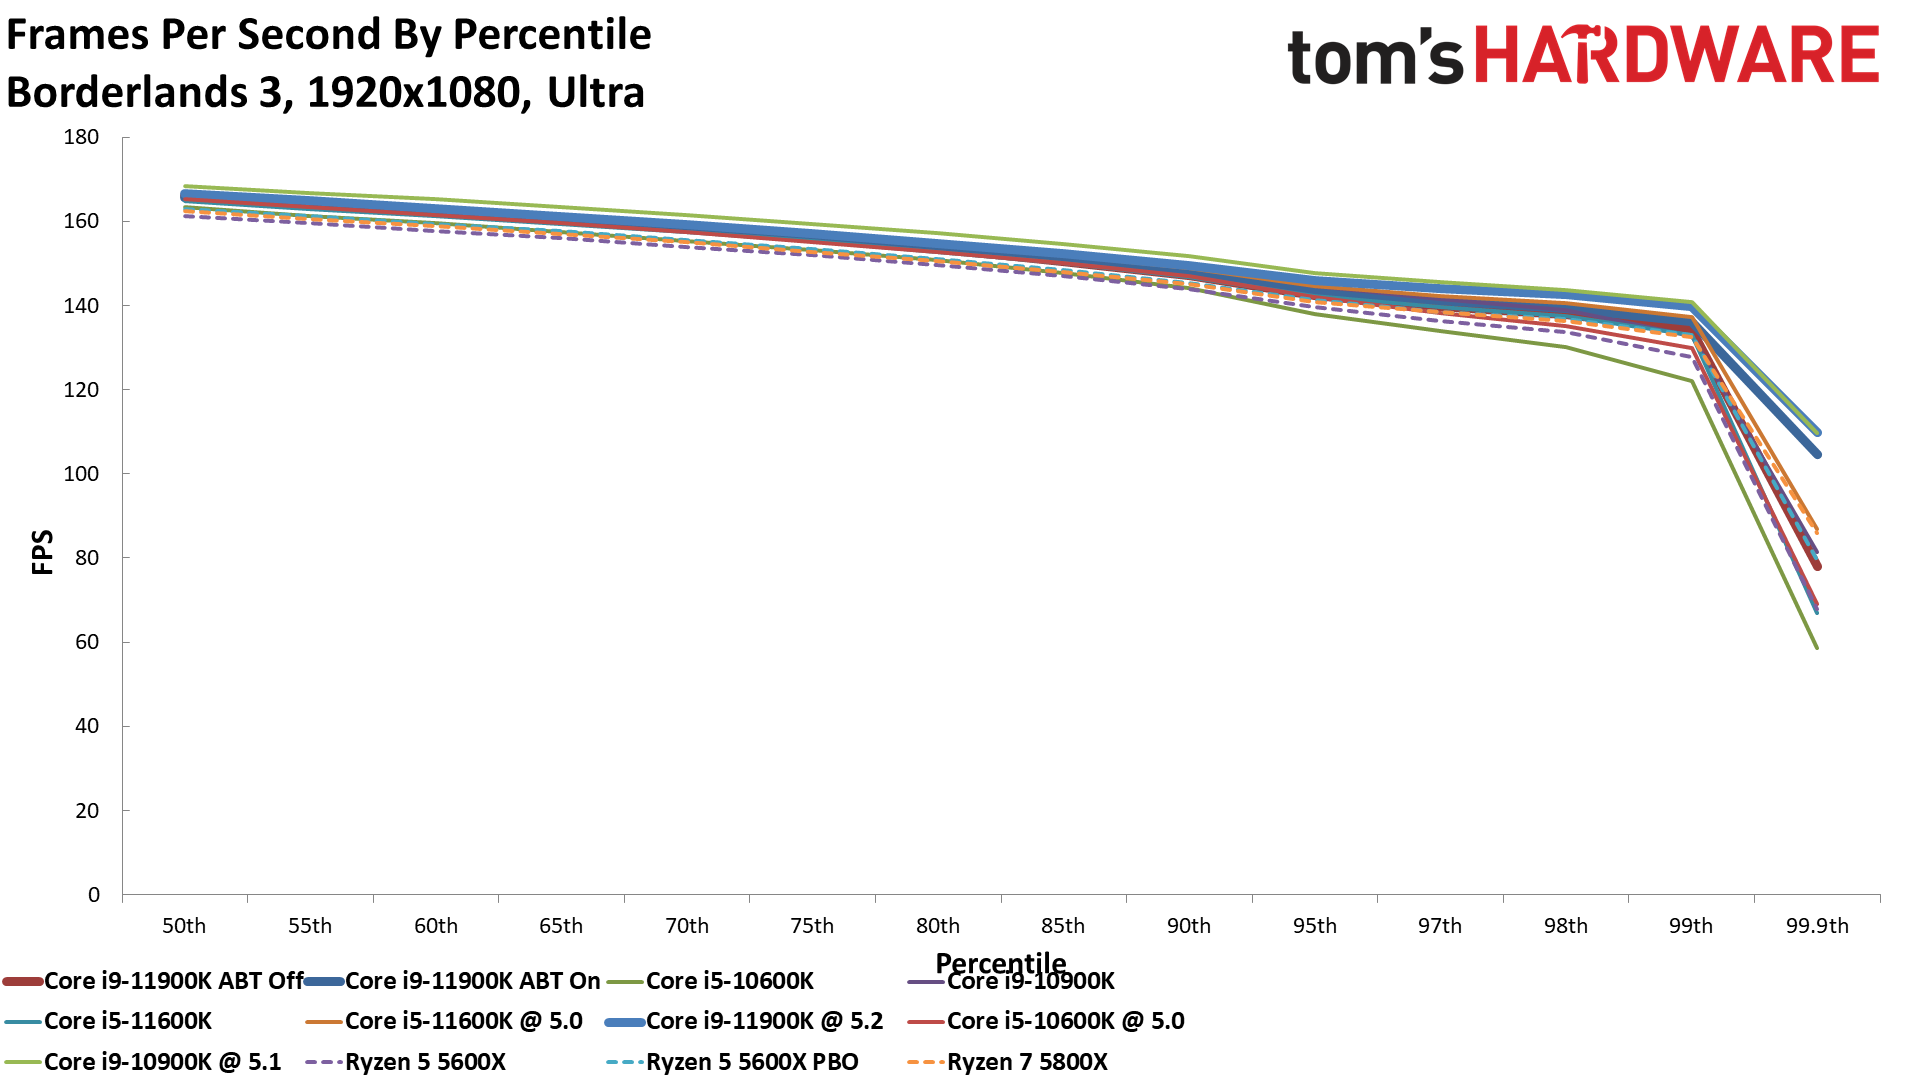
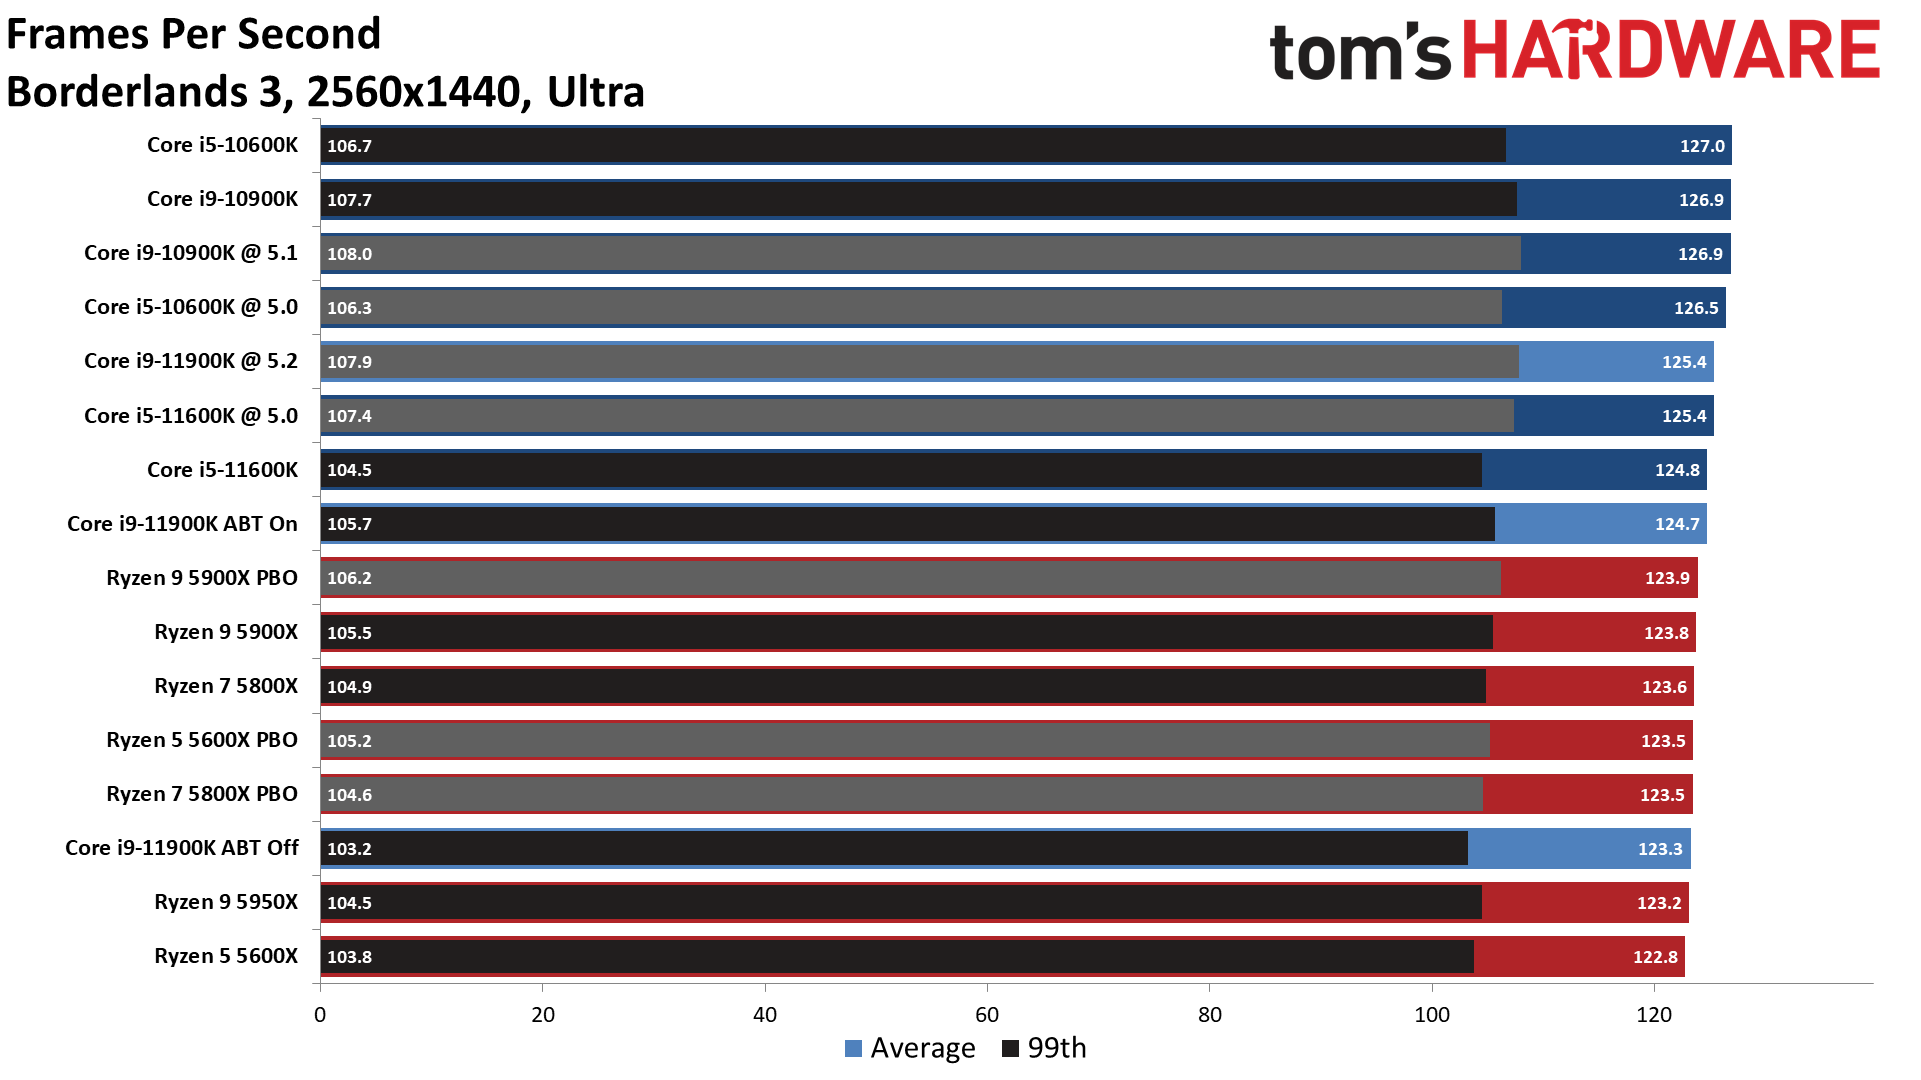
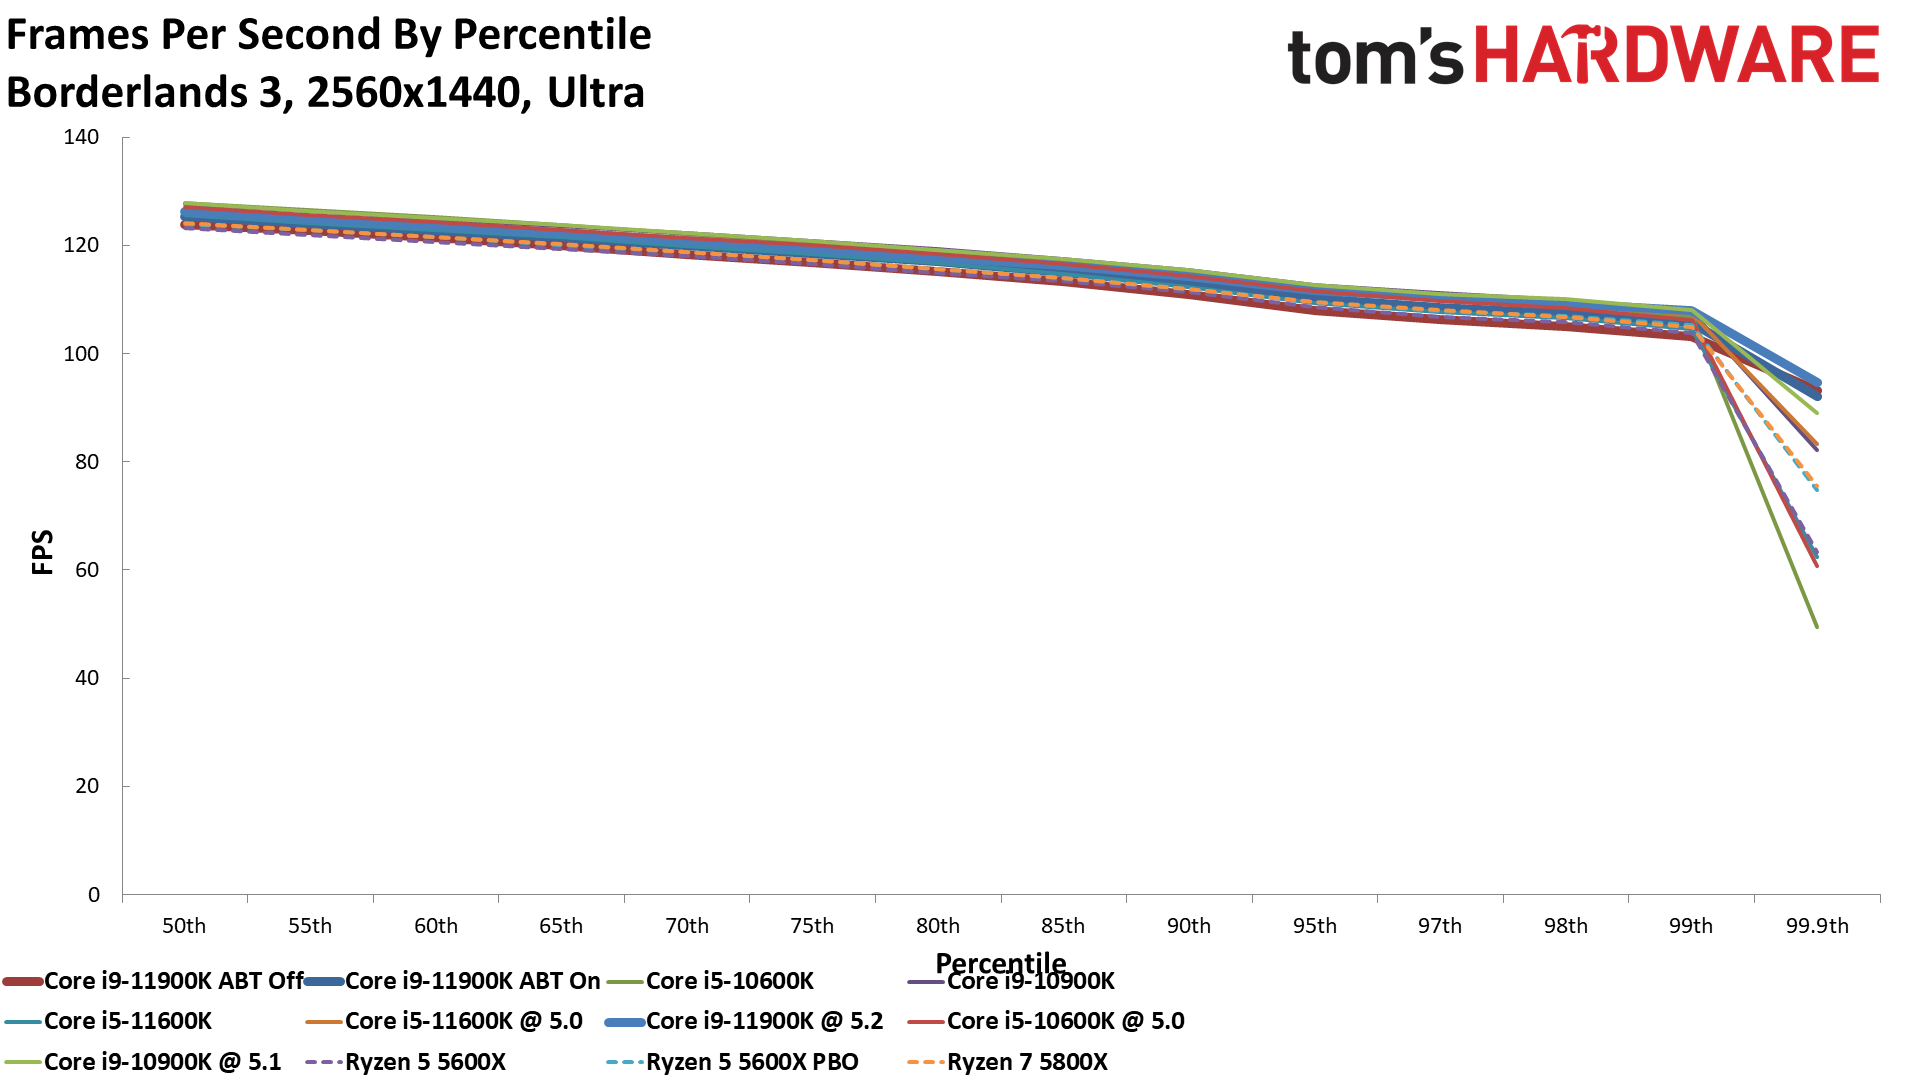
We're clearly on the edge of a graphics bottleneck in Borderlands 3 at both resolutions, so the differences between the chips in this title are slim and will be a wash with lesser GPUs.
Far Cry 5 on Core i9-11900K and i5-11600K
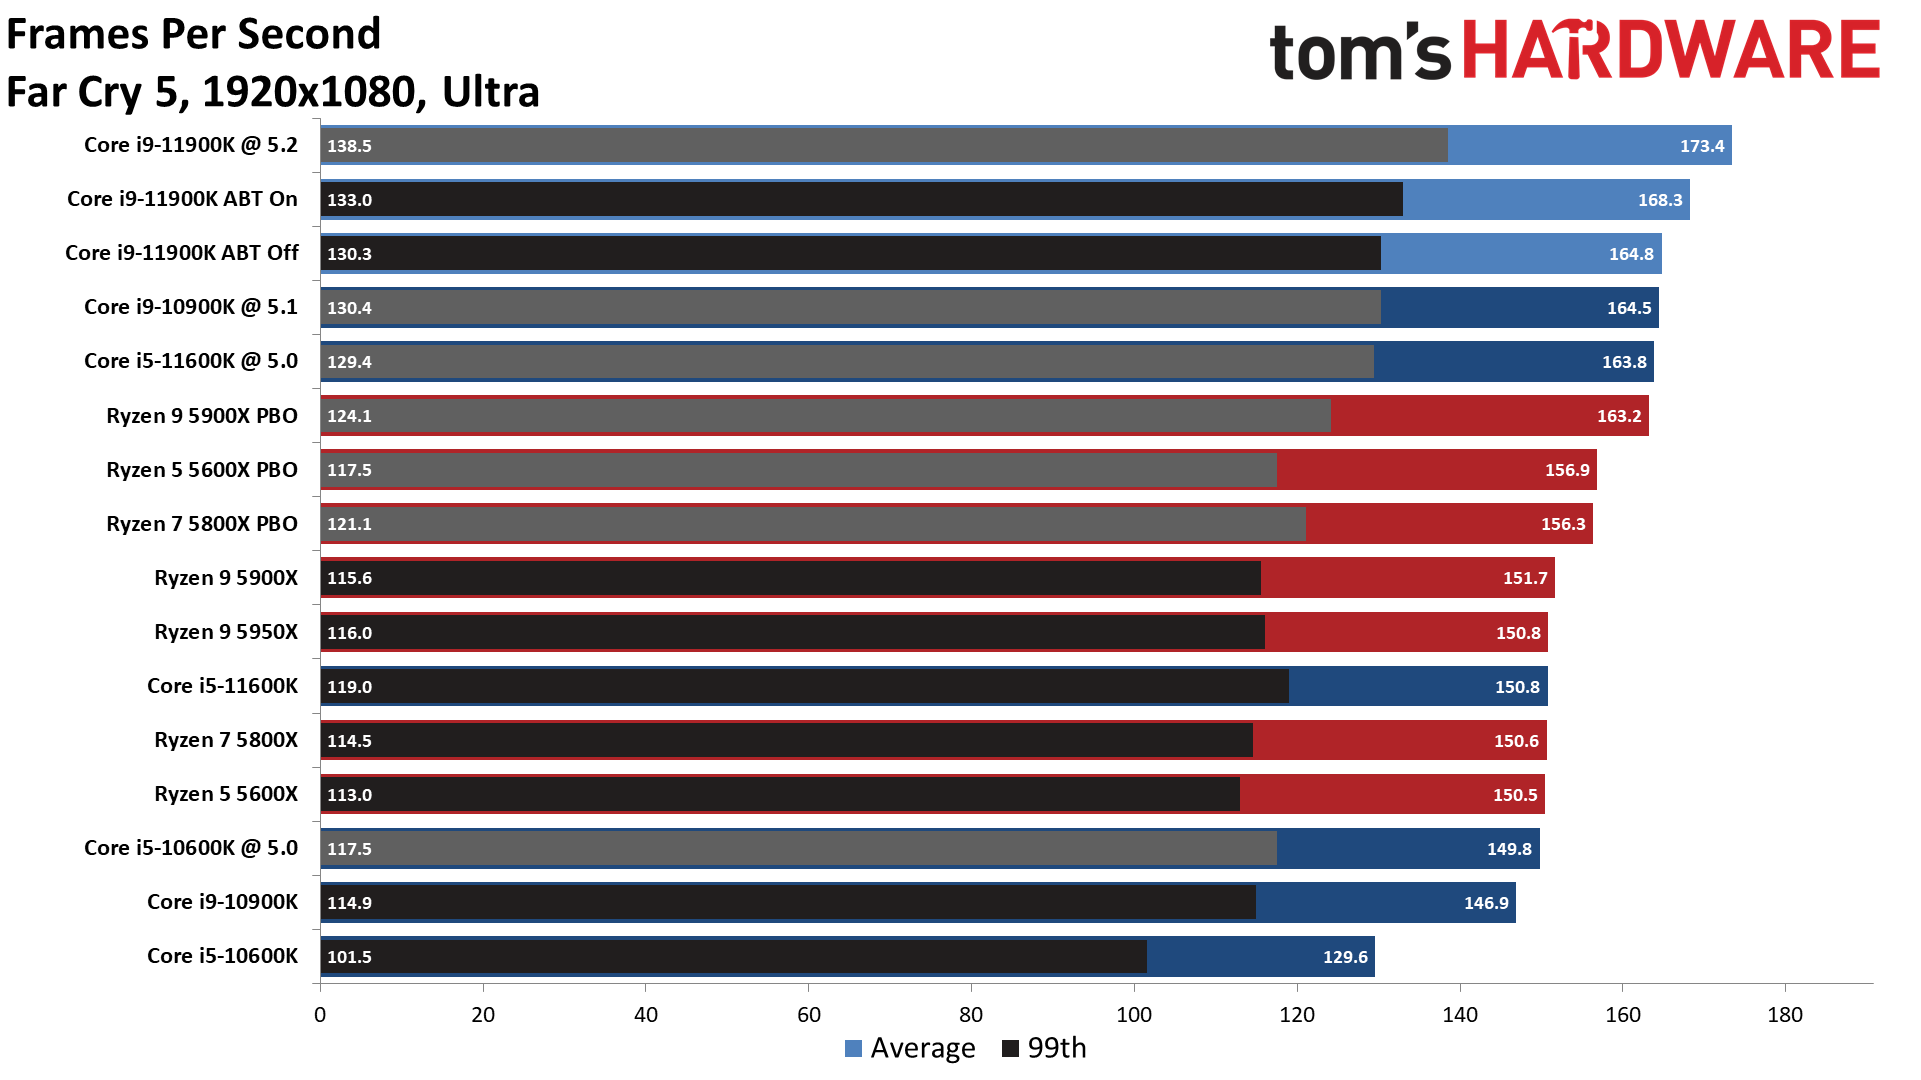
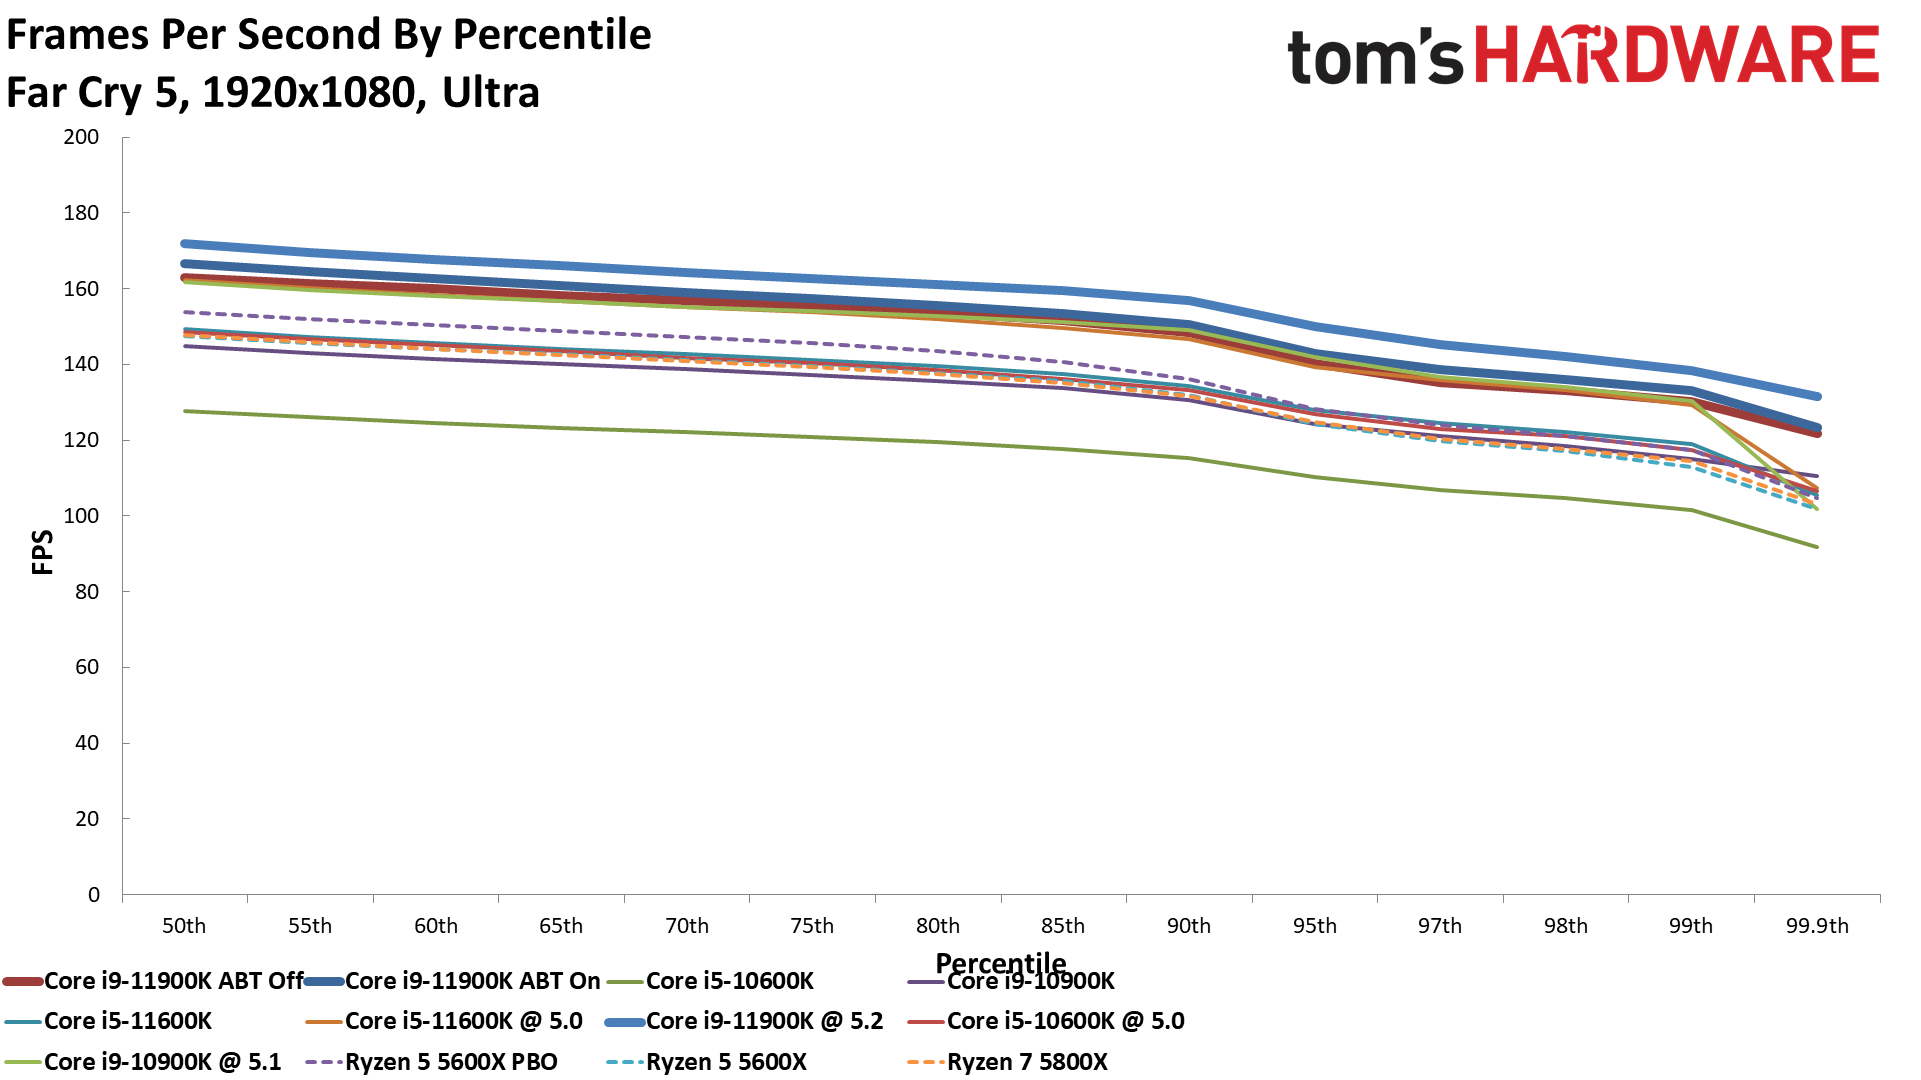
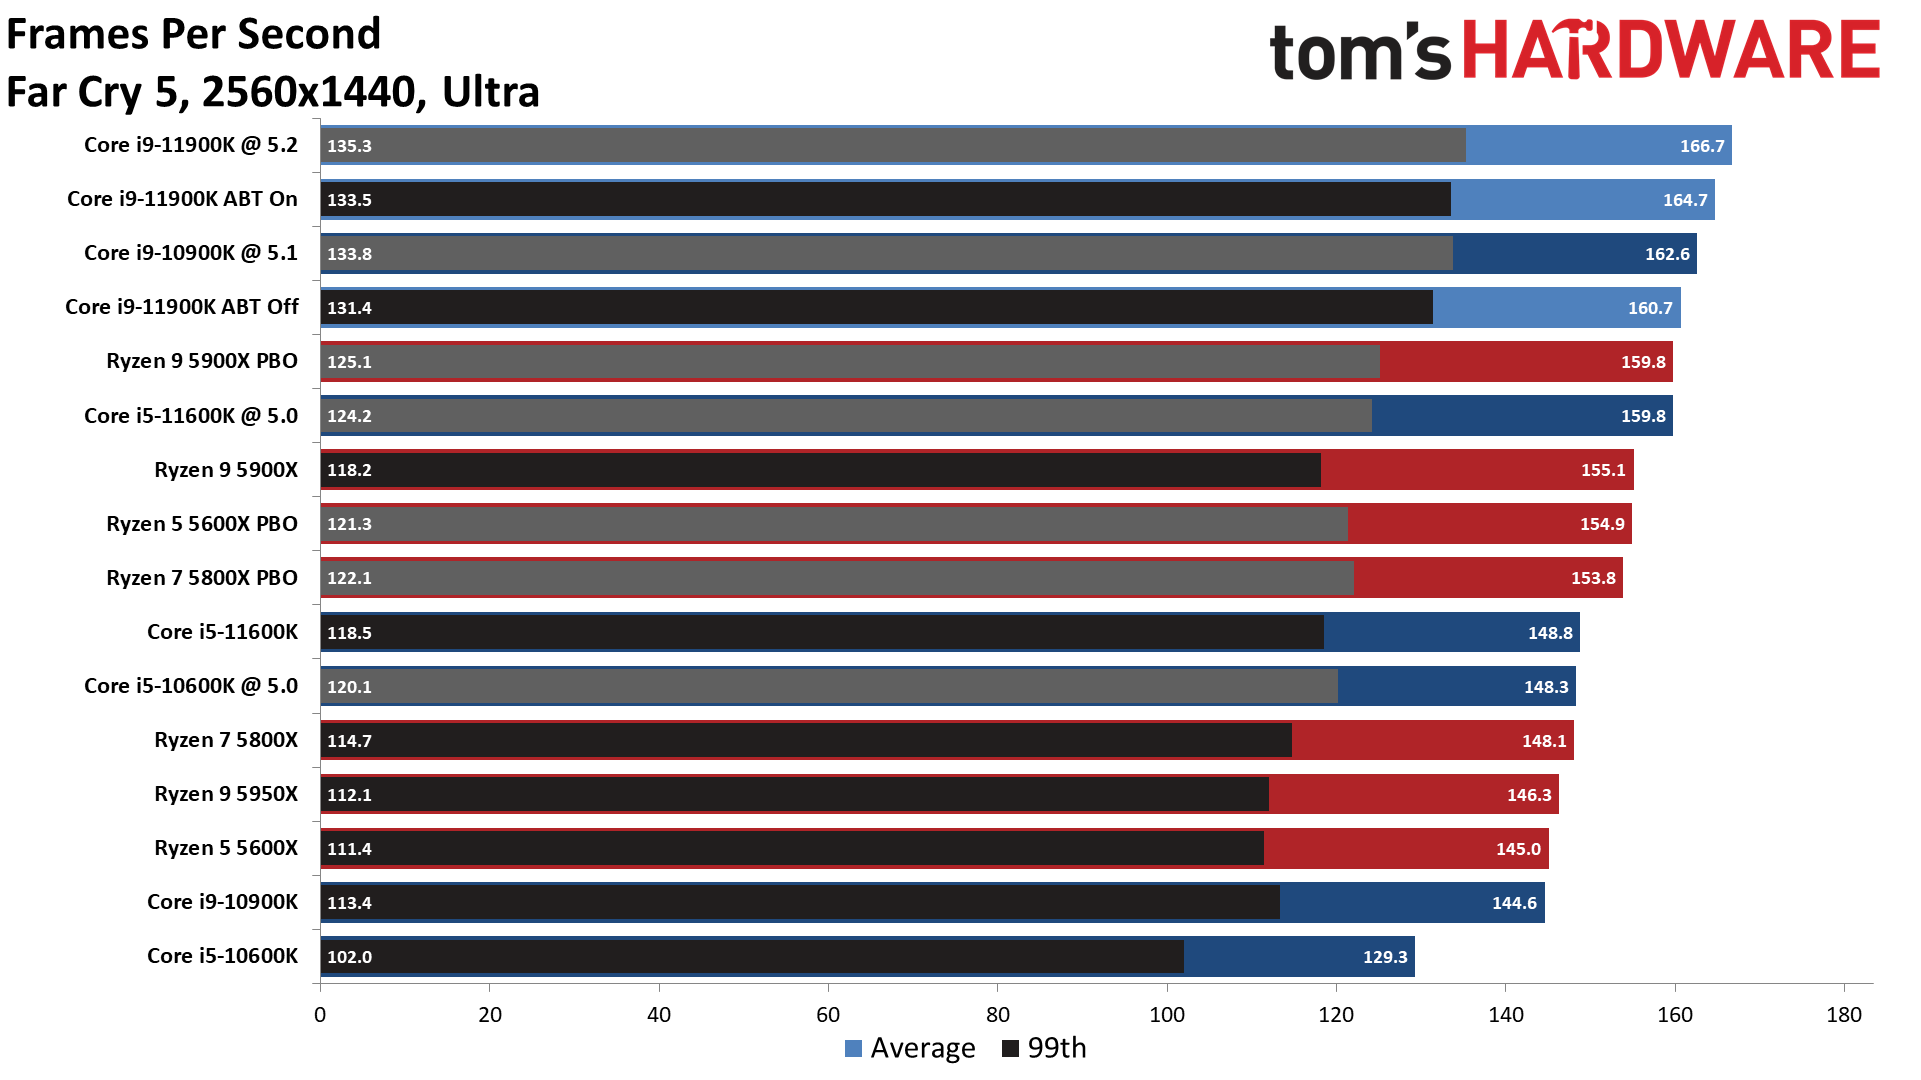
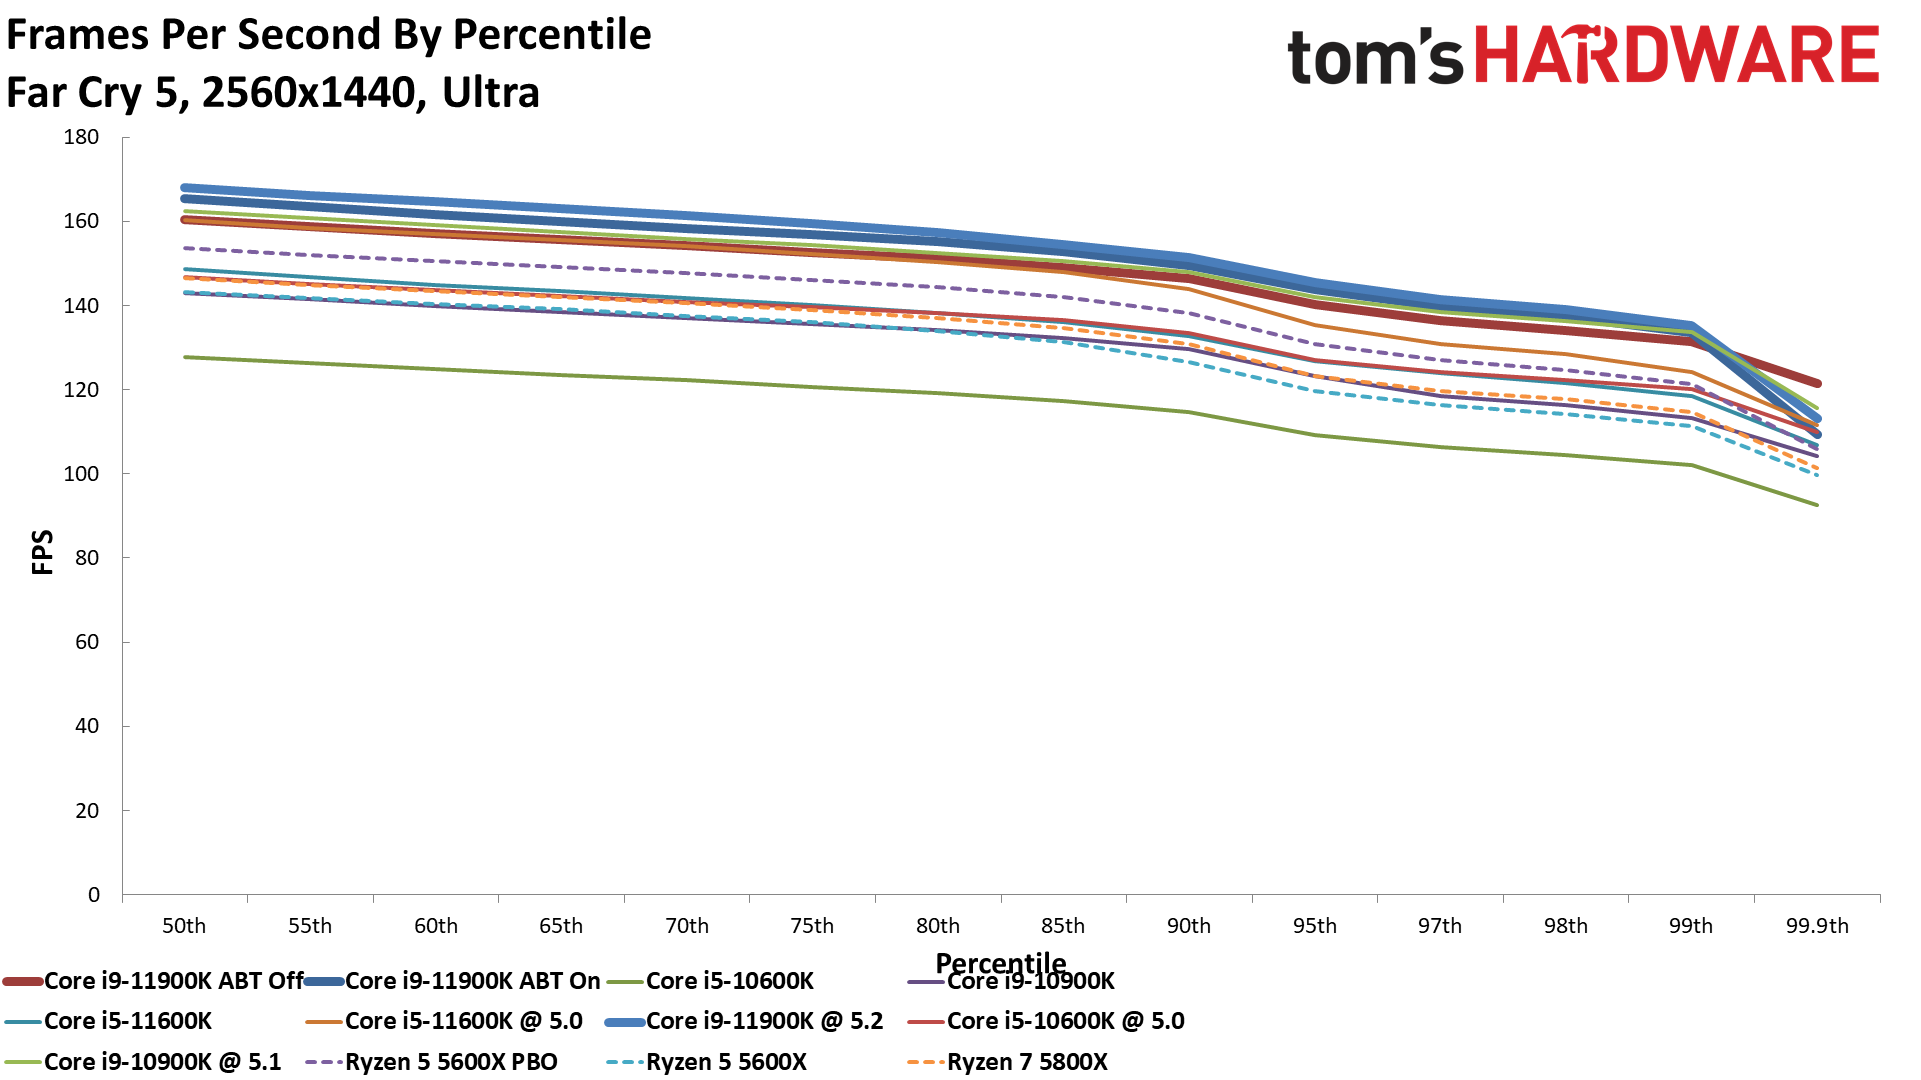
Far Cry 5 brings us back to the land of performance scaling. At 1080p, the Core i9-11900K takes a big step forward and beats the overclocked 10900K, but at stock settings. Likewise, at stock settings, the Core i5-11600K delivers an impressive 16% increase over the previous-gen 10600K and leads the Ryzen competition with a 5.0 GHz overclock.
Hitman 2 on Core i9-11900K and i5-11600K
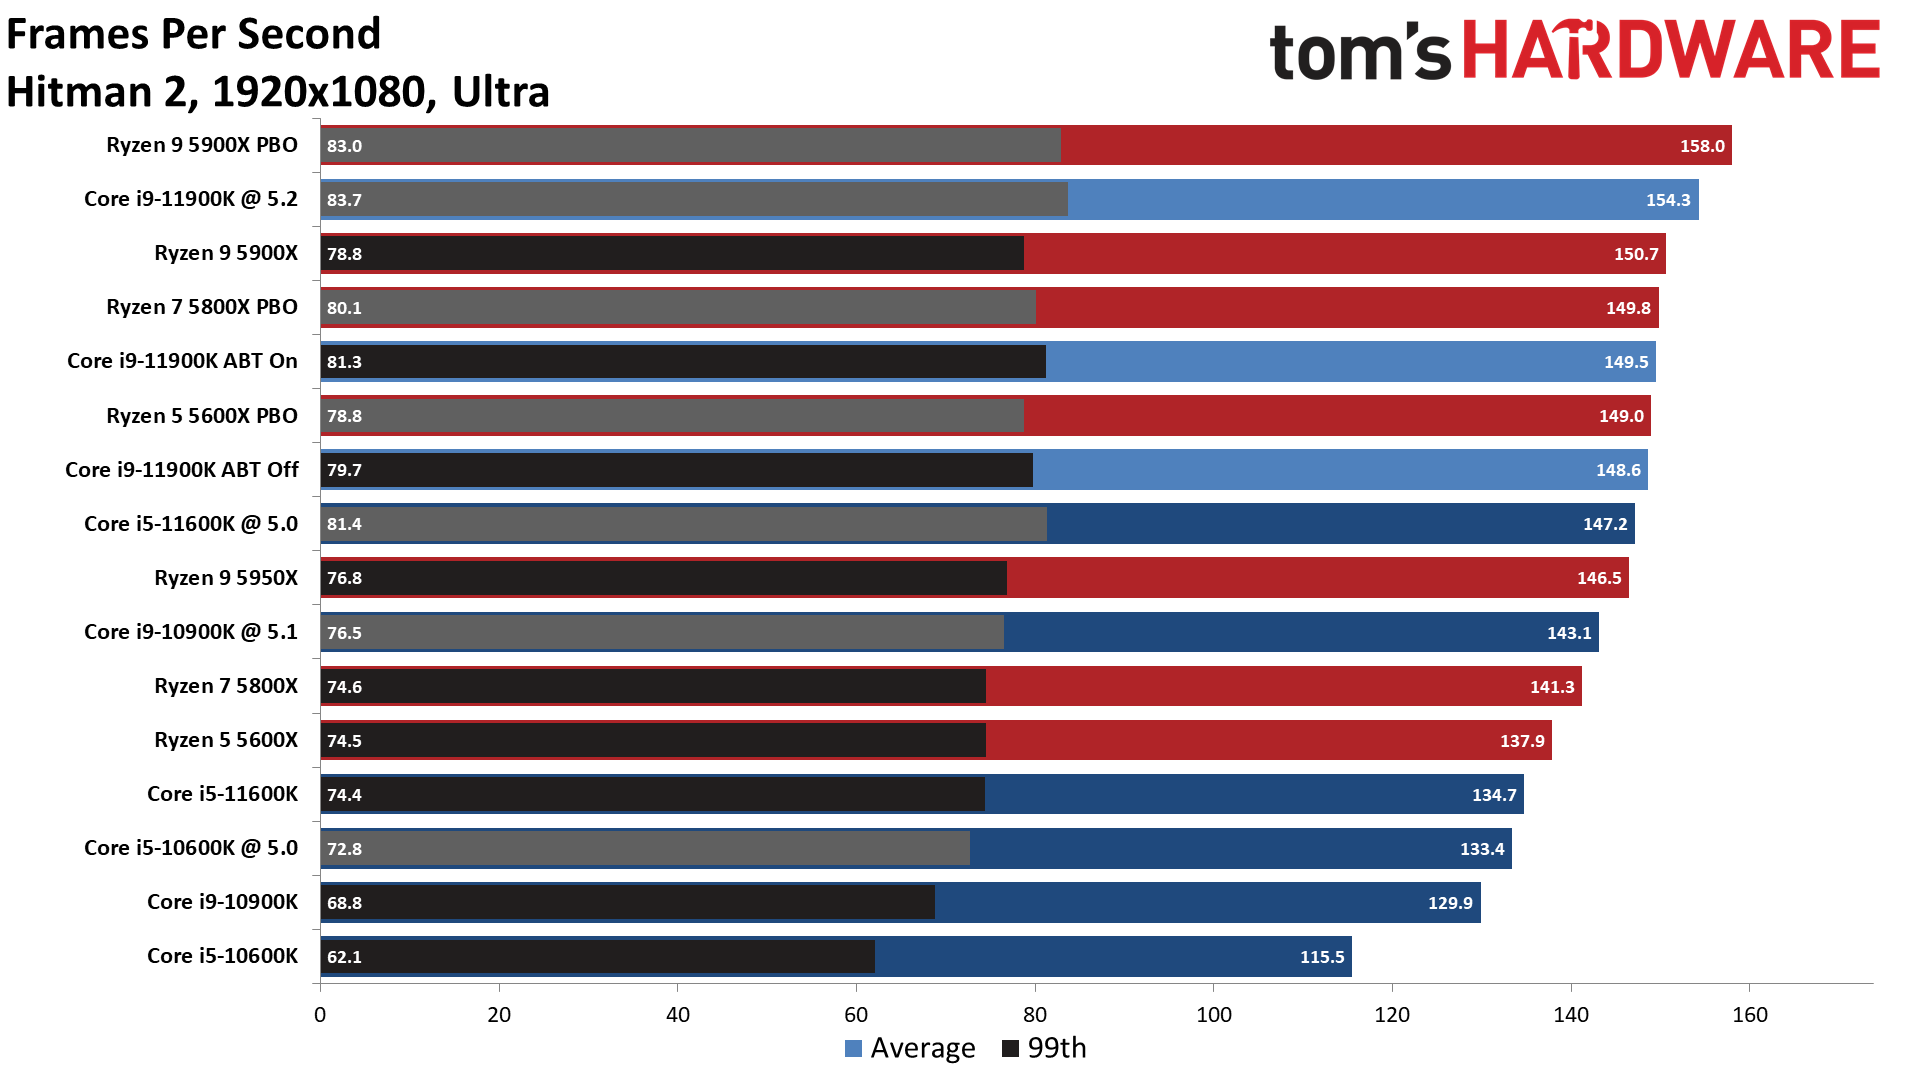
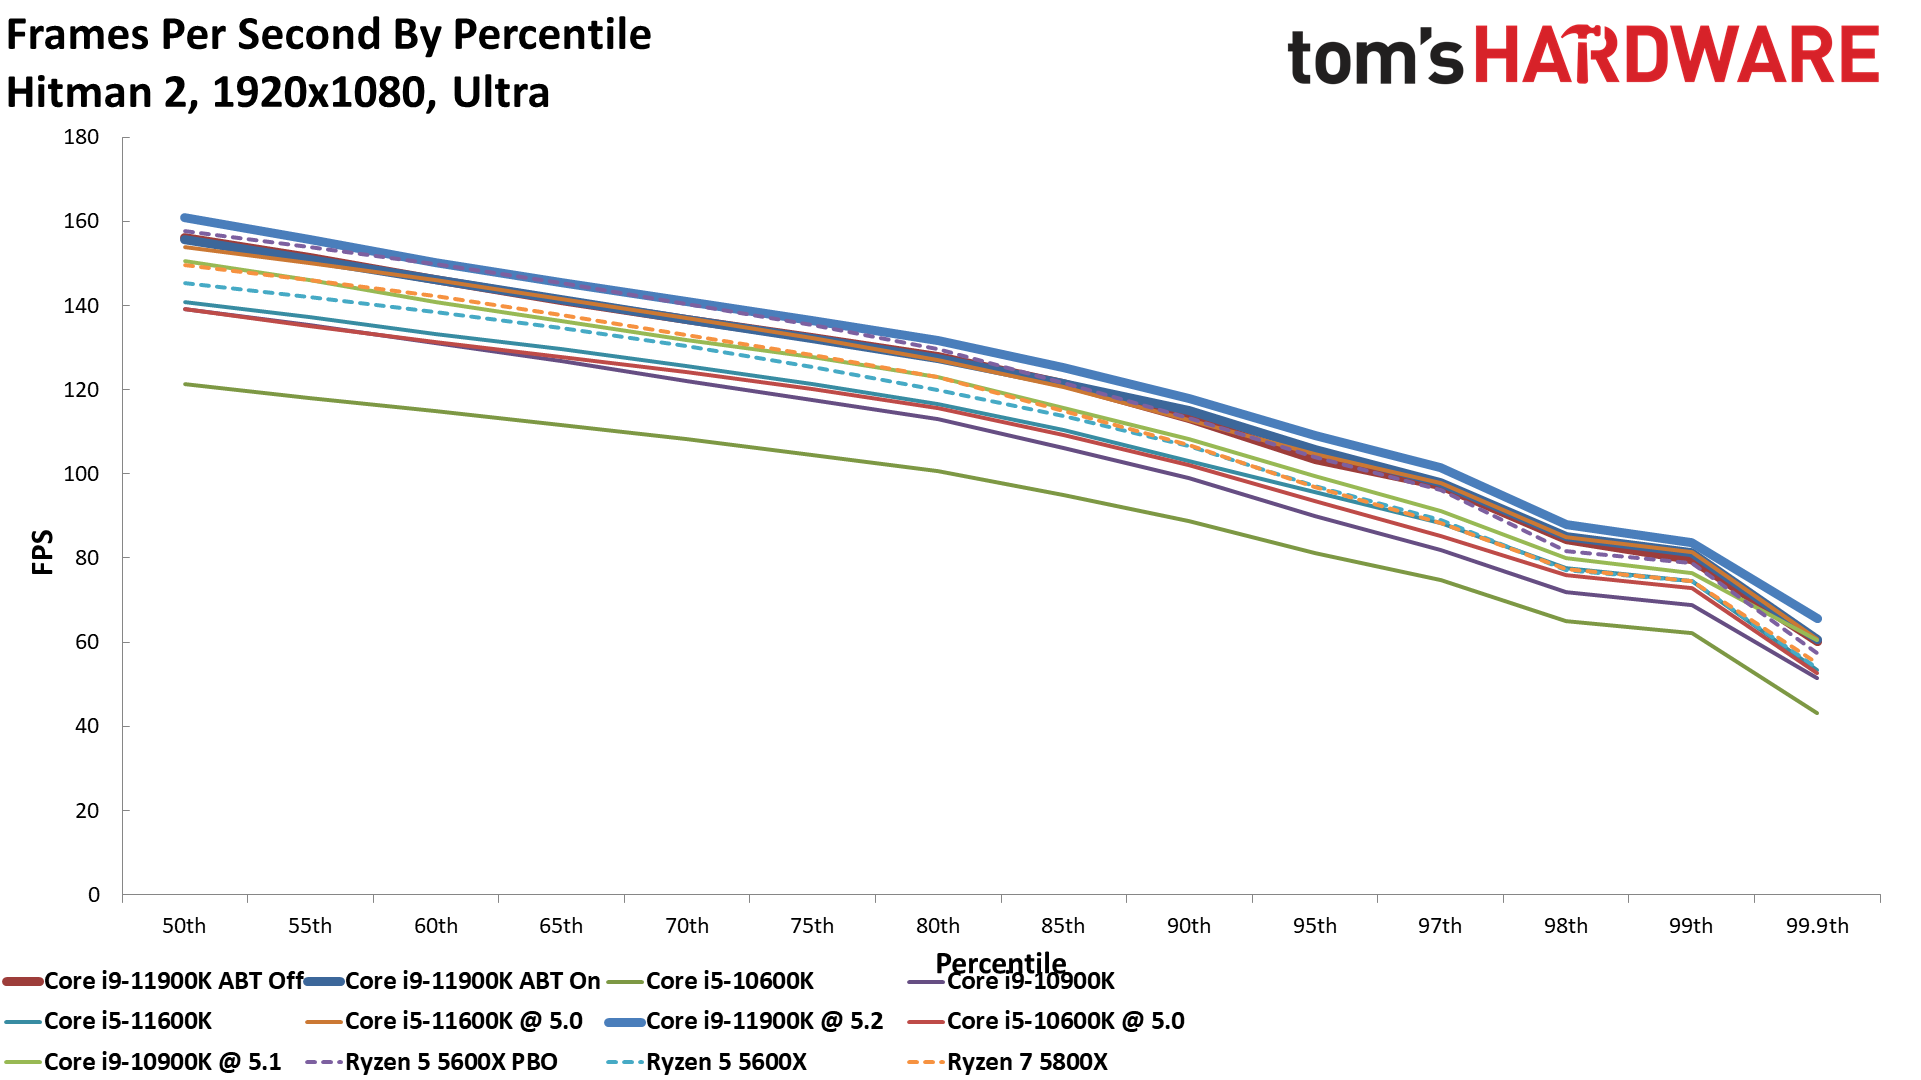
Hitman 2 doesn't scale well from 1080p to 1440p, at least not at the heightened fidelity settings we use for the benchmark. We stuck with the 1080p test for this title because the same trends carry over to 1440p.
The overclocked Ryzen 9 5900X still reigns supreme in this benchmark, but the Core i9-11900K closes the gap significantly. We see little additional uplift by toggling the ABT feature on in this title, but the 11900K impresses nonetheless with a 15% improvement over the 10900K while it takes a solid lead over the Ryzen field. Once again, the 11900K even beats its overclocked predecessor.
Meanwhile, we see impressive gains with the Core i5-11600K, too, with a 16.6% gen-on-gen improvement. Many of these same trends carry over to the 1440p results.
Project CARS 3 on Core i9-11900K and i5-11600K
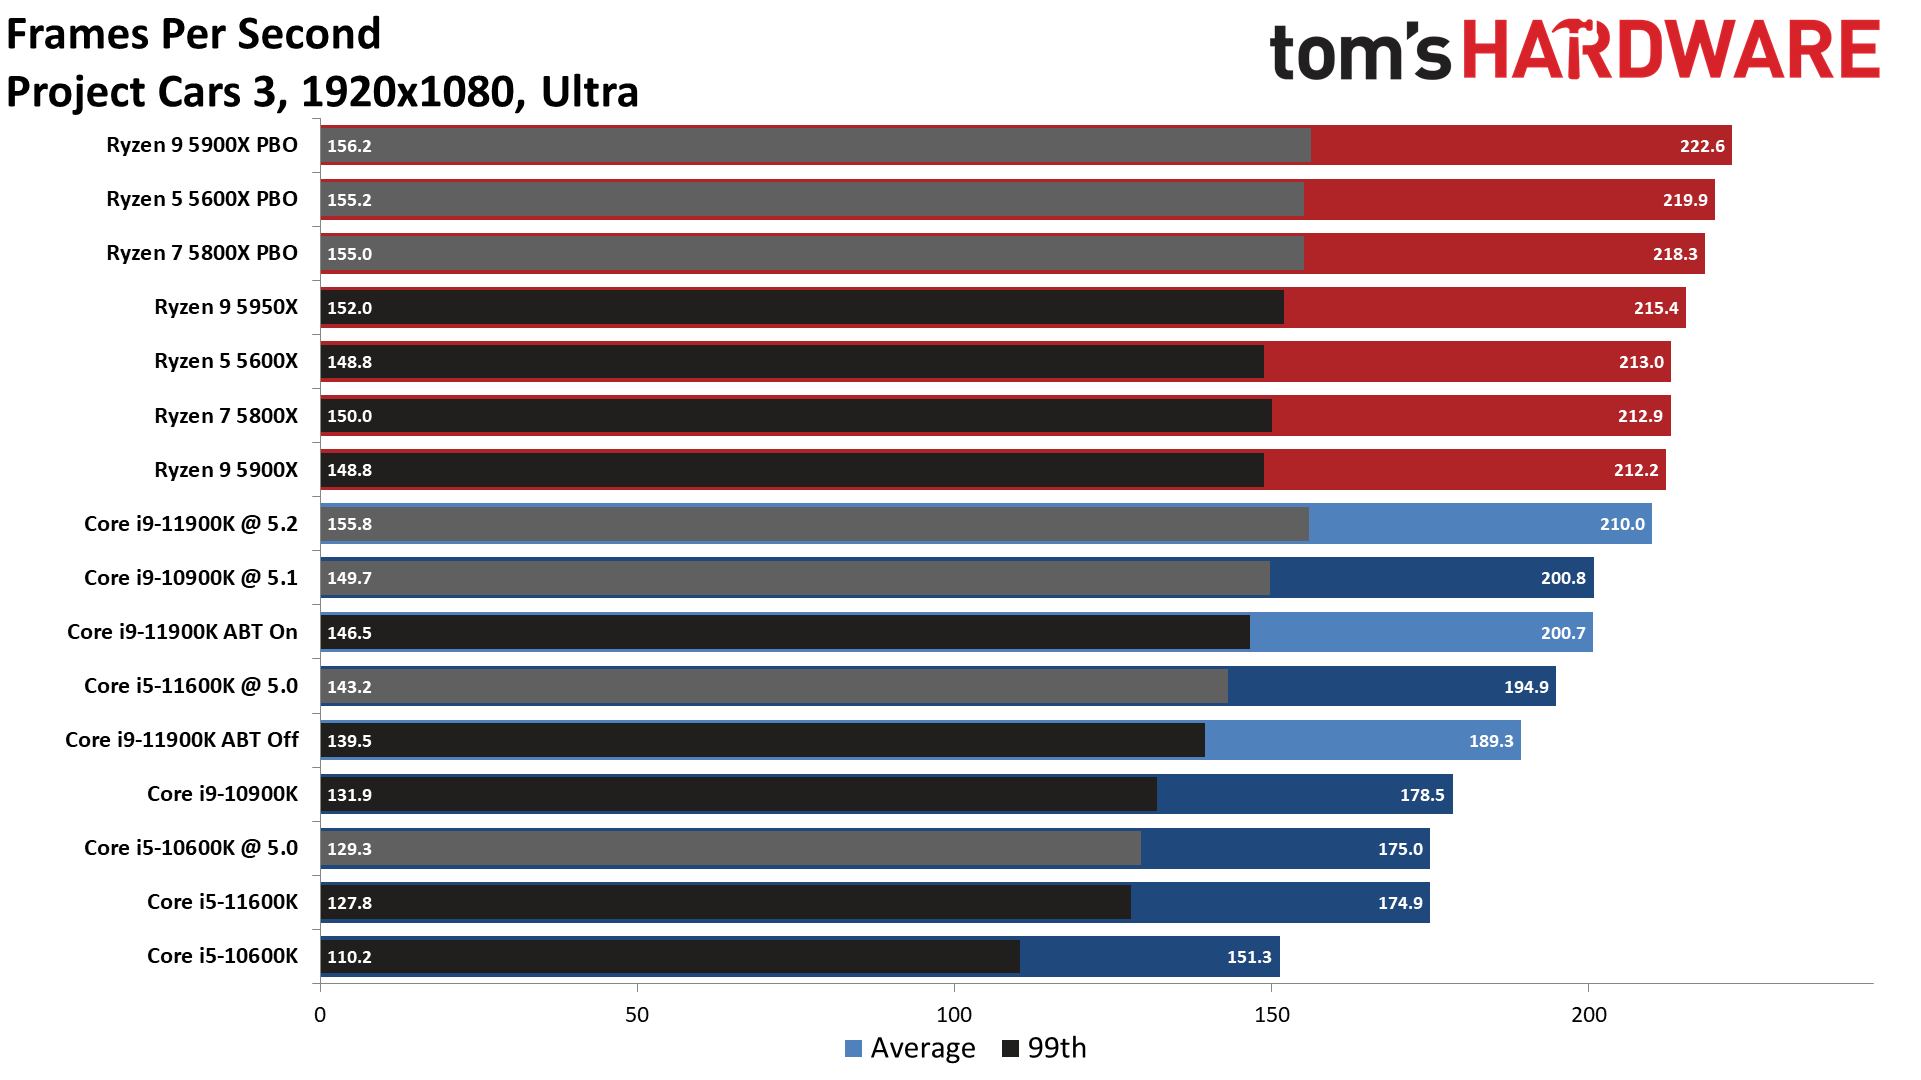
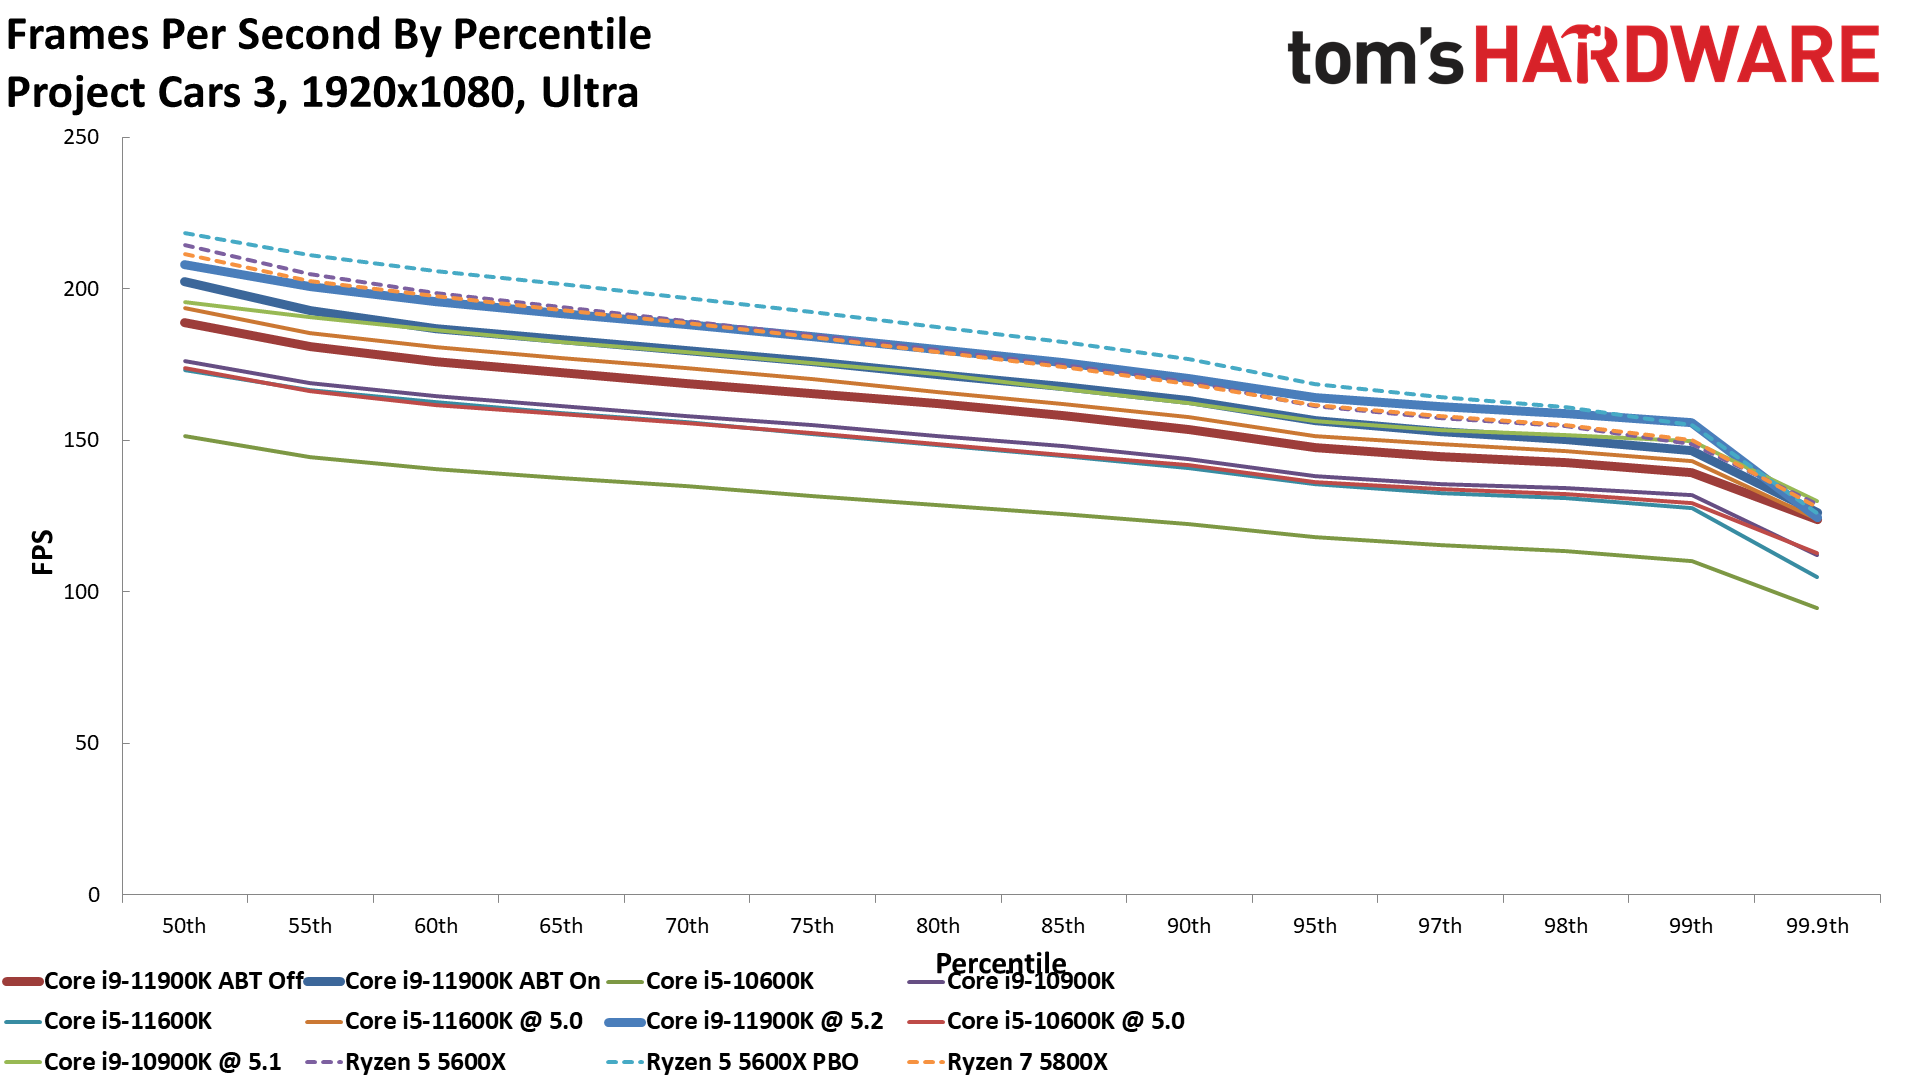
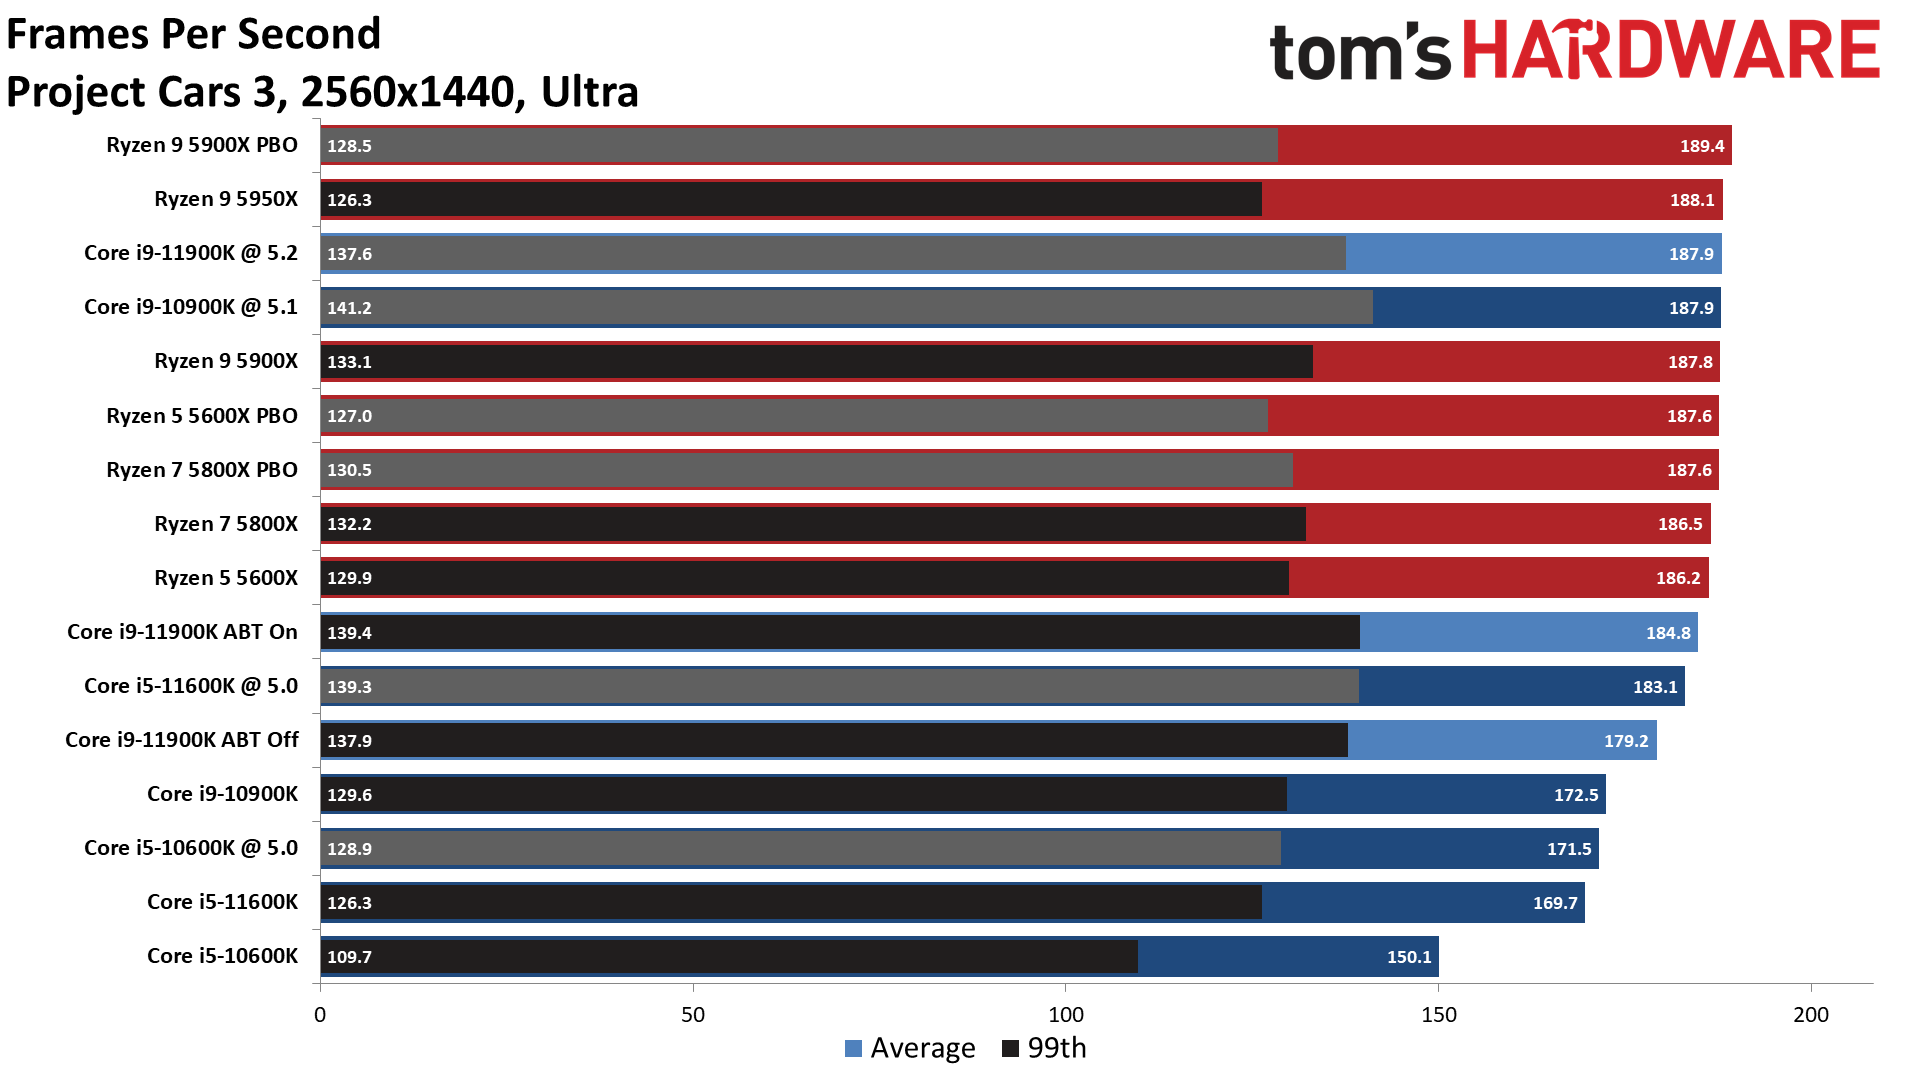
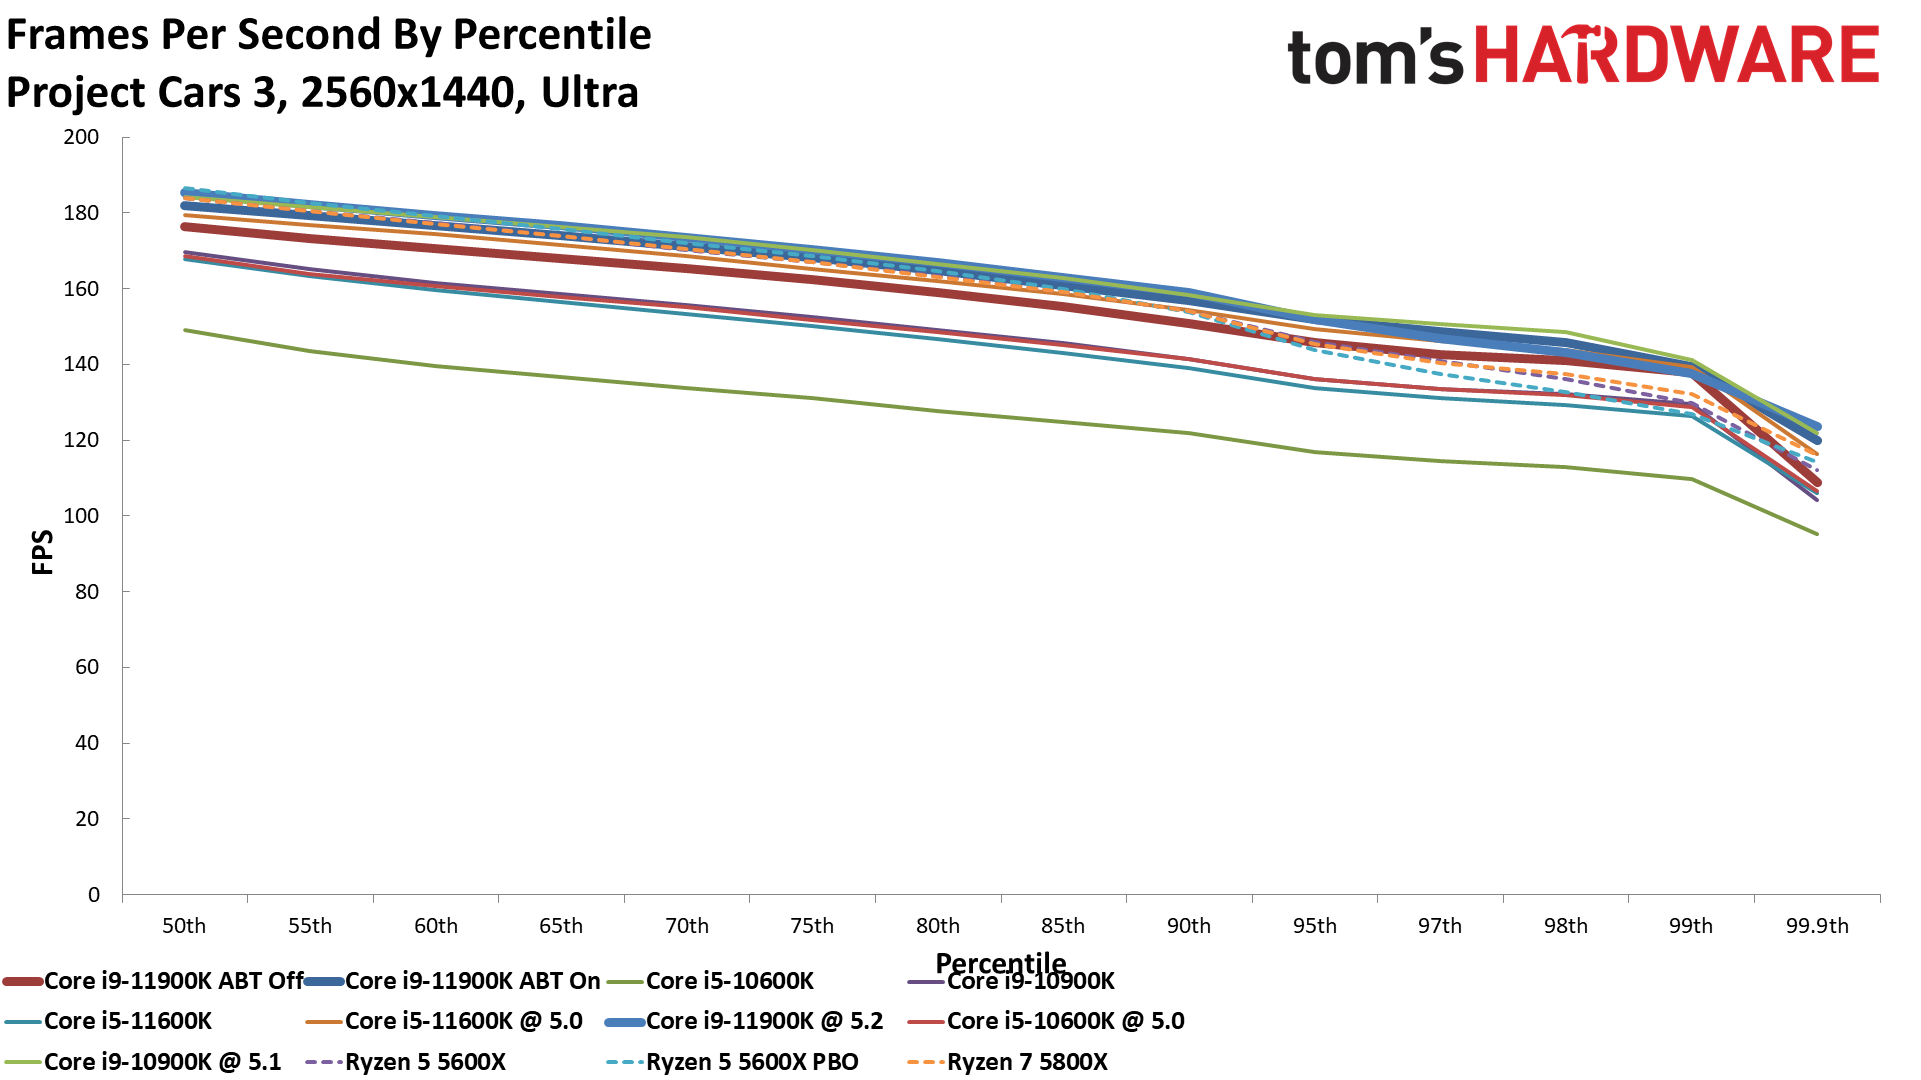
Project CARS 3 scales well with additional host compute, and the title obviously responds well to the Zen 3 architecture.
At stock settings, the Ryzen processors cling to the lead in the 1080p tests. Notably, the power-sipping stock Ryzen 5 5600X maintains the lead over the overclocked Intel processors. The Ryzen processors also scale well after tuning, propelling them to the top of the chart. Once again, the 11600K and 10900K both have significantly more performance than their prior-gen counterparts.
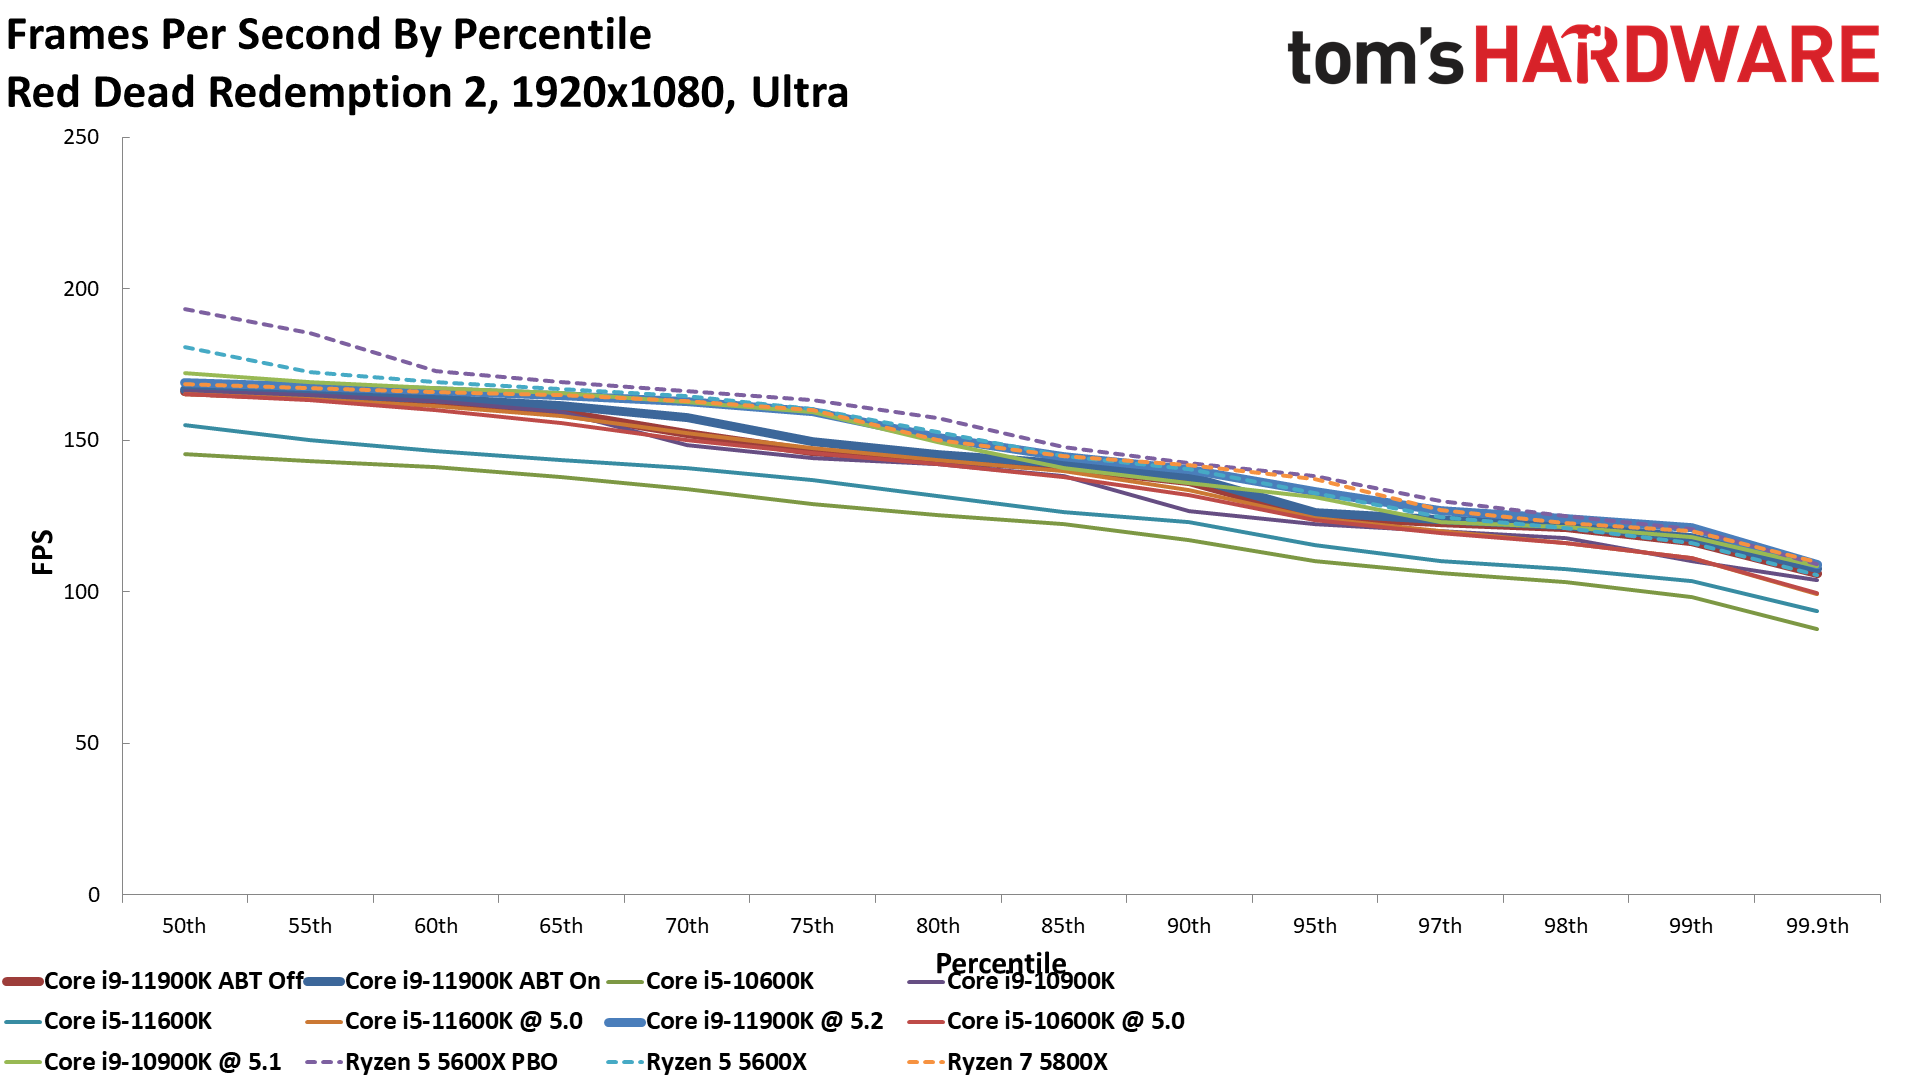
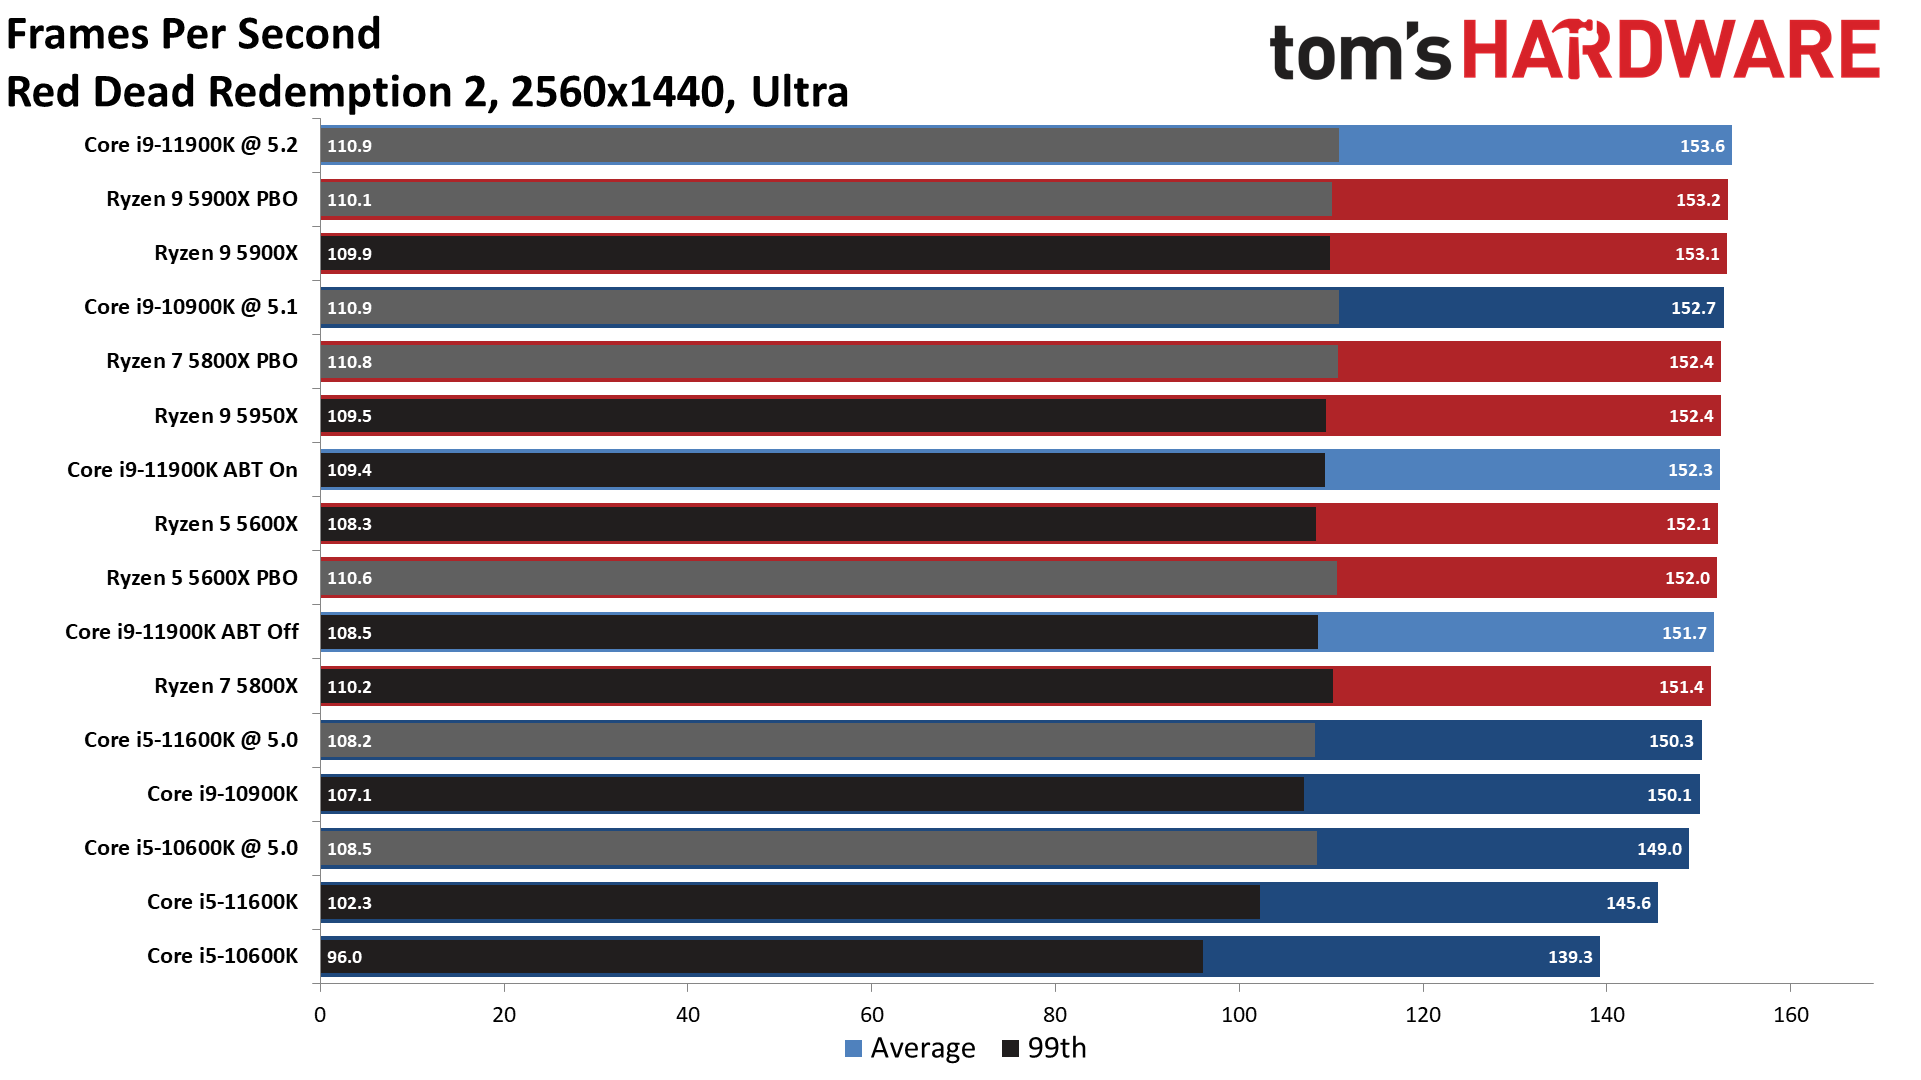
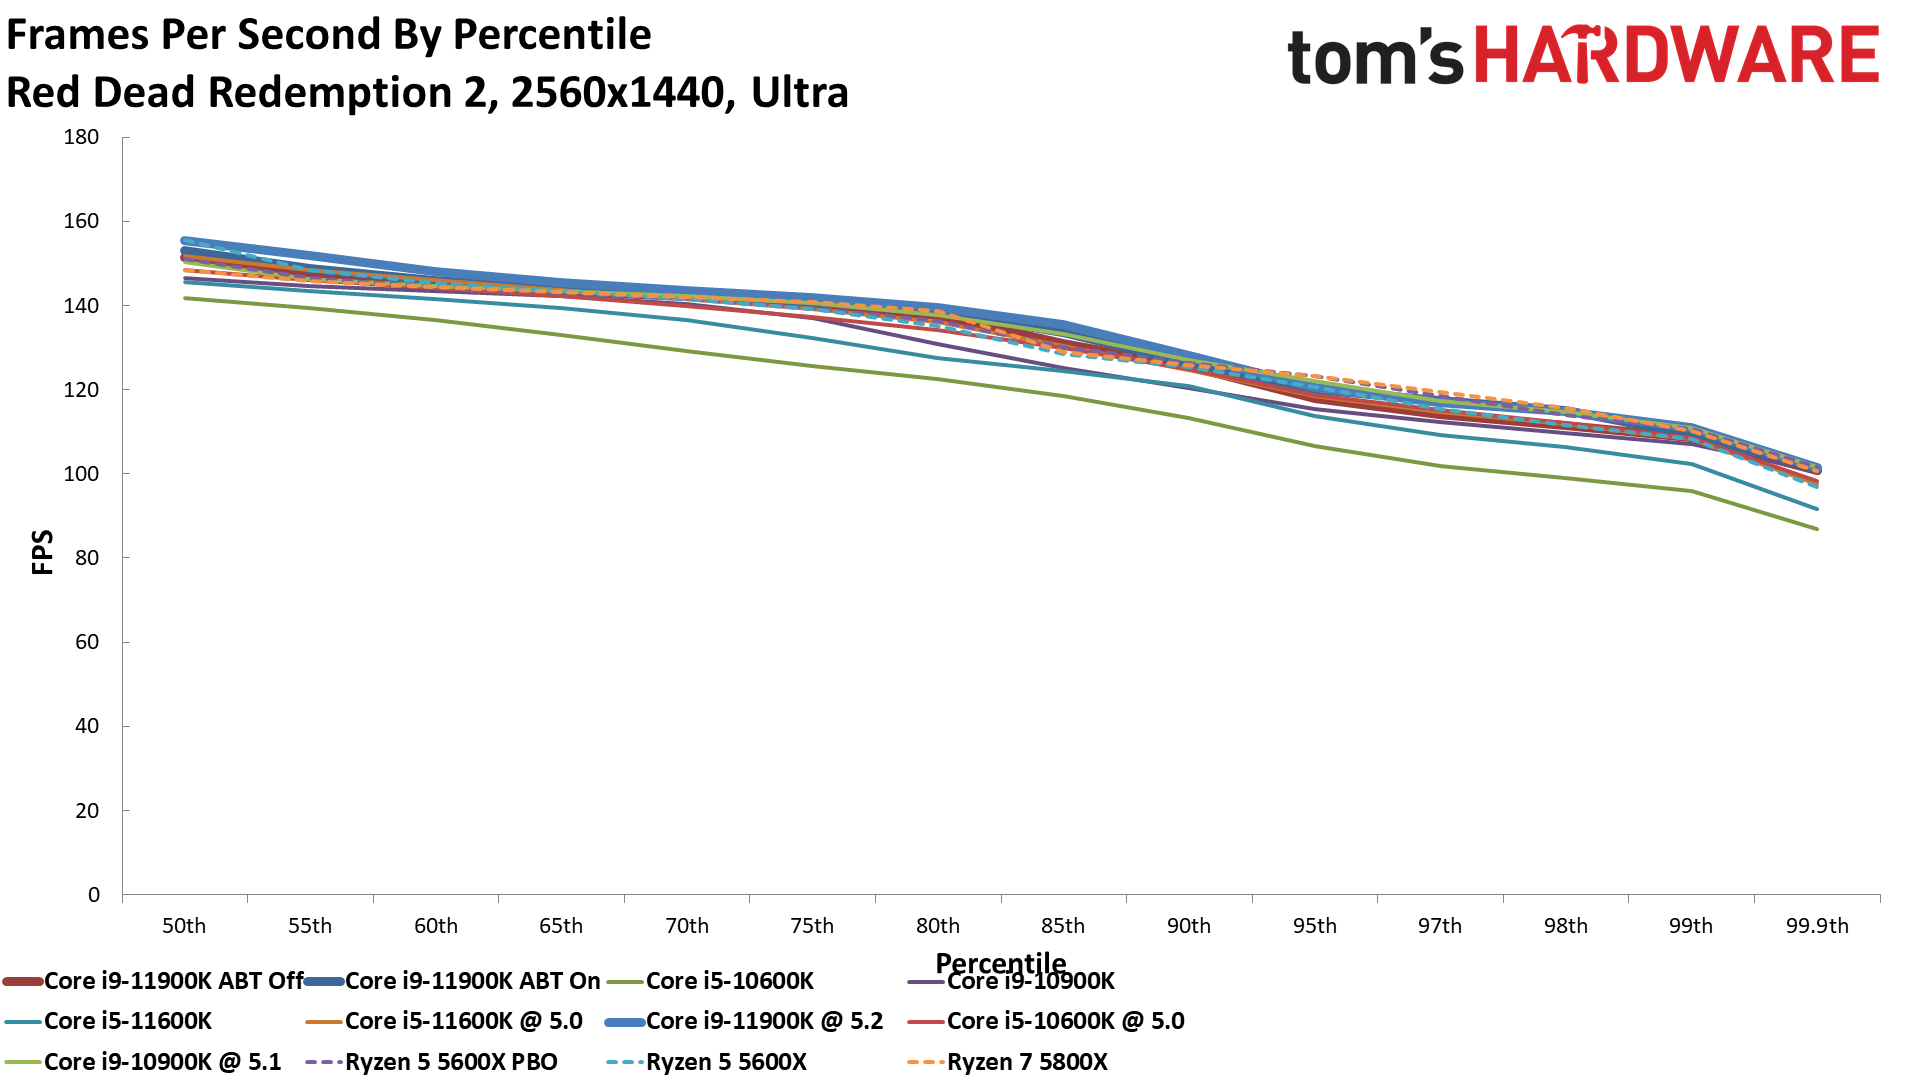
Red Dead Redemption 2 on Core i9-11900K and i5-11600K
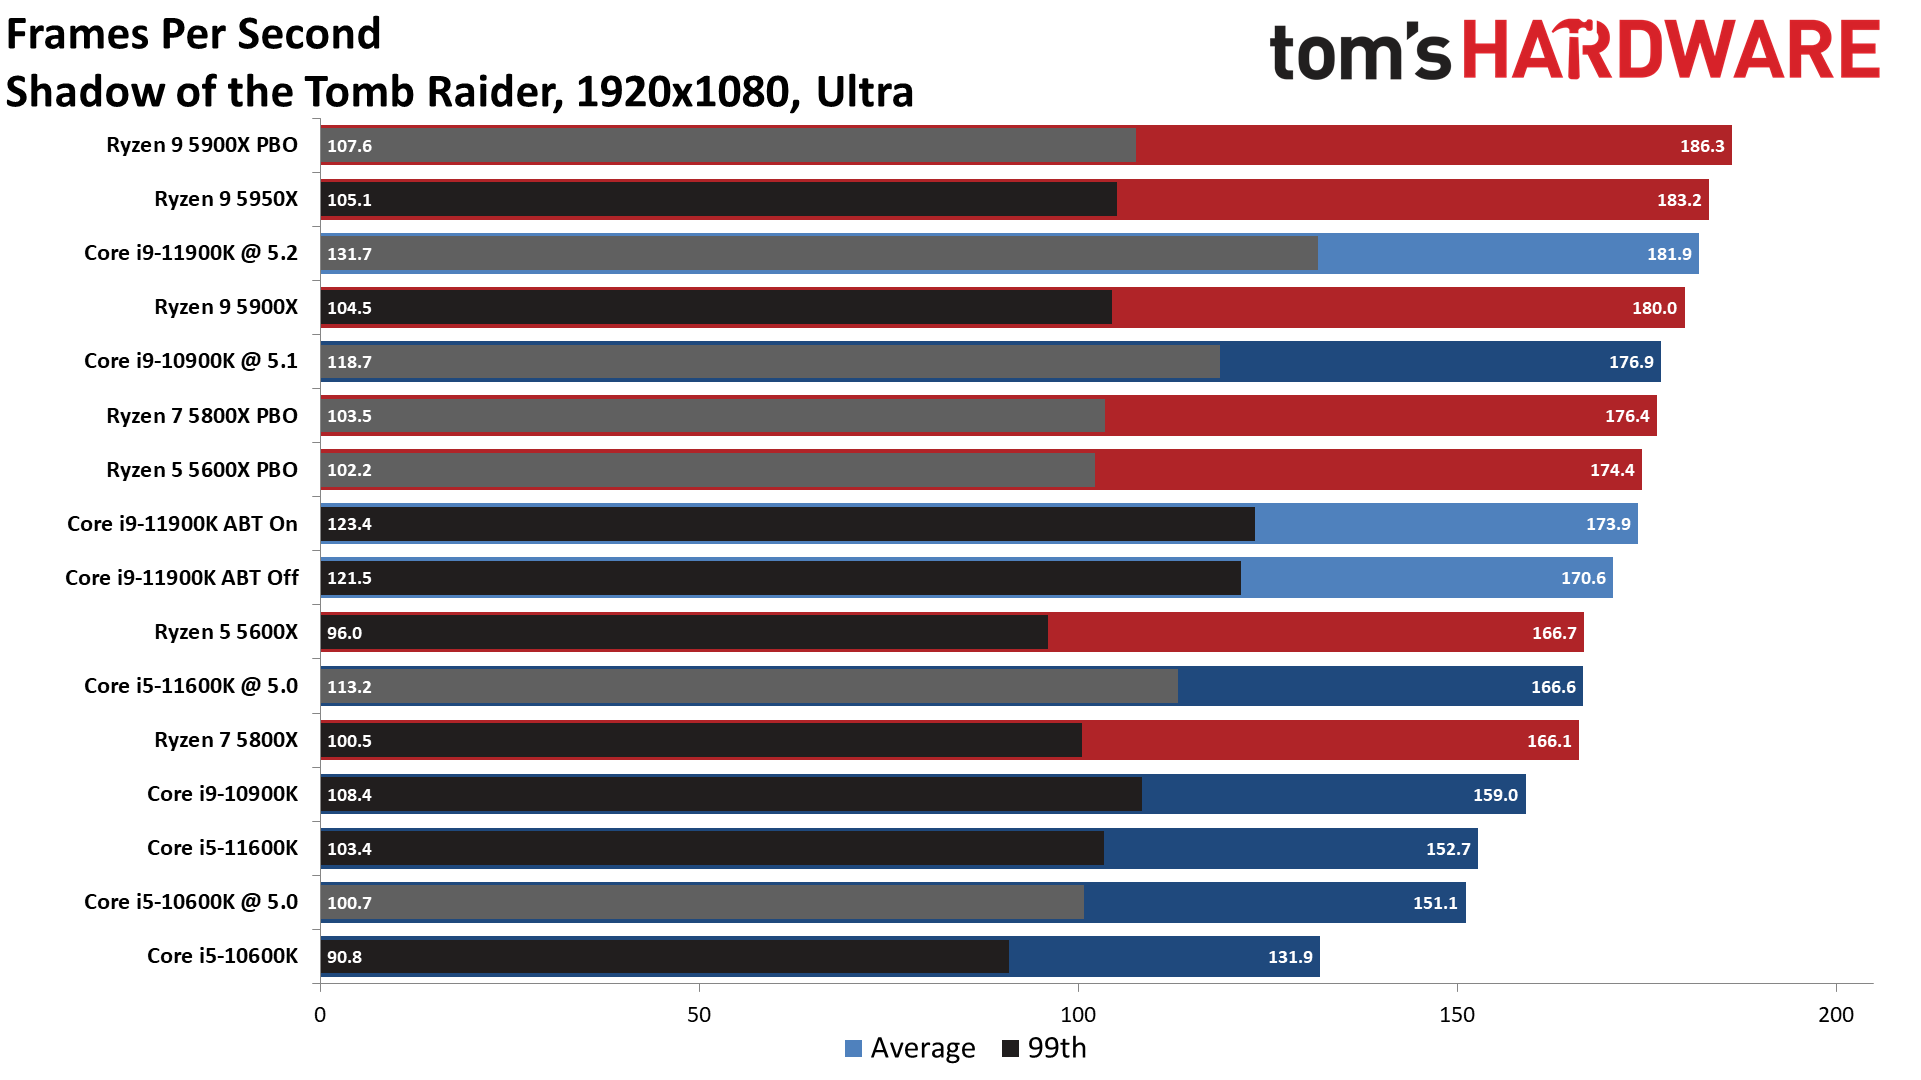
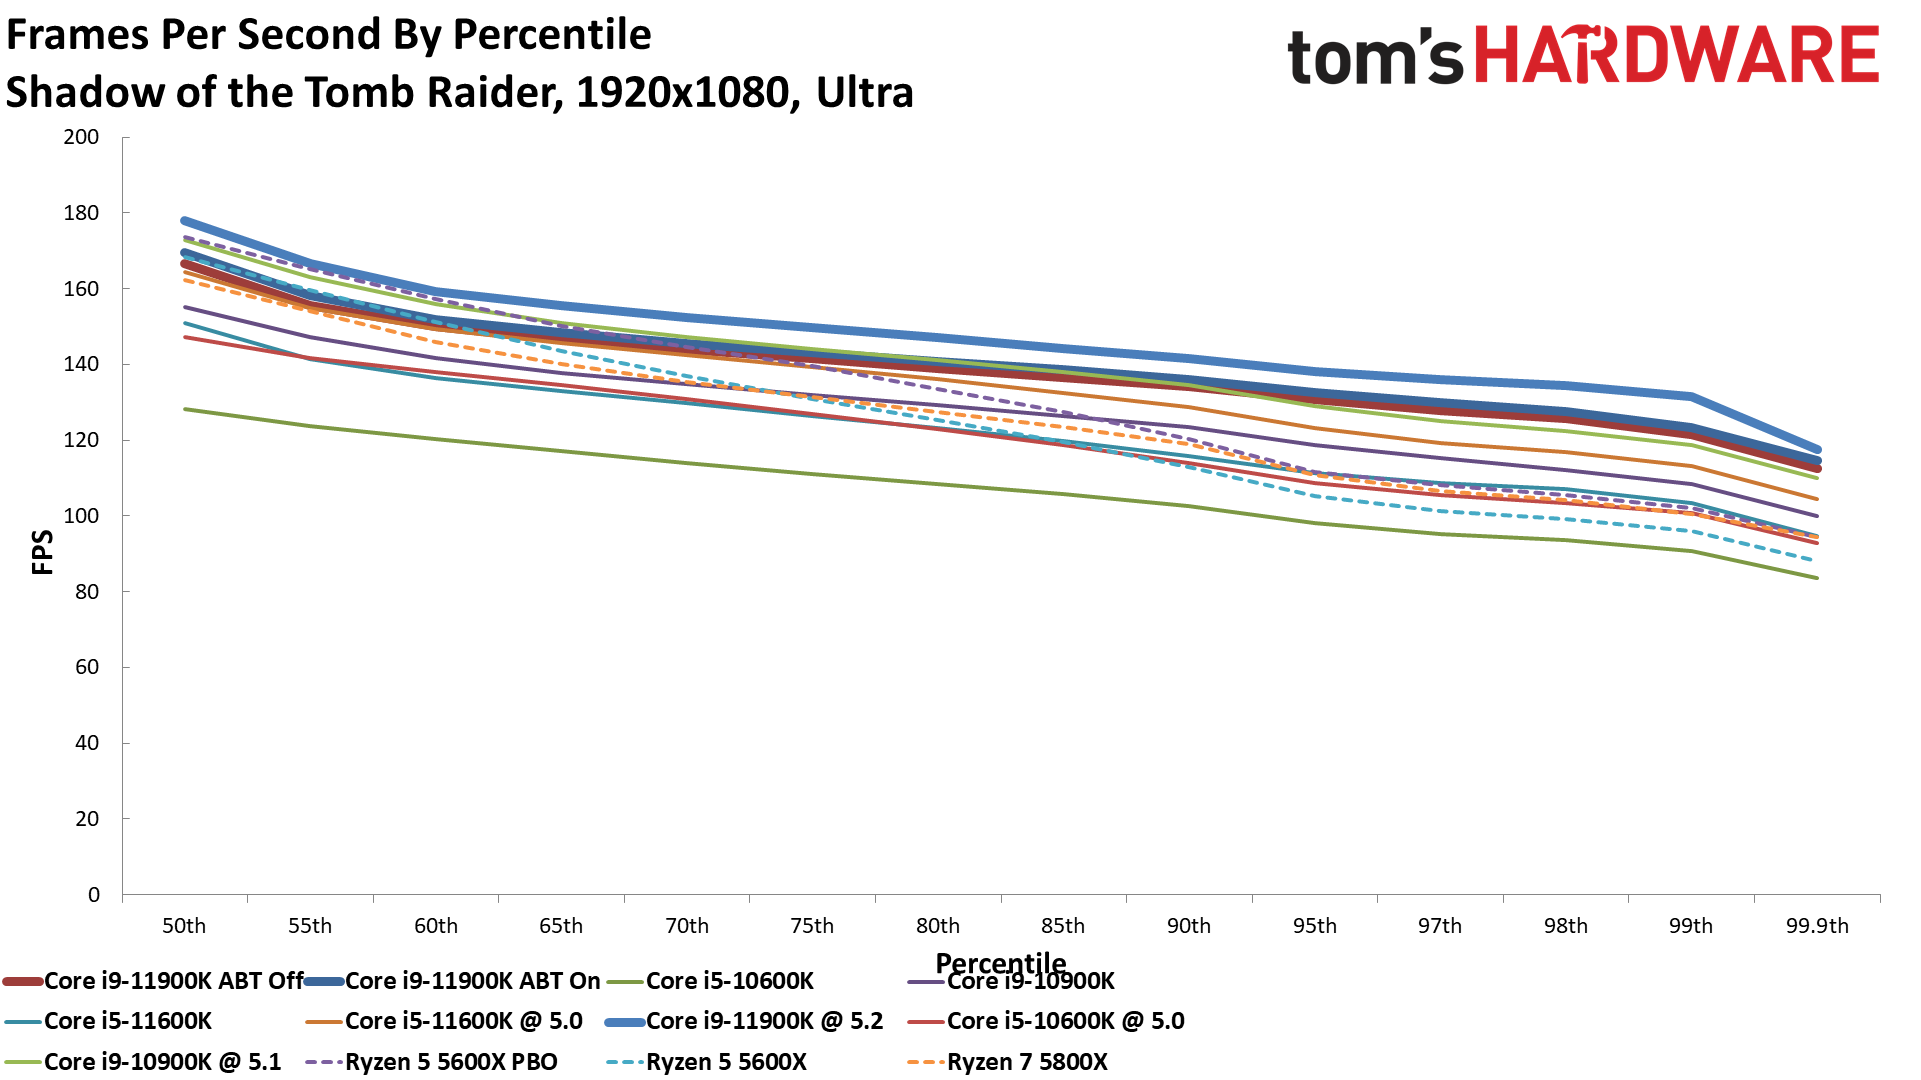
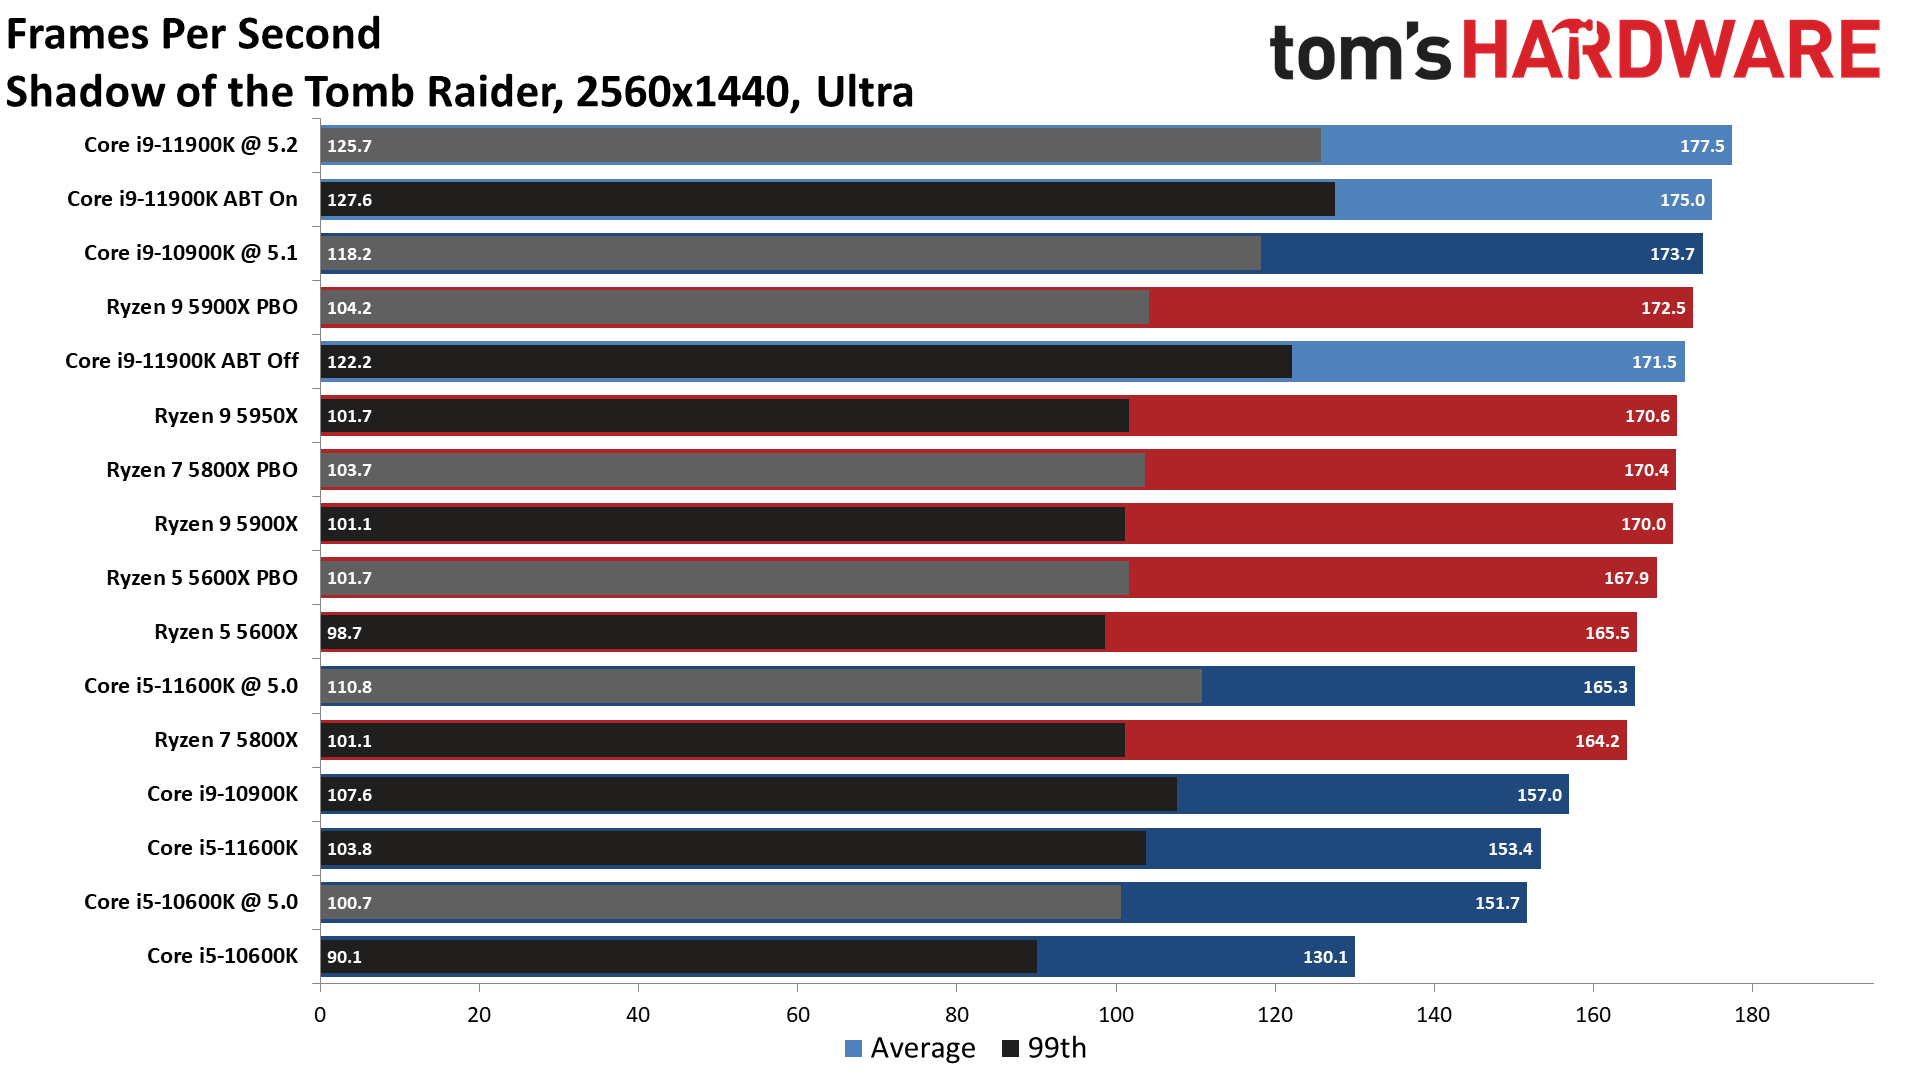
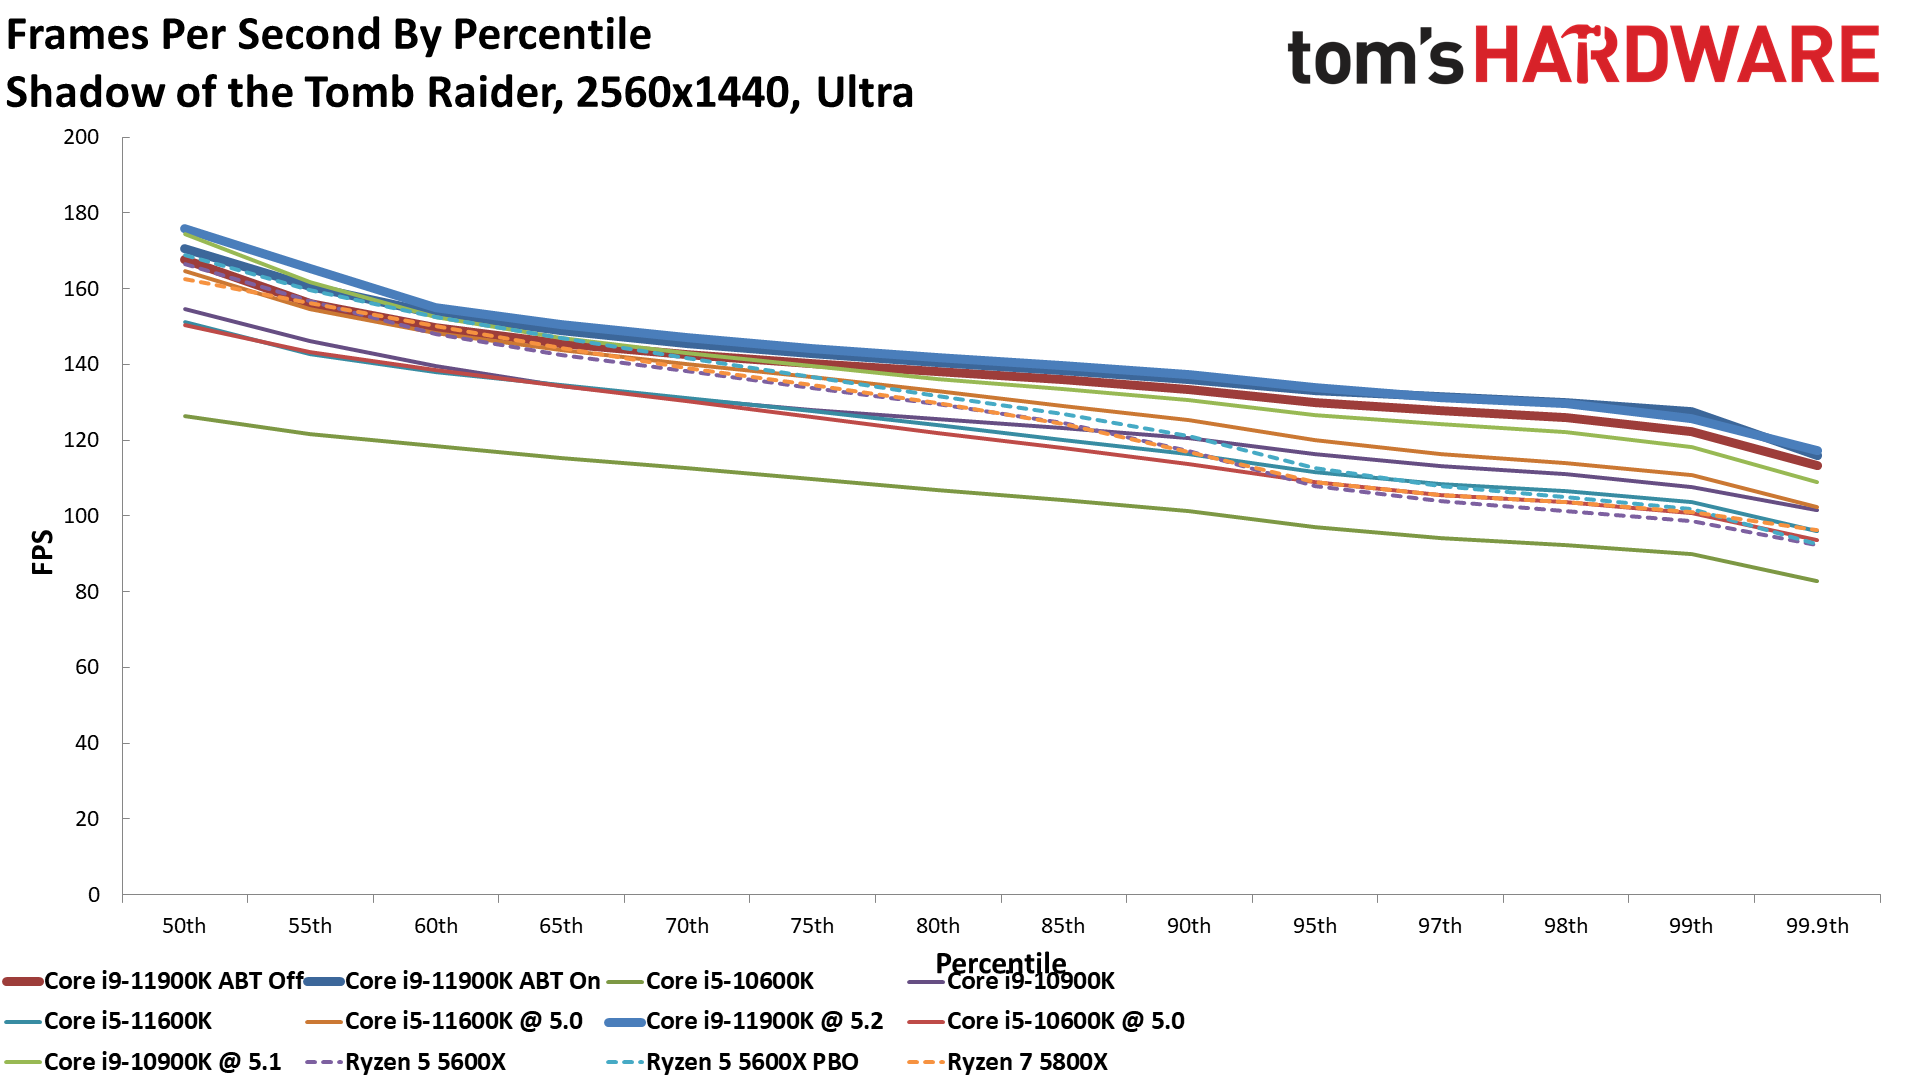
Shadow of the Tomb Raider on Core i9-11900K and i5-11600K
MORE: Best CPUs
MORE: CPU Benchmarks Hierarchy
MORE: All CPUs Content
Current page: Core i9-11900K and Core i5-11600K Gaming Benchmarks
Prev Page Core i9-11900K and i5-11600K Power, Thermals, and Overclocking Next Page Intel Core i9-11900K and Core i5-11600K Application Benchmarks
Paul Alcorn is the Editor-in-Chief for Tom's Hardware US. He also writes news and reviews on CPUs, storage, and enterprise hardware.
-
Zacca You have forgotten to post SolidWorks graphs. And Creo is wrongly posted in the Workstation stackReply -
Zacca ReplyAdmin said:We put the Core i9-11900K and Core i5-11600K to the test in our gaming and application benchmarks.
Intel Core i9-11900K and Core i5-11600K Review: Rocket Lake Blasts Off : Read more
Once again, please add the missing SolidWorks graphs to the SPECviewperf 2020 benchmark image stack. Also Creo is miss placed.
