System Builder Marathon Q4 2015: System Value Compared
Three builders with practically unlimited budgets compete for best performance-per-dollar across our multi-faceted benchmark suite. Which build will win?
How We Test & Results
We’re still finishing development of our Windows 10 test suite, so this quarter we're still using our legacy Windows 8 benchmark set.
| Benchmark Settings | |
|---|---|
| 3D Games | |
| Battlefield 4 | Version 1.0.0.1, DirectX 11, 100-sec. Fraps "Tashgar" Test Set 1: Medium Quality Preset, No AA, 4X AF, SSAO Test Set 2: Ultra Quality Preset, 4X MSAA, 16X AF, HBAO |
| Grid 2 | Version 1.0.85.8679, Direct X 11, Built-in Benchmark Test Set 1: High Quality, No AA Test Set 2: Ultra Quality, 8x MSAA |
| Arma 3 | Version 1.08.113494, 30-Sec. Fraps "Infantry Showcase" Test Set 1: Standard Preset, No AA, Standard AF Test Set 2: Ultra Preset, 8x FSAA, Ultra AF |
| Far Cry 3 | V. 1.04, DirectX 11, 50-sec. Fraps "Amanaki Outpost" Test Set 1: High Quality, No AA, Standard ATC, SSAO Test Set 2: Ultra Quality, 4x MSAA, Enhanced ATC, HDAO |
| Adobe Creative Suite | |
| Adobe After Effects CC | Version 12.0.0.404: Create Video which includes 3 Streams, 210 Frames, Render Multiple Frames Simultaneosly |
| Adobe Photoshop CC | Version 14.0 x64: Filter 15.7MB TIF Image: Radial Blur, Shape Blur, Median, Polar Coordinates |
| Adobe Premeire Pro CC | Version 7.0.0 (342), 6.61 GB MXF Project to H.264 to H.264 Blu-ray, Output 1920x1080, Maximum Quality |
| Audio/Video Encoding | |
| iTunes | Version 11.0.4.4 x64: Audio CD (Terminator II SE), 53 minutes, default AAC format |
| Lame MP3 | Version 3.98.3: Audio CD "Terminator II SE", 53 min, convert WAV to MP3 audio format, Command: -b 160 --nores (160 kb/s) |
| Handbrake CLI | Version: 0.99: Video from Canon Eos 7D (1920x1080, 25 FPS) 1 Minutes 22 Seconds Audio: PCM-S16, 48000 Hz, 2-Channel, to Video: AVC1 Audio: AAC (High Profile) |
| TotalCodeStudio 2.5 | Version: 2.5.0.10677: MPEG-2 to H.264, MainConcept H.264/AVC Codec, 28 sec HDTV 1920x1080 (MPEG-2), Audio: MPEG-2 (44.1 kHz, 2 Channel, 16-Bit, 224 kb/s), Codec: H.264 Pro, Mode: PAL 50i (25 FPS), Profile: H.264 BD HDMV |
| Productivity | |
| ABBYY FineReader | Version 10.0.102.95: Read PDF save to Doc, Source: Political Economy (J. Broadhurst 1842) 111 Pages |
| Adobe Acrobat 11 | Version 11.0.0.379: Print PDF from 115 Page PowerPoint, 128-bit RC4 Encryption |
| Autodesk 3ds Max 2013 | Version 15.0 x64: Space Flyby Mentalray, 248 Frames, 1440x1080 |
| Blender | Version: 2.68A, Cycles Engine, Syntax blender -b thg.blend -f 1, 1920x1080, 8x Anti-Aliasing, Render THG.blend frame 1 |
| File Compression | |
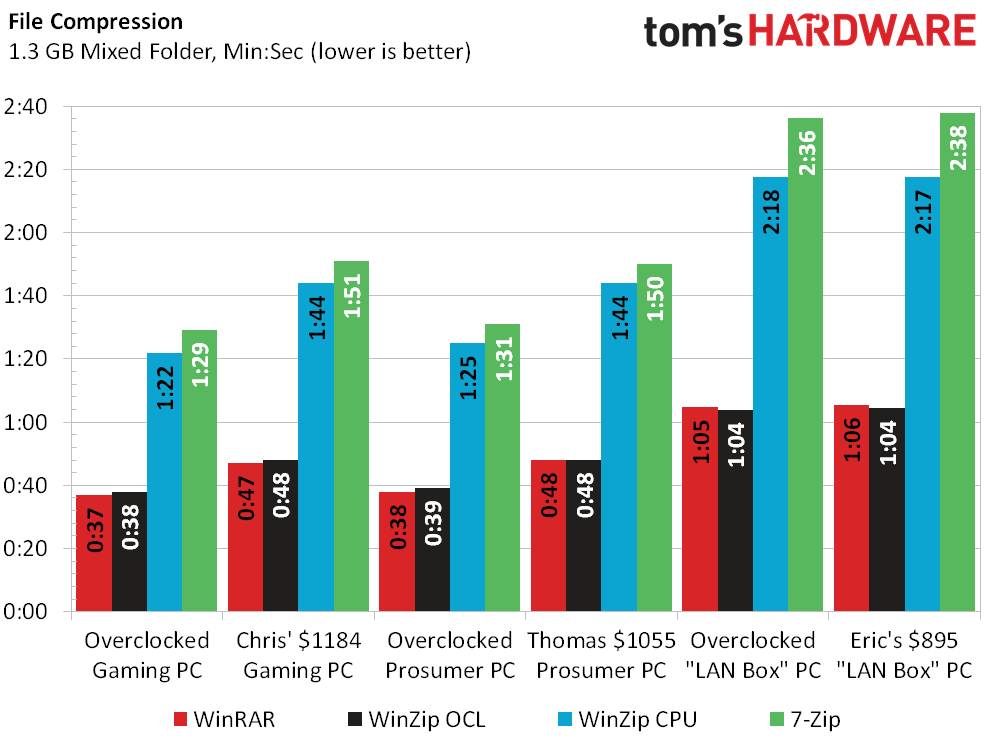
| WinZip | Version 18.0 Pro: THG-Workload (1.3 GB) to ZIP, command line switches "-a -ez -p -r" |
| WinRAR | Version 5.0: THG-Workload (1.3 GB) to RAR, command line switches "winrar a -r -m3" |
| 7-Zip | Version 9.30 alpha (64-bit): THG-Workload (1.3 GB) to .7z, command line switches "a -t7z -r -m0=LZMA2 -mx=5" |
| Synthetic Benchmarks and Settings | |
| 3DMark Professional | Version: 1.2.250.0 (64-bit), Fire Strike Benchmark |
| PCMark 8 | Version: 1.0.0 x64, Full Test |
| SiSoftware Sandra | Version 2014.02.20.10, CPU Test = CPU Arithmetic / Multimedia / Cryptography, Memory Bandwidth Benchmarks |
Synthetics
Chris gets top position in the charts this time, because we expect the most expensive computer to have the highest performance. The pressure to start out on top pays off in 3DMark and PCMark, but can his machine stay on top?
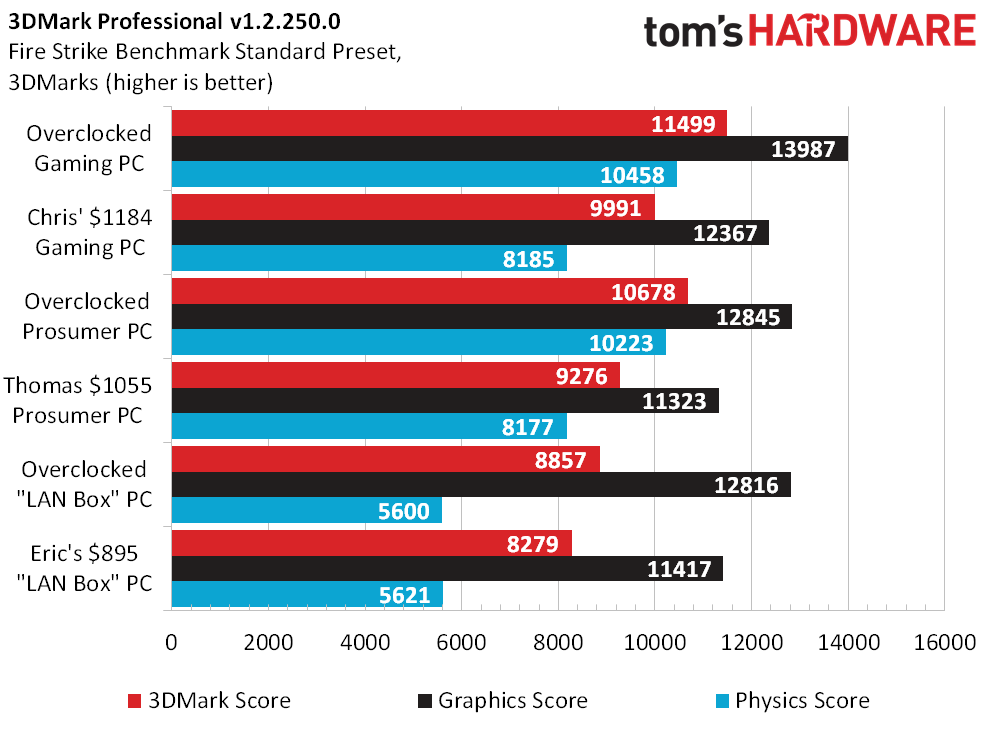
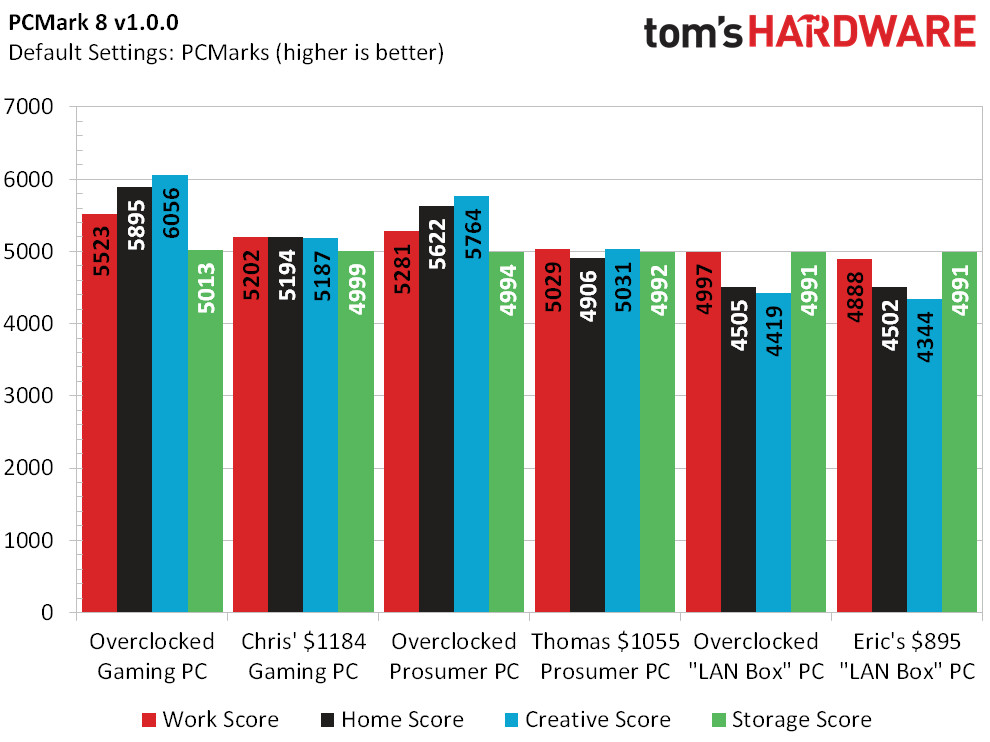
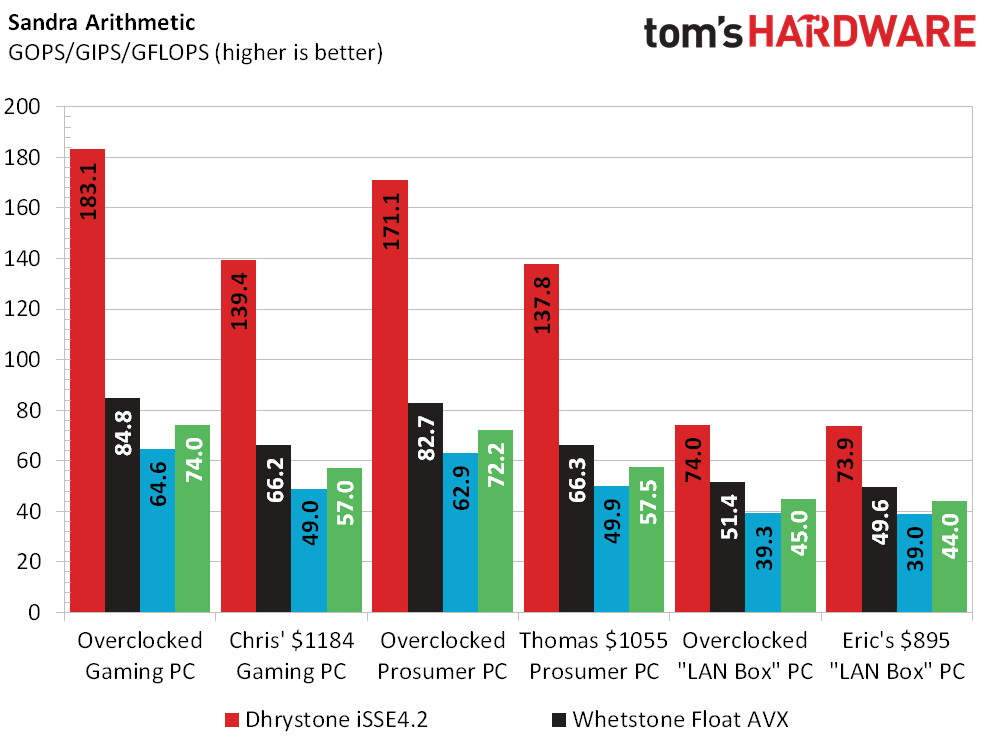
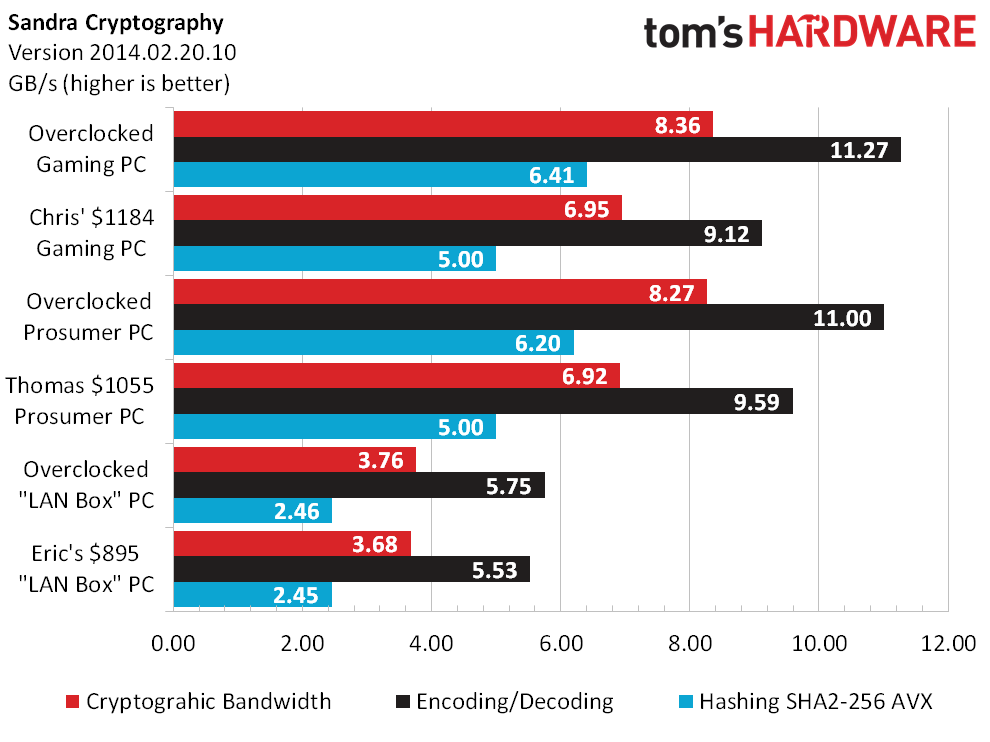
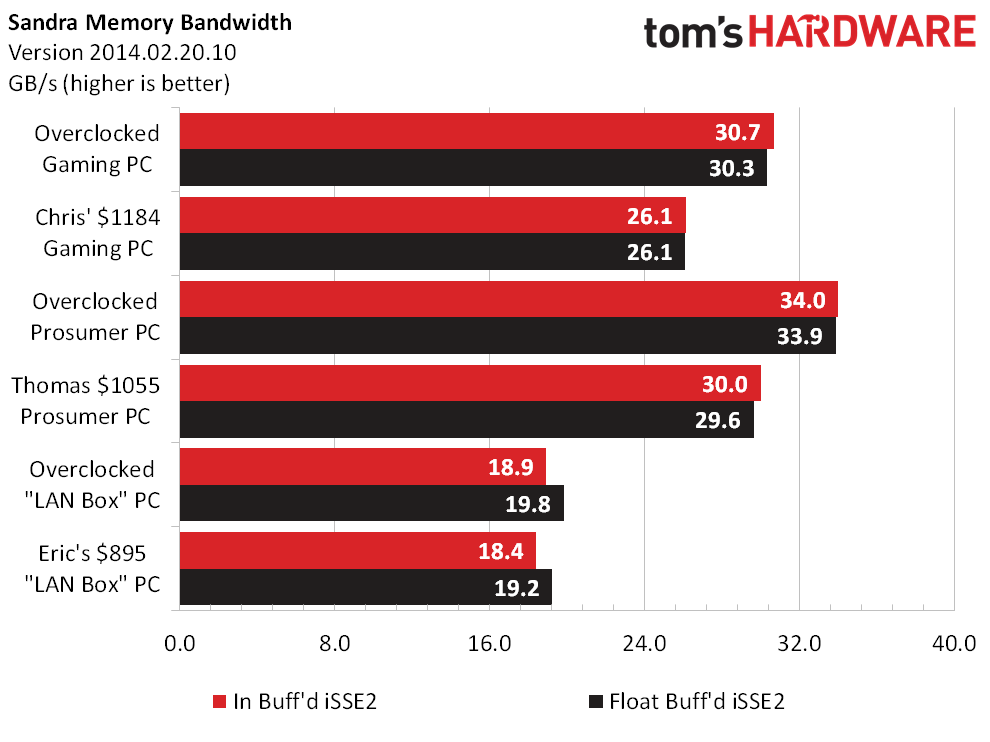
My $1055 dual-purpose Prosumer PC catches Chris’ machine in Sandra’s CPU tests, but only at stock speed. Chris overclocks his CPU 100MHz higher, while I was able to squeeze out a little more memory bandwidth.
Gaming
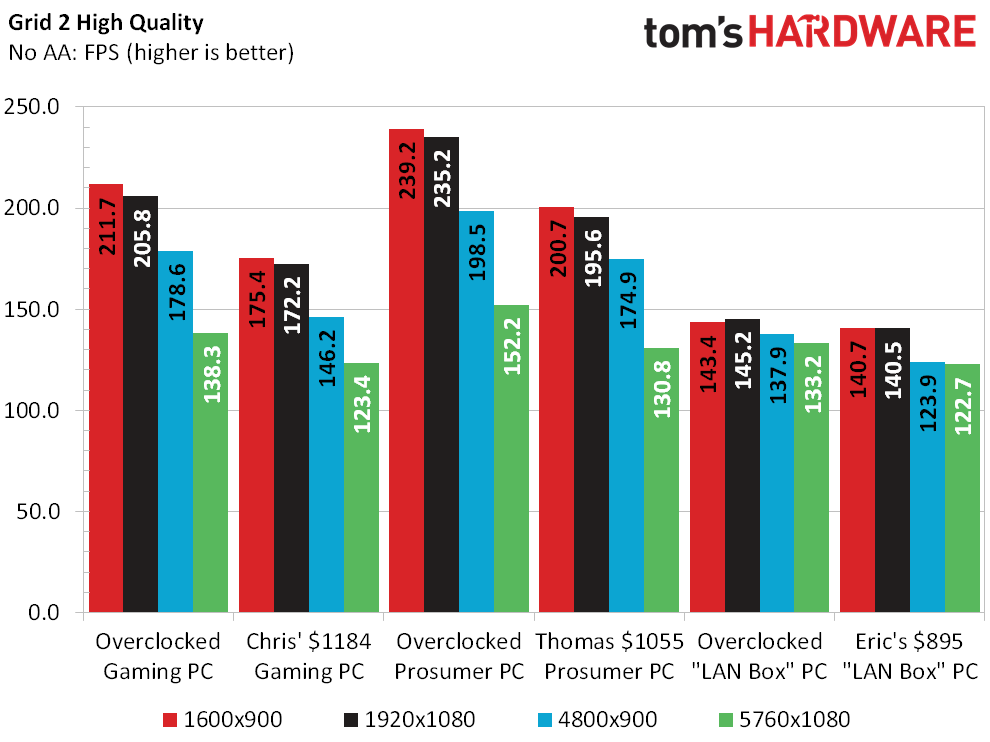
Eric and I use the same graphics card, but my CPU appears to have a slight gaming advantage when using single-monitor resolutions. Some games also respond to better memory performance, and I have a lead there as well. Is Eric’s $895 machine trending towards a top-resolution-only value win?
Using the same CPU as my $1050 machine, Chris’ Radeon R9 390 performs similarly to my GTX 970. The R9 390 does fall significantly behind at Arma 3’s Standard quality, but stages a comeback in triple-monitor Battlefield 4 tests.
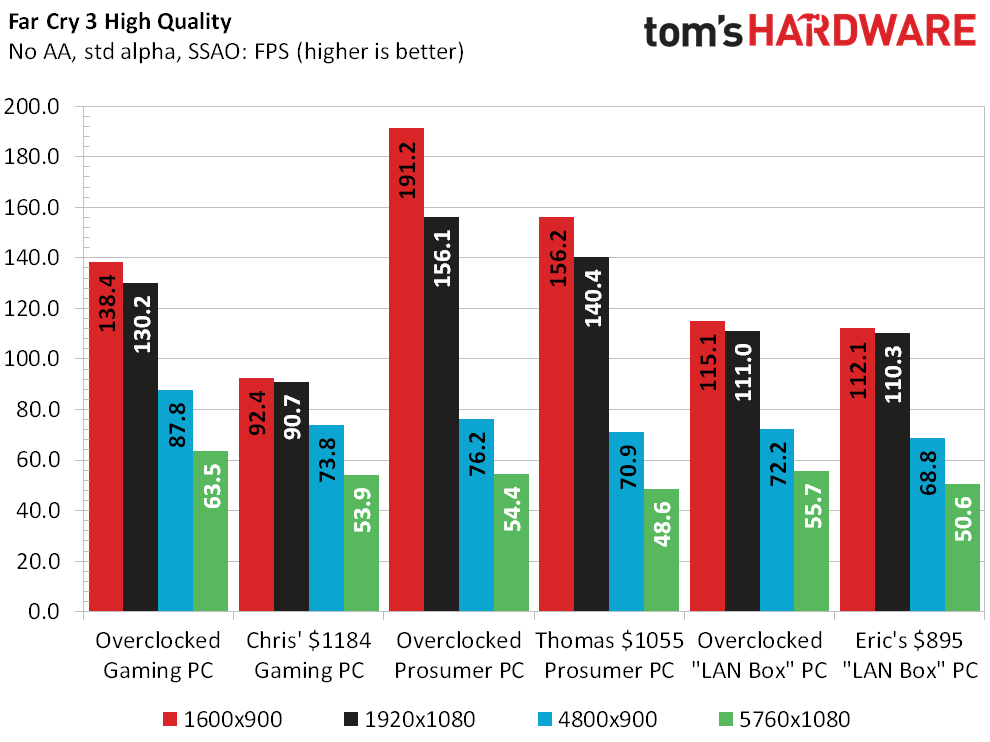
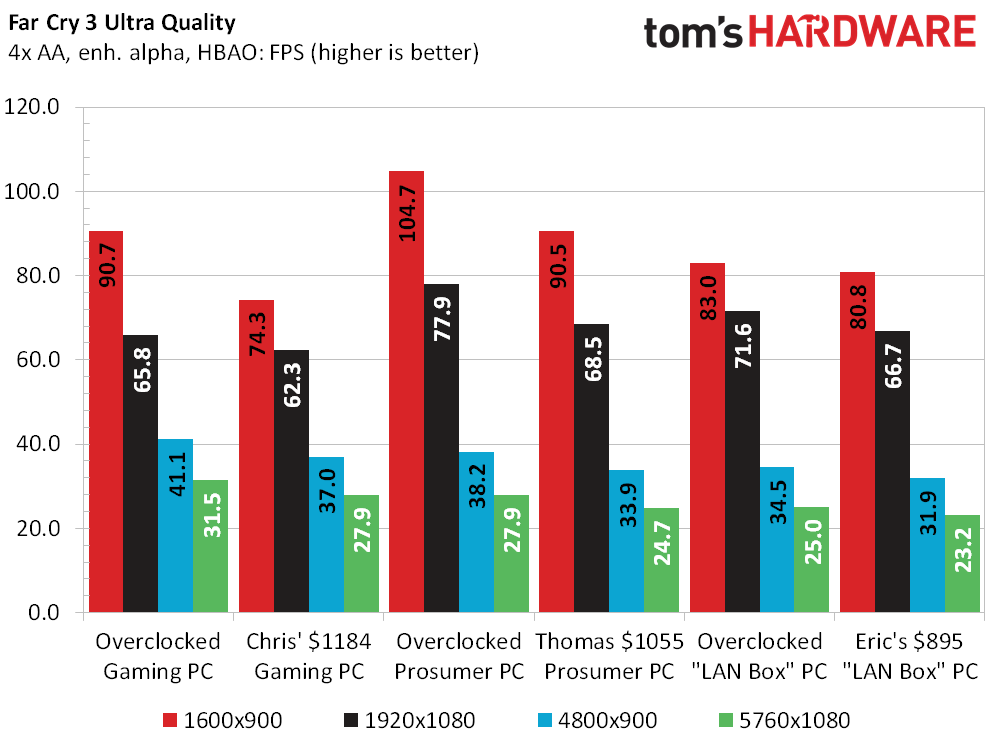
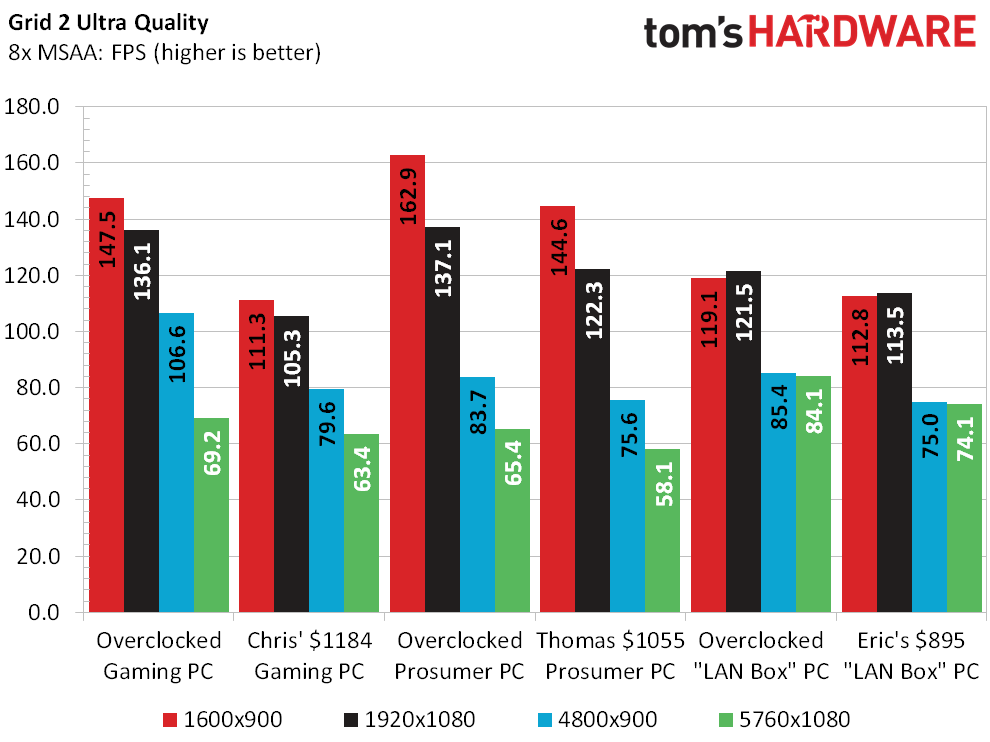
The $1184 machine’s loss in Far Cry 3’s High quality single-monitor resolutions appear to point towards the legendary impact of Radeon graphics on CPU performance. More evidence comes from Eric’s mediocre scores at those same settings, since he has the same graphics card (but a weaker CPU compared to the $1055 PC).
Applications
The dual-core CPU of Eric’s $895 build loses badly to the quad-core chips in multi-threaded applications, but performs adequately in single-threaded audio encoding. Meanwhile, our Adobe After Effects workload shows that it really needs the extra RAM of my $1055 PC by punishing Chris’ otherwise-similar $1184 gamer.
Get Tom's Hardware's best news and in-depth reviews, straight to your inbox.
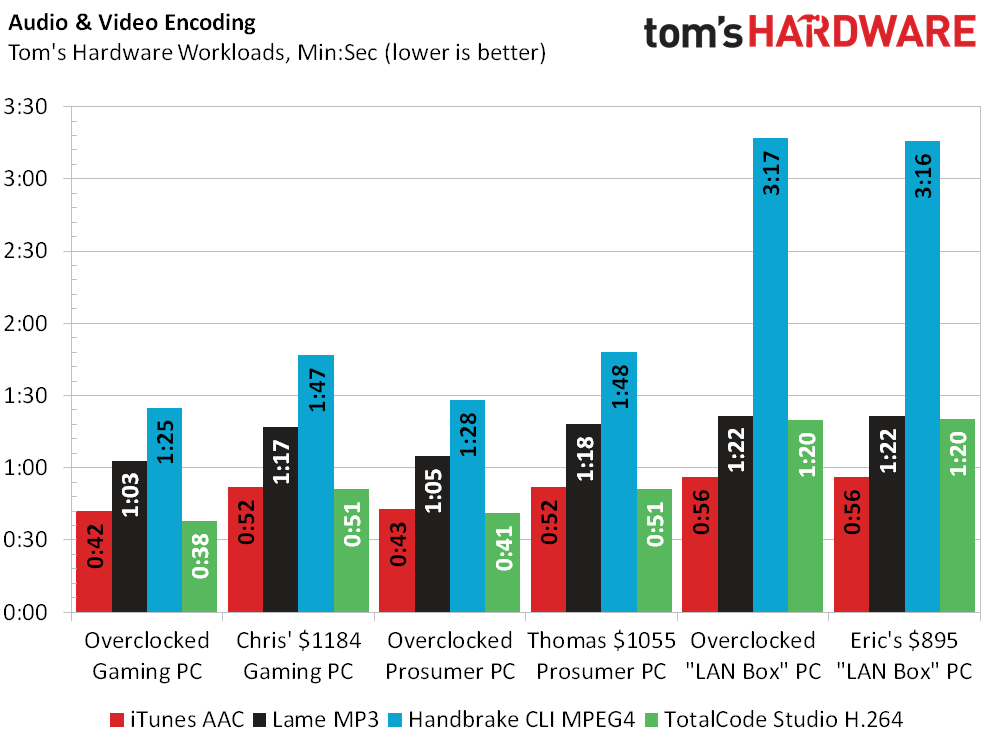
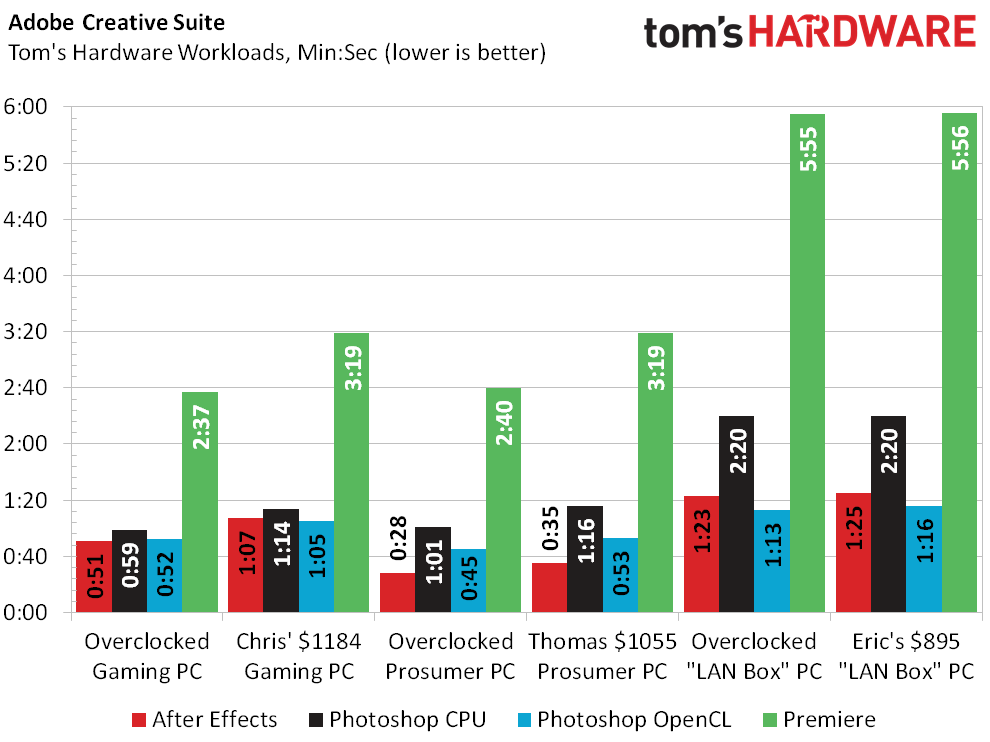
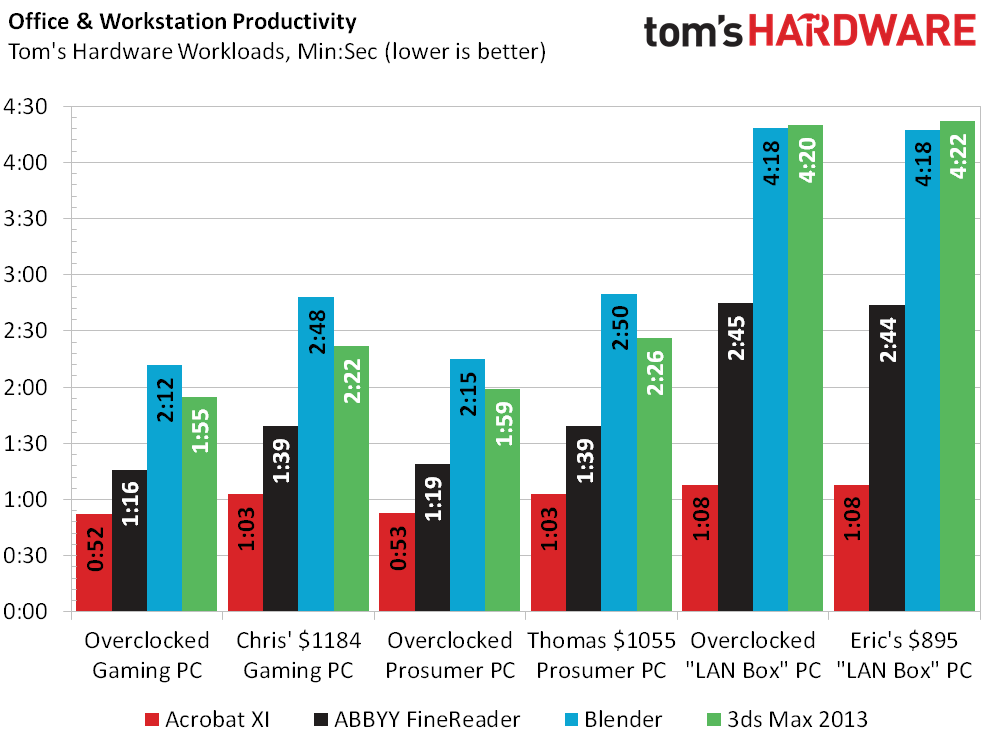
Adobe Photoshop OpenCL filters treat us to a wide range of configuration data points, preferring my GTX 970 to Chris’ R9 390 and my faster CPU to Eric’s slower model.
Power, Heat & Efficiency
At stock settings, Chris’ CPU uses much less load power than my identical CPU, even though my entire machine has lower idle energy draw than his. Rather than confirm that his Prime95 configuration had both four threads and small FFTs, I’ll hand him a small concession. After all, his GPU load and combined load numbers are terrible.
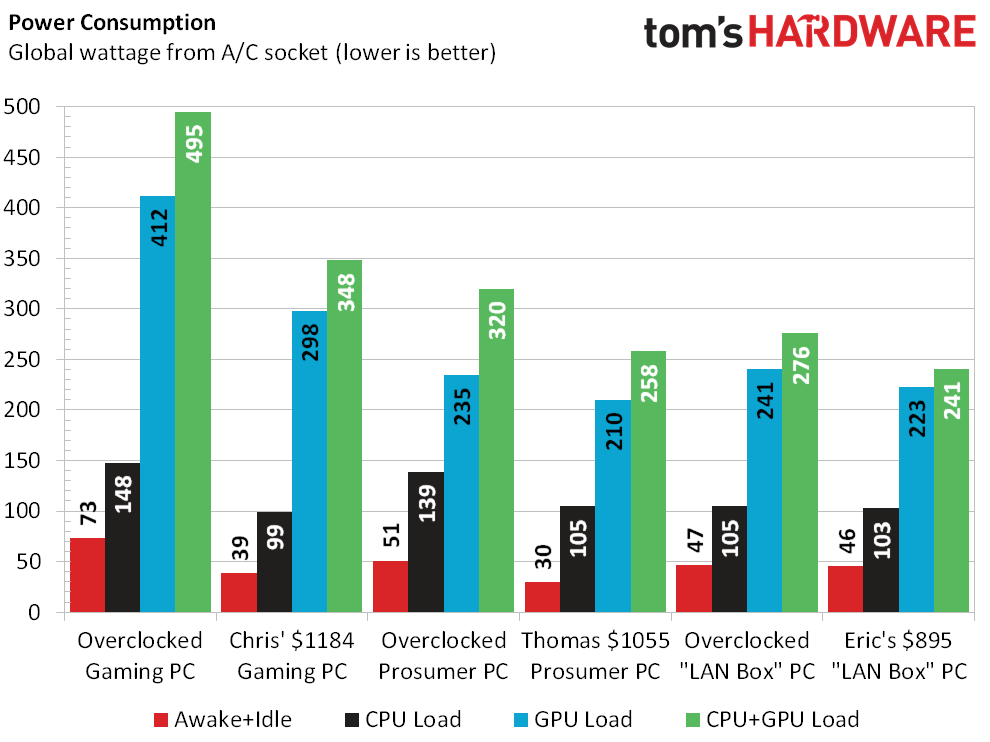
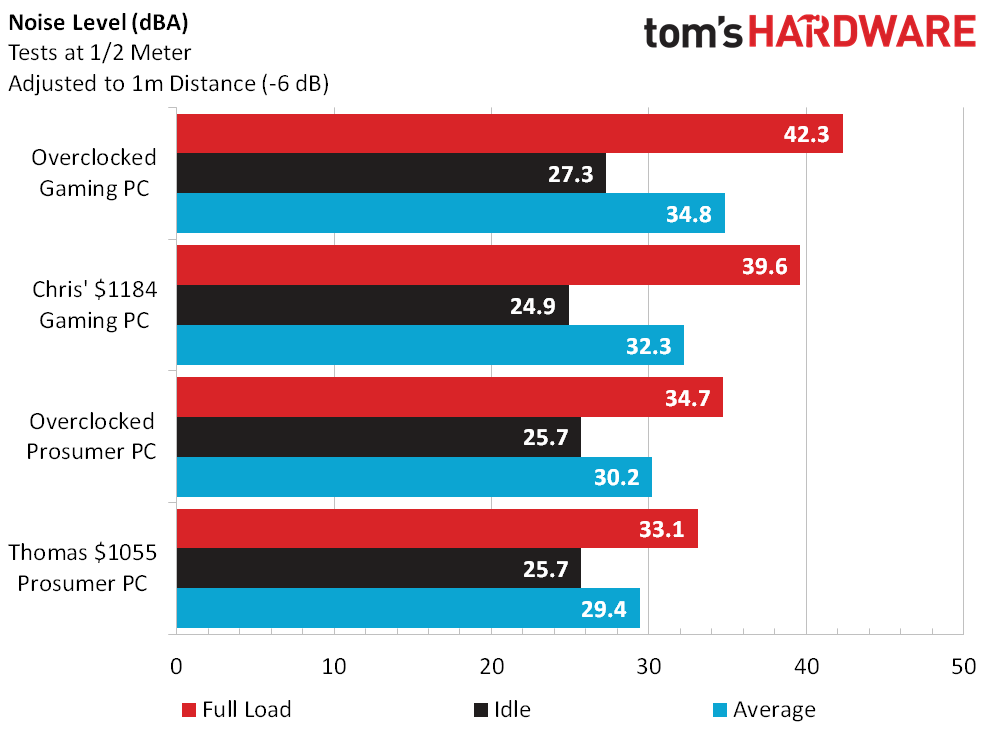
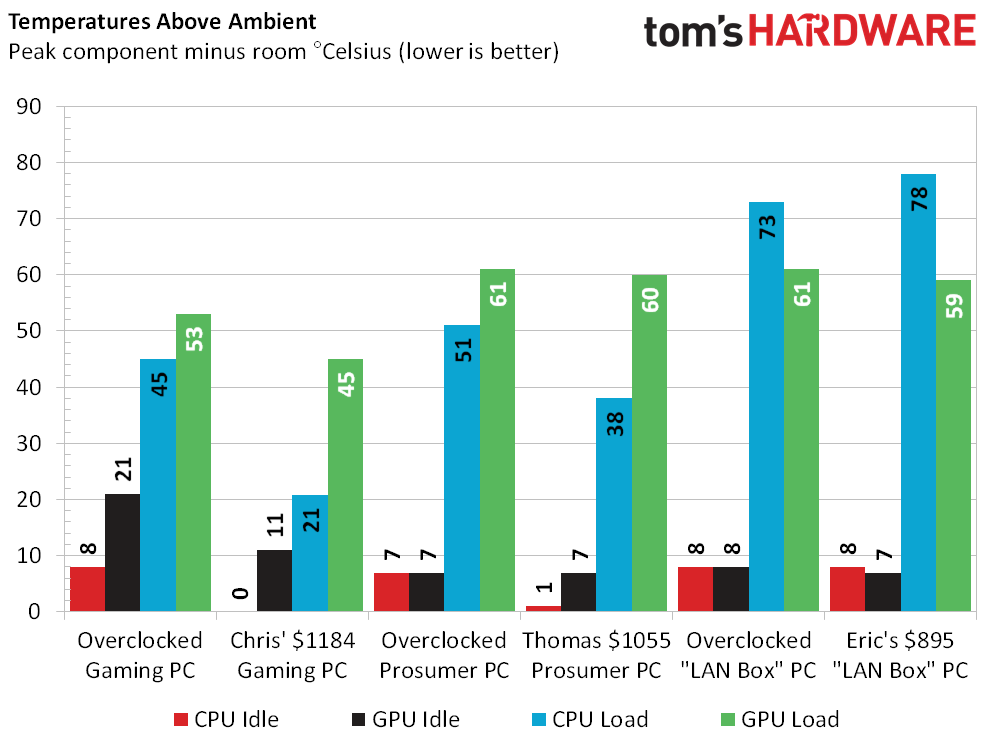
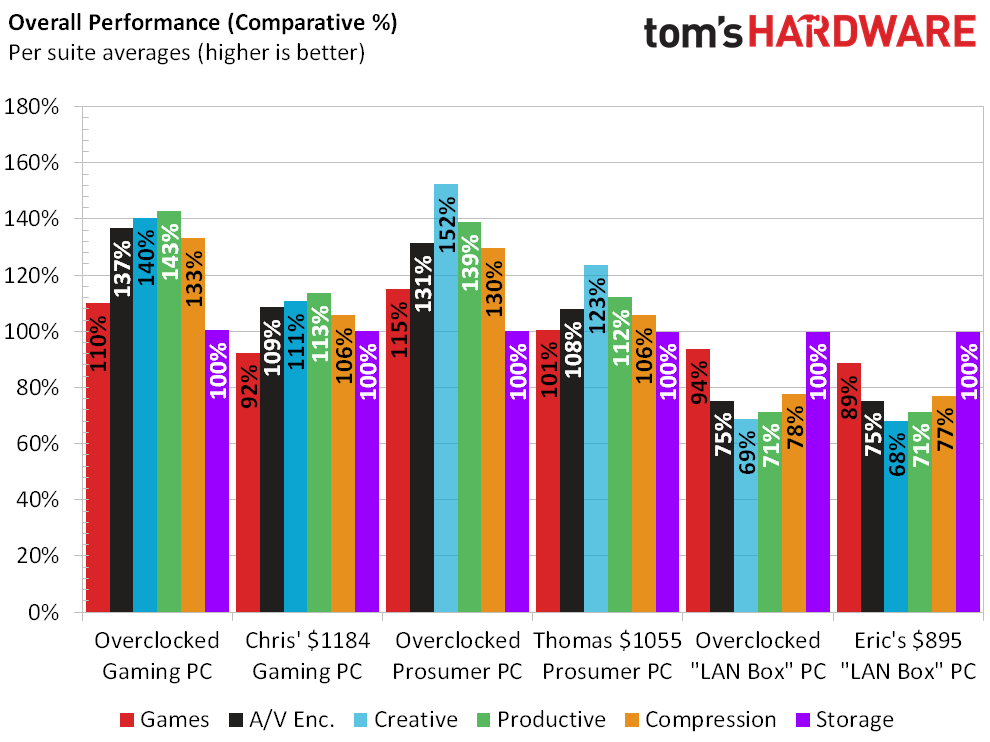
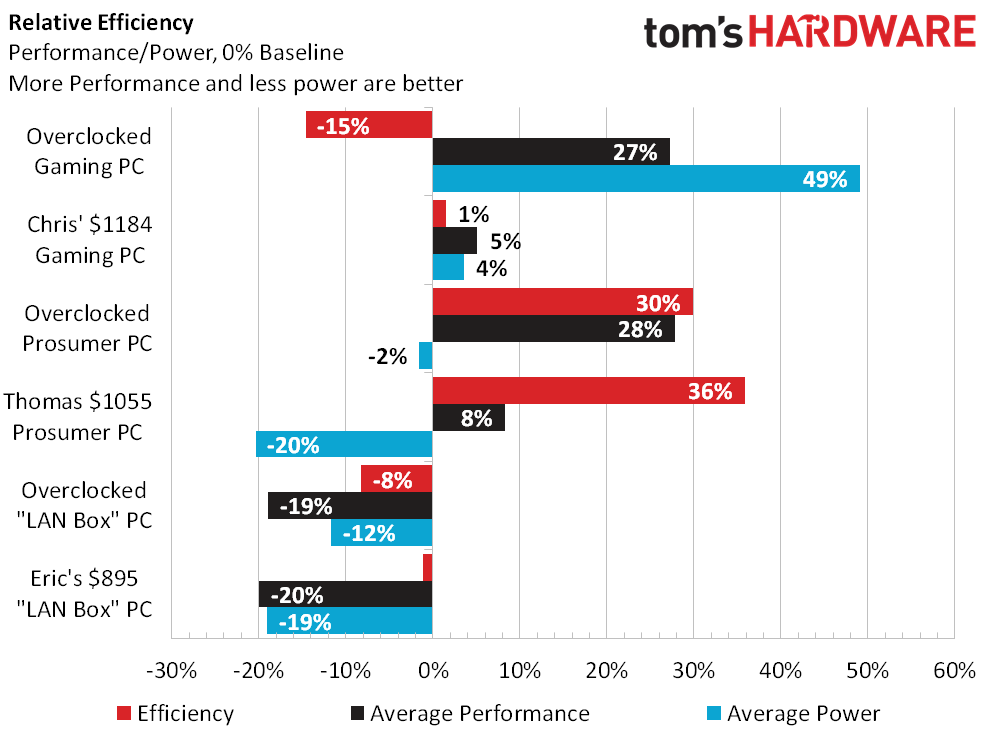
Even without asking Chris to retest his CPU load wattage, our efficiency chart hands my $1055 machine an enormous “green” victory.
Current page: How We Test & Results
Prev Page Introduction & Q4 2015 Build Lineup Next Page Value & Conclusion-
Onus I like all three of these machines. Any changes I'd make would be niggles, and mostly a matter of scale. I'd be happy to win any of them, and would probably do some minor mixing and matching with what I already have.Reply
For all of them, I'd upgrade the SSD to 500GB just because I can.
I'd pull the power-scarfing R9 390 out of the gaming PC, put in my GTX970, and probably add another drive for a RAID1 pair. I'm not anti-AMD, but another 200W+ under load is a horrific waste. I really hope AMD can get back in the low-power competition; the HD4670, HD5670, HD6670, and HD7750 were all amazing cards for how little power they used.
The prosumer machine would get a RAID1 pair of drives added.
The LAN box is actually a tough call. I could just add one more drive to it also, but I'd be sorely tempted to put a H170 mITX board and Skylake i3 in it instead, if only because those are available to me. I would not need to though; it's an excellent machine as it is.
-
Crashman Reply
Maybe that's why the individual builds are still generating feedback and the 3-way comparison isn't :)17222247 said:I like all three of these machines.
-
RedJaron The Windows I bought for my build isn't download only. It's on a DVD with the rest of my parts. I threw in the USB drive so the winner wouldn't have to install Windows over a USB 2.0 ODD.Reply
That said, I really thought I had a shot at the value win when I saw you two spending $200 more than me. Skylake's better memory bandwidth makes a big difference. We may need to re-visit memory bandwidth in gaming because I'm pretty sure I saw mine get affected with the machines I built this time.
But I shot-myself in the foot by limiting what I could build last quarter. There's only so many ways you can take a LAN box. A general purpose PC would've been wide open for value oriented changes and improvements. If I get a shot next quarter, I may well game the system to make something designed to win value. That actually could be an interesting experiment. Would a machine purpose built for value alone still provide enough pure performance to satisfy an end user? -
Crashman Reply
Dude, isn't it enough to tie me at stock speed? I mean, I spent the OC money to OC right? I'd better get some advantage from it!17224021 said:The Windows I bought for my build isn't download only. It's on a DVD with the rest of my parts. I threw in the USB drive so the winner wouldn't have to install Windows over a USB 2.0 ODD.
That said, I really thought I had a shot at the value win when I saw you two spending $200 more than me. Skylake's better memory bandwidth makes a big difference. We may need to re-visit memory bandwidth in gaming because I'm pretty sure I saw mine get affected with the machines I built this time.
But I shot-myself in the foot by limiting what I could build last quarter. There's only so many ways you can take a LAN box. A general purpose PC would've been wide open for value oriented changes and improvements. If I get a shot next quarter, I may well game the system to make something designed to win value. That actually could be an interesting experiment. Would a machine purpose built for value alone still provide enough pure performance to satisfy an end user?
Sorry about the DVD thing, Newegg isn't actually telling me that the Win10 package you bought comes with media.
-
RedJaron Well, no, like you said, part of your cost was the ability to overclock. If you didn't use that, it's like paying for a dGPU but not installing it. You were right, that is a fair comparison. I lost.Reply -
Onus It's great to get a high bang/buck, but you still need some minimum amount of "bang" to be useful. Those with 144Hz monitors will disagree, but for mainstream 1080p gaming, counting FPS over 60 as no better than 60 might hand that value win to a GTX950.Reply
-
Crashman Reply
Yes, and your climb rate means next time you'll probably win. But I have a plan:17224971 said:Well, no, like you said, part of your cost was the ability to overclock. If you didn't use that, it's like paying for a dGPU but not installing it. You were right, that is a fair comparison. I lost.
I CAN'T win if I spend big, so how about next time we give me a big somewhat-specific budget where I'm required to spend most of the money, and likewise an excuse not to win? Then I'd basically be putting all my O/C effort in to reach 80-90 percent of your score :-D
These head-to-heads are brutal, I don't want anyone to lose the value competition unless they have an excuse such as "chasing better quality and more user-friendly features."
-
Crashman Reply
Remember Paul? We figured out that you can find perfect performance-value around $600, and that the closer you got to $800 by trying to cram in performance parts, the more the rest of the system held you back. That you had to keep upgrading the rest of the system until you reached balance, before you'd get the value score back up at a higher performance level. And that the second value zenith was around $1100.17225115 said:Make it more brutal; cut the budgets down to $550-$600.
People want to see $800 builds, but we knew long ago that everything between $650 and $1050 was a "dead zone".
Did this experience with Paul give me an unfair advantage? It depends on what you consider fair. I would have used this CPU anyway, and a $250 to $320 graphics card, so my path was set without consideration of the final price. Fortunately, reader feedback on the Q3 SBM meant that I didn't need to pick the graphics card, they did it for me. -
RedJaron Well, if we're all at that magical $600 range, then it could be interesting to see who can find the best balance. Granted, at that price range, are we each going to end up with near identical builds due to us chasing the same sales? I wouldn't mind going after something a little more simple.Reply
