Nvidia GeForce RTX 2060 Review: Is Mainstream Ray Tracing For Real?
Why you can trust Tom's Hardware
Power Consumption
Slowly but surely, we’re spinning up multiple Tom’s Hardware labs with Cybenetics’ Powenetics hardware/software solution for accurately measuring power consumption.
Powenetics, In Depth
For a closer look at our U.S. lab’s power consumption measurement platform, check out Powenetics: A Better Way To Measure Power Draw for CPUs, GPUs & Storage.
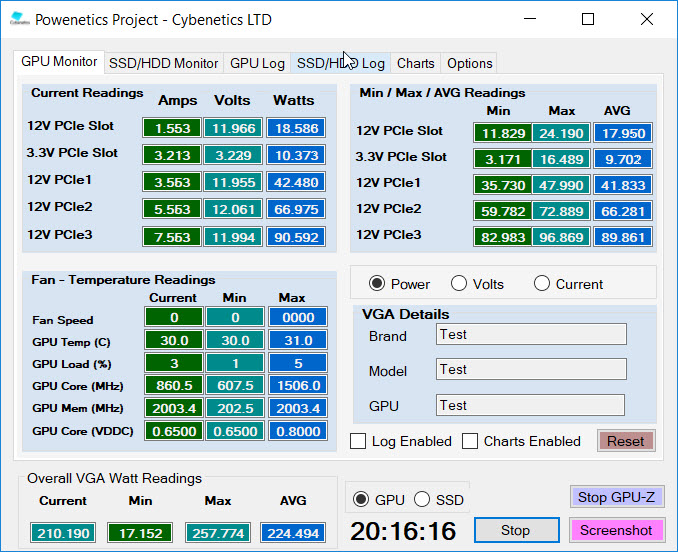
In brief, Powenetics utilizes Tinkerforge Master Bricks, to which Voltage/Current bricklets are attached. The bricklets are installed between the load and power supply, and they monitor consumption through each of the modified PSU’s auxiliary power connectors and through the PCIe slot by way of a PCIe riser. Custom software logs the readings, allowing us to dial in a sampling rate, pull that data into Excel, and very accurately chart everything from average power across a benchmark run to instantaneous spikes.
The software is set up to log the power consumption of graphics cards, storage devices and CPUs. However, we’re only using the bricklets relevant to graphics card testing. RTX 2060 Founders Edition gets all of its power from the PCIe slot and one eight-pin PCIe connector.
Idle
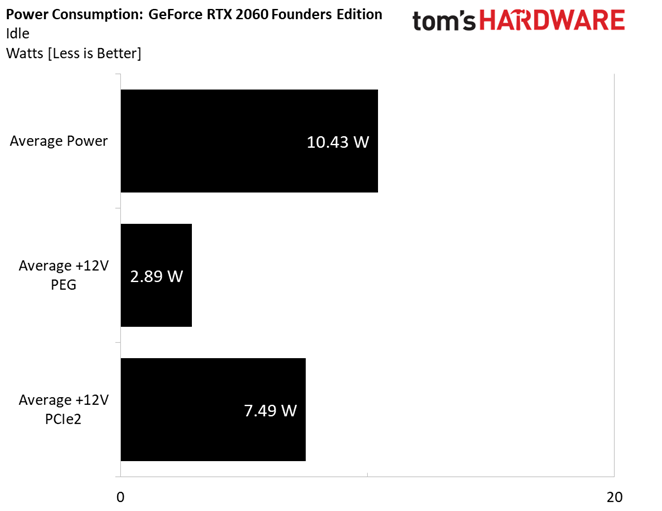
The GeForce RTX 2060’s 10.4W idle power consumption is about 1W lower than GeForce RTX 2070. But that’s still quite a bit more than last generation’s Pascal-based cards. Even the GeForce GTX 1080 only idled around 8W.
Gaming
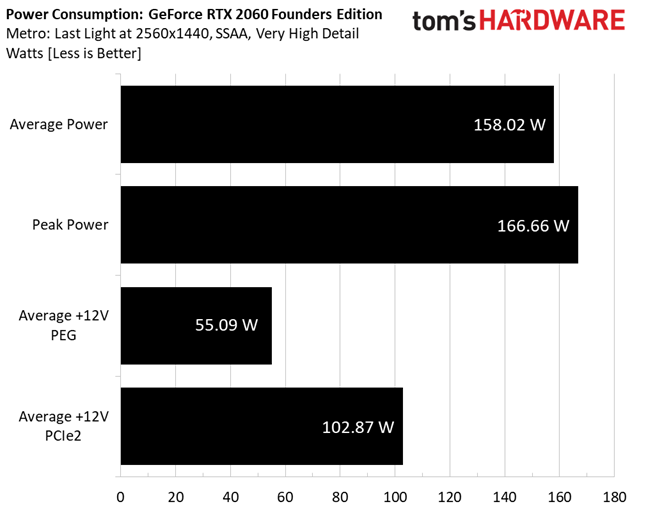
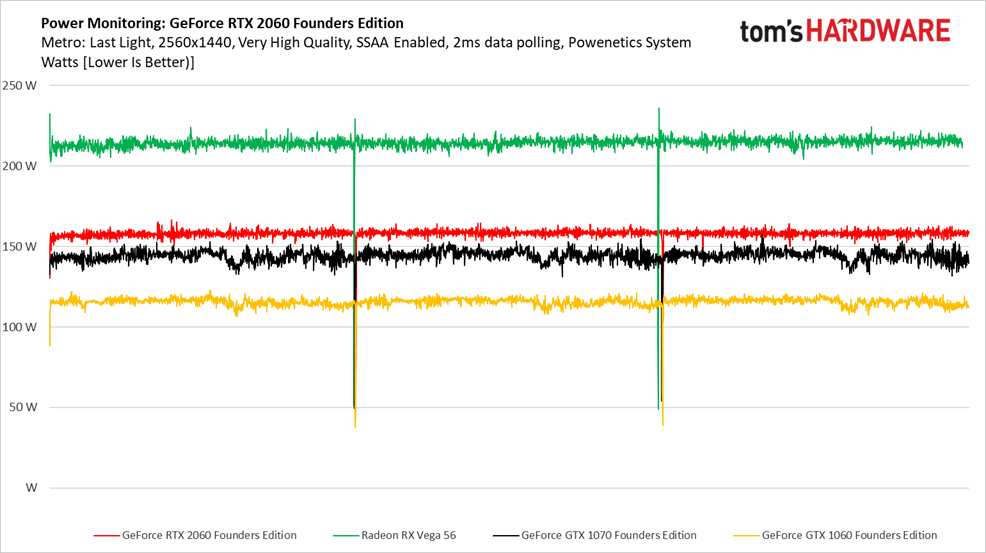
Through our Metro: Last Light benchmark sequence, RTX 2060 obeys its power target much more dutifully than a lot of the RTX 20-series partner cards we’ve tested. At most, it peaks at 166W.
Get Tom's Hardware's best news and in-depth reviews, straight to your inbox.
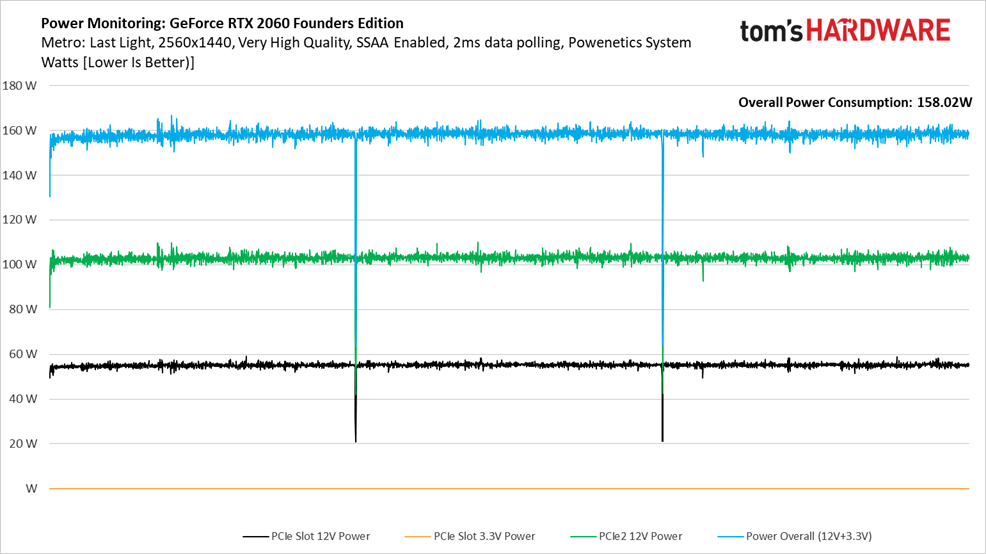
Charting power across three loops of the Metro: Last Light benchmark shows us tight line graphs from beginning to end.
It’s clear that RTX 2060 has higher power requirements than its generational predecessor, the GTX 1060. In fact, the RTX 2060 needs more power than GTX 1070. It’s only AMD’s Vega 56 that makes TU106 look tame by comparison.
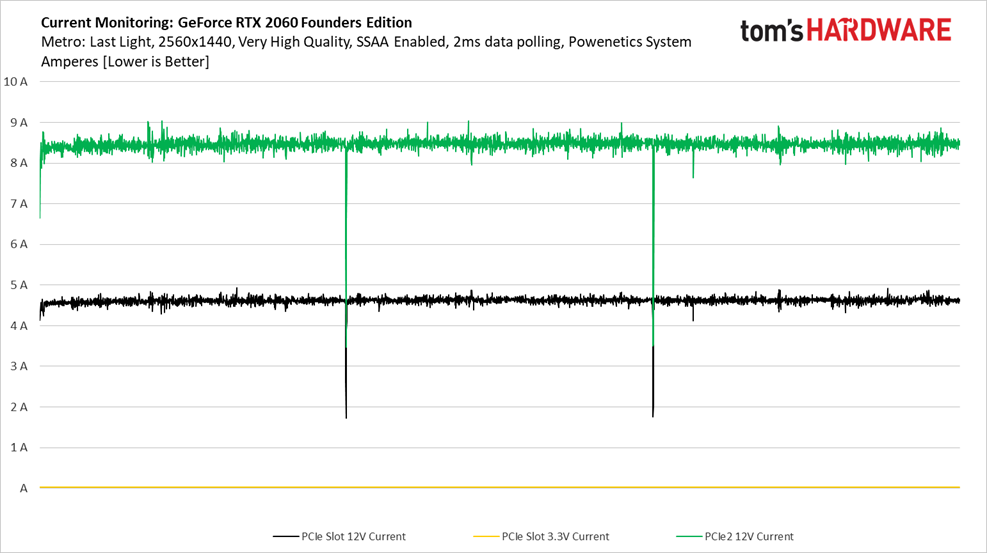
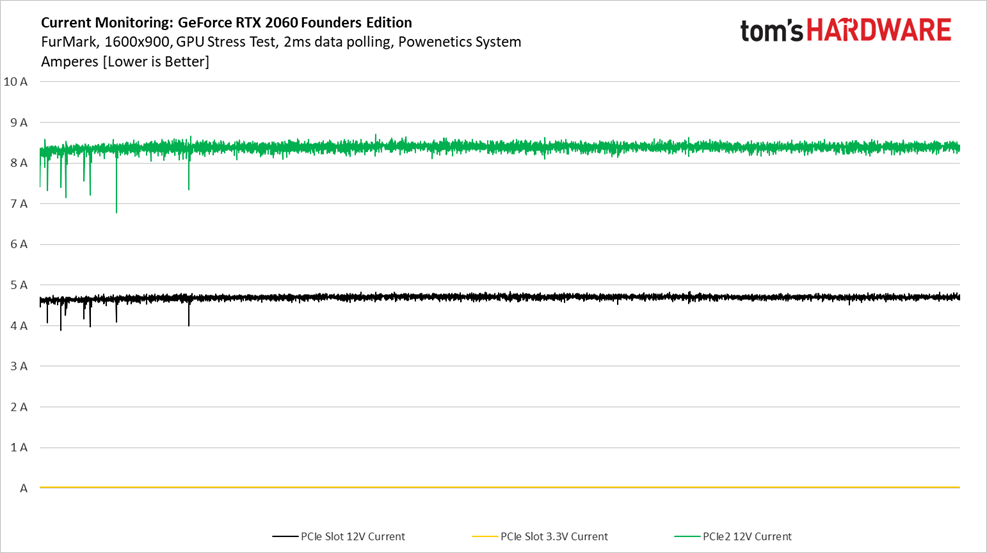
Nvidia is careful not to violate the PCIe slot’s 5.5A maximum. Throughout our benchmark, current flow remains below 5A at all times.
FurMark
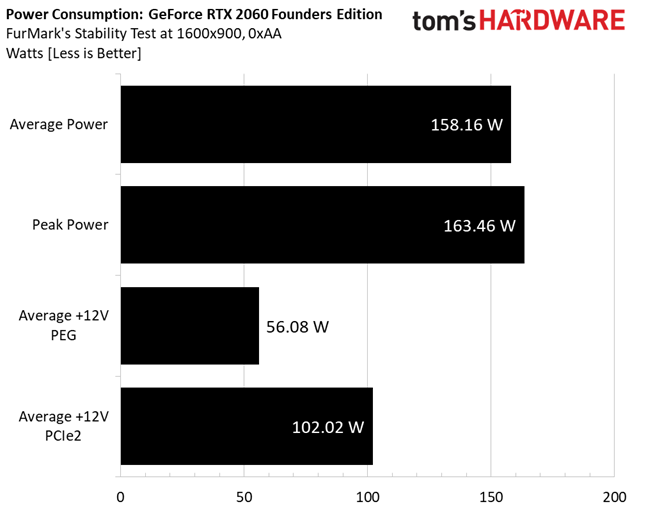
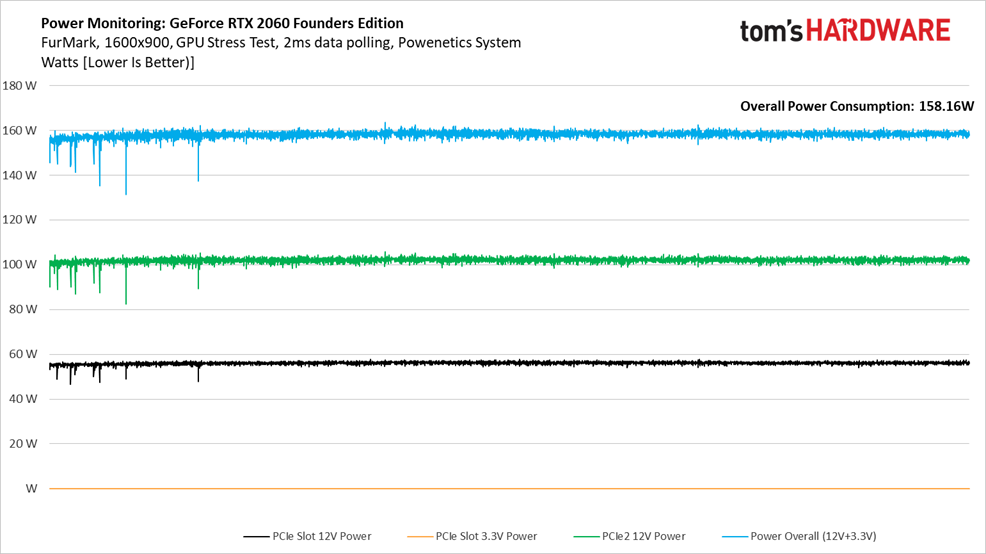
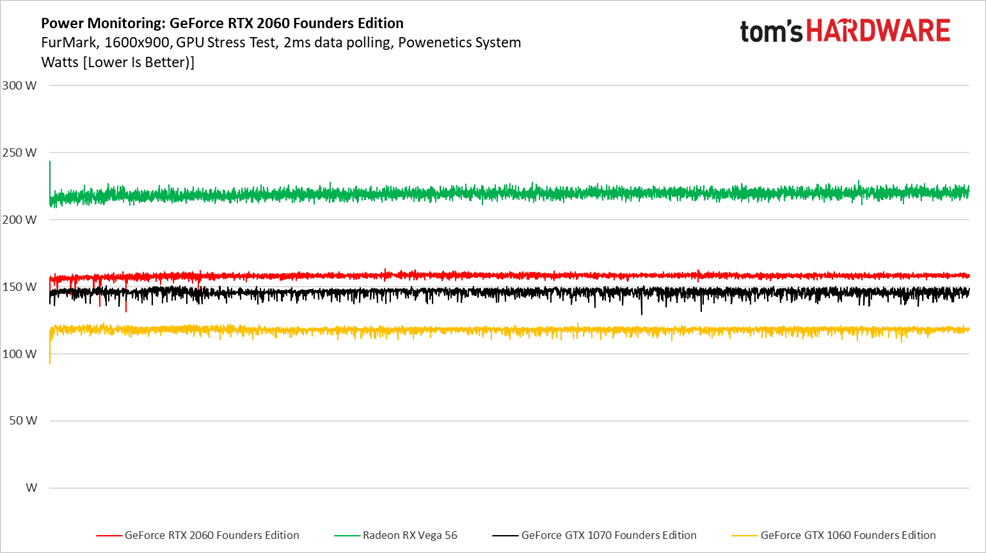
It used to be that power consumption under FurMark was way higher than any gaming workload. However, both AMD and Nvidia do a better job of squeezing maximum performance from their modern GPUs at a given power budget and then pulling back voltage/frequency under loads like FurMark to avoid violating their respective limits. As a result, our FurMark chart looks a lot like the Metro: Last Light numbers we generated.
It’d be difficult to tell this workload apart from our gaming test if it wasn’t for the dips that happen between runs in Metro.
That observation isn’t true across the board, though. Nvidia’s previous-gen GTX 1060 and 1070 are more constrained by FurMark than Metro: Last Light, resulting in tighter line charts that trend higher than our game benchmark. The same is true for AMD’s Vega 56, though to a less obvious extent.
Aside from a few dips toward the start of our recording, current delivery is nice and smooth. Again, the PCIe slot never even reaches 5A.
MORE: Best Graphics Cards
MORE: Desktop GPU Performance Hierarchy Table
MORE: All Graphics Content
Current page: Power Consumption
Prev Page Results: The Witcher 3 and Wolfenstein II: The New Colossus Next Page Temperatures and Fan Speeds