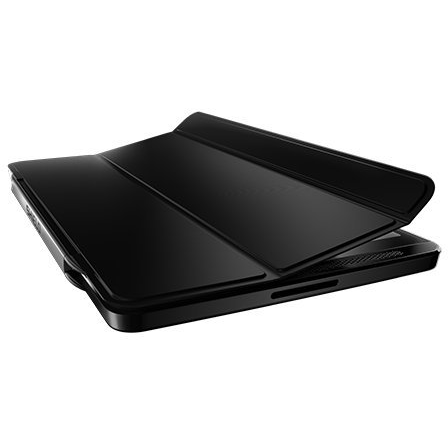
Nvidia Shield Tablet And Shield Controller Review
The Shield Tablet, powered by Nvidia’s Tegra K1 SoC, deftly handles browsing and media playback duties. Combining it with the wireless Shield Controller transforms the 8-inch device into an exciting mobile gaming platform.
Results: CPU Core Benchmarks
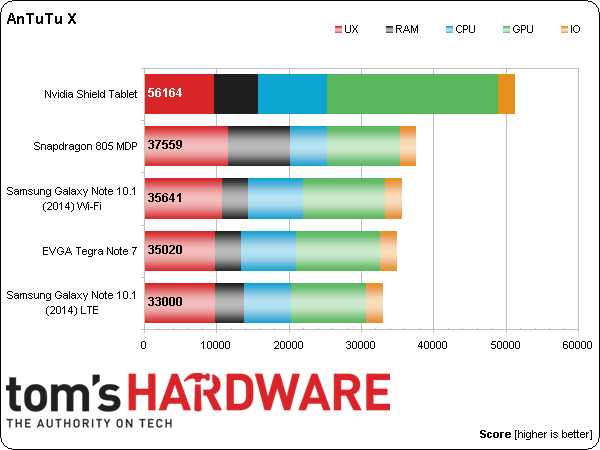
AnTuTu X
AnTuTu is an Android system benchmark designed to test the performance capabilities of four major aspects of mobile devices: Graphics (encompassing 2D, UI and basic 3D), CPU (fixed, floating-point and threading), RAM (read and write), and I/O (read and write).
The Shield Tablet easily outscores the other devices in this system benchmark thanks to its Kepler GPU, which is more than twice as fast as Qualcomm's latest Adreno 420 GPU in the Snapdragon 805 SoC! Kepler’s advantage is specific to the 3D graphics sub-test though, with the Adreno 420 equaling its 2D score.
All three -A15-based SoCs outscore Snapdragon’s Krait architecture in the CPU test. The higher-clocked, newer revision -A15 cores in Tegra K1 show a 23% advantage over Samsung’s Exynos 5 Octa.
Snapdragon 805’s 25.6GB/s of memory bandwidth give it the highest score in the RAM test, while the Shield Tablet places second with its 14.9GB/s.
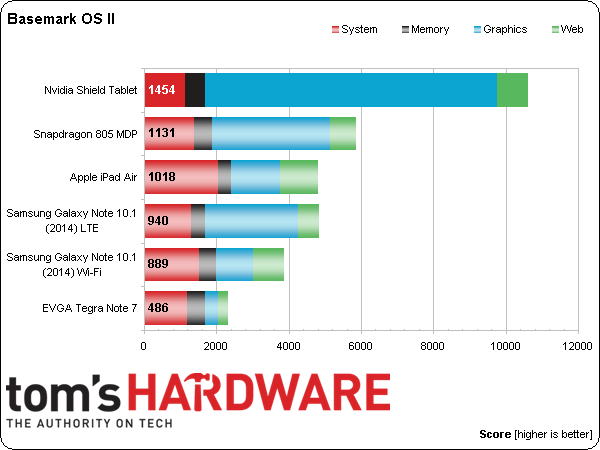
Basemark OS II Full (Anti-Detection)
Basemark OS II is an all-in-one tool designed for measuring overall performance of mobile devices. It scores each device in four main categories: System, Memory, Graphics and Web. The System score reflects CPU and memory performance, specifically testing integer and floating-point math, along with single- and multi-core CPU image processing using a 2048x2048-pixel, 32-bit image. Measuring the transfer rate of the internal NAND storage (Memory) is done by reading and writing files with a fixed size, files varying from 65KB to 16MB, and files in a fragmented memory scenario. Calculating the Graphics score involves mixing 2D/3D graphics inside the same scene, applying several pixel shader effects, and displaying 100 particles with a single draw call to test GPU vertex operations. The benchmark is rendered at 1920x1080 off-screen 100 times before being displayed on-screen. Finally, the Web score stresses the CPU by performing 3D transformations and object resizing with CSS, and also includes an HTML5 Canvas particle physics test.
Another impressive performance for Tegra K1 with a 2.5x advantage over Snapdragon 805 in the Graphics test. It’s also six times faster than the PowerVR G6430 GPU in the iPad Air and 22x faster than the feeble GeForce ULP GPU in the Tegra 4.
Apple’s A7 remains unbeaten in the CPU-centric System and Web tests.
Get Tom's Hardware's best news and in-depth reviews, straight to your inbox.
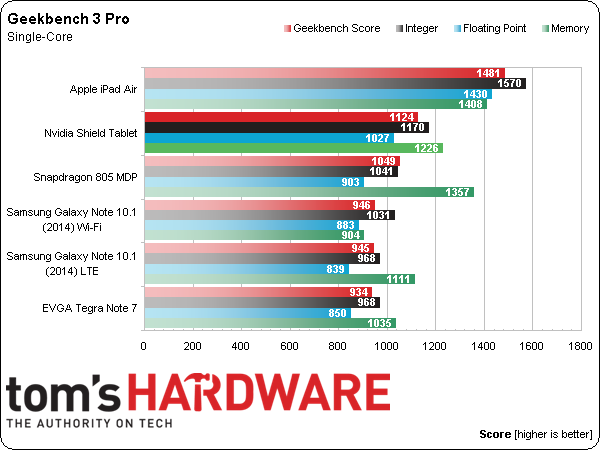
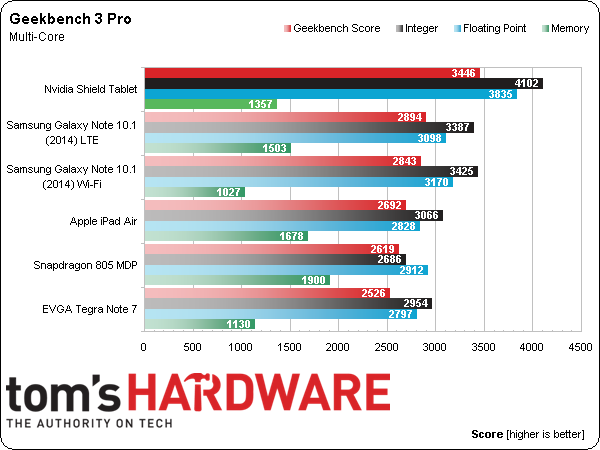
Geekbench 3 Pro (Anti-Detection)
Primate Labs' Geekbench offers a wide selection of cross-platform compatibility, with apps available for Windows, OS X, Linux, iOS and Android. This simple system benchmark produces two sets of scores: single- and multi-threaded. For each, it runs a series of tests in three categories: Integer, Floating Point and Memory. The individual results are used to calculate category scores, which, in turn, generate overall Geekbench scores.
The A7 in the iPad Air posts the highest scores, even though it operates at the lowest frequency. Its emphasis on execution width and larger caches proves to be the winning formula.
Snapdragon 805 falls behind Tegra K1 once again in CPU performance, with about a 13% deficit. Compared to the lower-clocked -A15 cores in the Exynos 5 Octa, the Tegra K1’s performance scales almost perfectly with clock speed.
With half as many CPU cores as its competitors, the A7 drops out of first place in the Multi-Core test, yielding the position to the Tegra K1.
Snapdragon 805 shows off its superior memory bandwidth. However, its Integer and Floating Point scores are lower than the Snapdragon 800 in the Galaxy Note 10.1 LTE, which itself is about 23% slower than the Shield Tablet in the same tests.
MobileXPRT 2013
Principled Technologies' MobileXPRT 2013 is a modern SoC benchmark for Android. It consists of 10 real-world test scenarios split into two categories: Performance and User Experience.
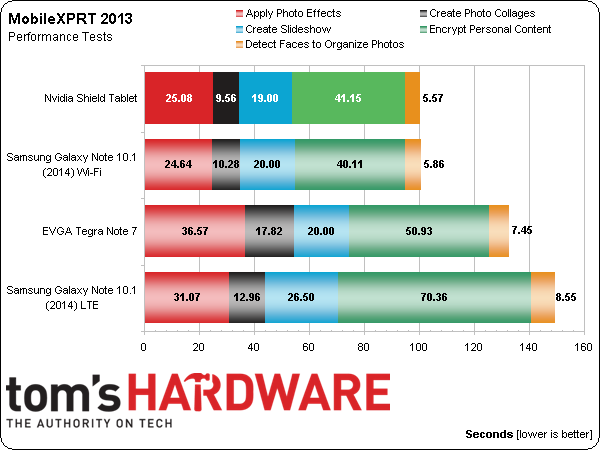
The Performance suite contains five tests: Apply Photo Effects, Create Photo Collages, Create Slideshow, Encrypt Personal Content and Detect Faces to Organize Photos. Performance results are measured in seconds. The User Experience suite also has five tests: List Scroll, Grid Scroll, Gallery Scroll, Browser Scroll and Zoom and Pinch. These results are measured in frames per second. The category scores are generated by taking a geometric mean of the ratio between a calibrated machine (Motorola's Droid Razr M) and the test device for each subtest.
Despite its 16% clock rate advantage, the Tegra K1 posts essentially the same scores as the Exynos 5 Octa in every test. These benchmark results don’t align with either CPU frequency or memory bandwidth and are difficult to explain.
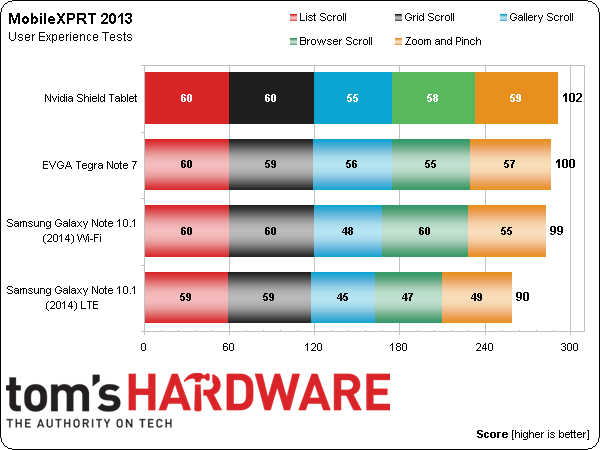
The unit of measure for the User Experience Tests is frames per second. Values for each individual test are shown within the bar graph. The number to the right of each bar is the computed score; higher is better.
The Shield Tablet is pretty much limited by v-sync in every test except Gallery Scroll. All of the devices are within 10% of each other and provide acceptable frame rates.
Current page: Results: CPU Core Benchmarks
Prev Page Benchmark Suite, Methodology And System Specs Next Page Results: HTML5 And JavaScript Benchmarks-
blubbey Those GPGPU benchmarks are ridiculous in comparison. It looks like a great bit of kit from what I've seen so far. A die shrunk Maxwell should be fantastic. Maybe even a lower clocked version just for power consumption? It'll still perform as well, if not better than the K1 at 750MHz (assuming 2 SMMs) I'd assume.Reply -
Memnarchon "Based on these results, Tegra K1 must be “a neural net processor; a learning computer” sent back through time to destroy all of the other SoCs that could lead a rebellion in the post-apocalyptic future."Reply
Lol this is epic! xD
Anyway, great and unique review. Especially for the so many GPGPU benchmarks.
Nvidia tablet at $299 seems to be a great buy. -
aberkae If maxwell brings double the performance per watt on the same node the next tegra chip on 20 nm node should be a home run for the companyReply -
deftonian Impressive, but I feel it's still missing that "umph" to get me to buy this and carry it around as an added device, next to my phone (Note 3). Maybe I just don't game enough on the android market or steam. Either way, I think it is impressive for a mobile gaming device and all the things it offers. I think they've started a great line and hope it grows into a successful tablet/gaming brand.Reply -
aberkae If maxwell brings double the performance per watt on the same node the next tegra chip on 20 nm node should be a home run for the companyReply -
gio2vanni86 The streaming a game while i'm at my friends house using my PC at home is what has me very interested. Plug into his TV and play amazing games he can only dream of. I'm in.Reply -
vithrell Just wait for Intel's Core M. It wont match the price (CPU alone will cost $300), but in fanless tablet form factor it wont have worthy competitor. Early GPU benchmarks give Core M 55k graphics score in Ice Storm, so more than 1.5x more power than Tegra K1. AND you can run full Windows on it. I wish Nvidia took x86 path with its cpu cores.Reply
