Price/Performance Charts: U.S. retail still waiting for effect of AMD price cut
Click on the chart for a larger view and more details
All Mainstream AMD processors move below Intel price/performance curve(for currently available, non-overclocked processors)
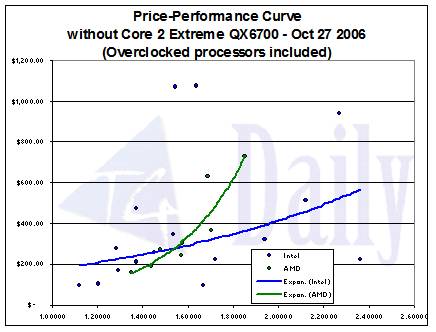
Here's the data of all the processors except the not-yet-released QX6700, including any applicable overclocked ones. This is the chart we've been following most closely over the past three weeks. Strictly by looking at the shape, it has not changed much over the one from last week. However, there are individual changes on processor pricing for both Intel and AMD that caused smaller changes on a deeper level.
Firstly, because of the erratic price shifts for AMD processors, which are likely a first indication of other AMD price cuts, the correlation coefficient for AMD's curve dropped to 0.891. This is somewhat of a substantial decrease from last week's 0.942, and the first time in the last three weeks where it's dropped below 0.9. This means that AMD's price-to-performance stability, which has previously been unquestionably iron-clad, fell a little bit this week. While a 0.89 correlation is still very strong, it is certainly a slip from where it has been in the past. For consumers it means that more attention to the price of a processor and its potential performance is getting more important on the AMD side.
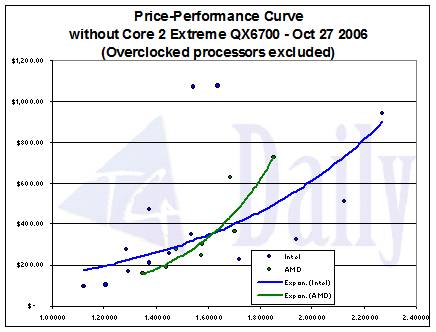
Intel, on the other hand, which we have chided for having seemingly spontaneously scattered prices regardless of performance, had the expected low correlation of 0.331, which is actually a bit of a jump over last week. However, as our readers noted, this number becomes a bit deceiving when incorporating overclocked versions of processors. So, we took a look at a chart that excludes the overclocked data.
In addition to giving AMD a longer-running advantage at the low-end, this chart shows less of a disparity between Intel and AMD at the mid- and high-end levels. Without the overclocked processors at low price points, the Intel curve takes on its more natural exponential shape, and brings its correlation coefficient up to 0.519. While it is now a more accurate depiction for the real world, it still does not give Intel a strong price-to-performance correlation at all.
The reason are the Extreme Edition processors. Visually, they look like misplaced points on Intel's set of data. In fact, if we remove them, Intel's correlation coefficient skyrockets to 0.794. That would make them surprisingly close to AMD. Still, as long as the market continues to over-price the Extreme Editions while the CPUs themselves offer the possibility of overclocking cheaper processors, it cannot offer the level of price/performance guarantee offered by AMD. On the other hand, while AMD processor can be overclocked as well, the substantial overclocking potential of some Intel processors makes them a tremendous value in terms of a price/performance consideration.
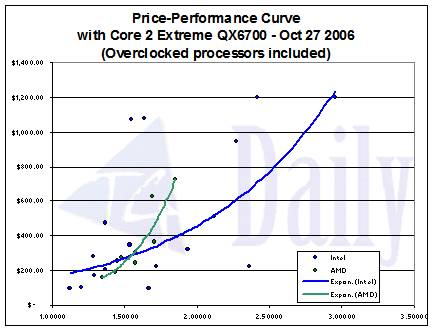
For weeks, we've been looking at the effects of what Intel's Core 2 Extreme QX6700, which has not yet been released, does to the price/performance charts. Because of the processor's significant increase in performance, it's sort of just been hypothetical to look at it. However, the QX6700 is expected to come out in just a couple of weeks, so we can start to really examine what may happen to the overall pricing scale.
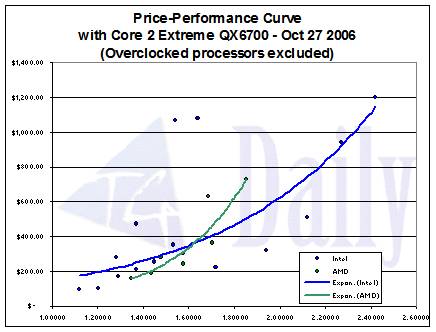
The 6700 has always improved the shape of the Intel curve because the projected price of $1200 fits nicely with the level of performance it offers. However, it does also affect how the other prices fit into the picture. Interestingly enough, when the QX6700 is included, most of the individual points seem to fit more or less in the shape of the curve.
Get Tom's Hardware's best news and in-depth reviews, straight to your inbox.
In fact, even when considering the overclocked processors, the correlation coefficient for the Intel curve nearly doubles from the graph that doesn't have the QX6700, at 0.616. What's interesting is that the EX6800 becomes the only mid- to high-end processor from Intel that falls on top of the price/performance curve. That, in addition to the obvious fact that the 6800 will lose its superiority when the QX6700 comes along, must - following common sense - trigger price cuts for the EX6800. However Extreme processors, no matter which generation never have been cheap. So don't bet the rest of your Christmas presents on a price decrease.
When the overclocked processors are removed from the chart, the correlation coefficient becomes even stronger for Intel, at 0.655. Just for fun, if we take out the Extreme Edition processors, which are in near-outlier territory, that number jumps to 0.856, which suddenly gives Intel a very strong price-to-performance relationship. Of course, until it ditches the EE models, we'll have to stick to the 0.655 figure, which is still strong compared to what we've seen with Intel in the past.
Even if Intel does not have much control over the exact retail prices, one could get the impression that Intel has been anticipatorily creating a general pricing environment, which will not see a big price shift when the next generation processor debuts. We don't know exactly what the price on the new processor will be, but if it is in line with what we are estimating, there could be some noteworthy changes in how we compare Intel and AMD in the future.

Mark Raby is a freelance writer for Tom's Hardware, covering a wide range of topics, from video game reviews to detailed analyses of computer processors.


