Synology DS415+ NAS Review
The Synology DS415+ takes us back to simpler times when storage products focused on storage and features were designed for business users.
Why you can trust Tom's Hardware
4-Corner Testing
Sequential Performance
Before we jump into the real-world workloads, we'll run a handful of synthetic tests. This helps us understand each product's strengths and the areas where performance could be improved.
All of the appliances we're testing were armed with 4TB Seagate NAS hard disks. As a rule, we use RAID 5 array on all systems with six or fewer drive bays. Larger platforms are tested in RAID 6. And some workload servers are tested in RAID 10 for Tom's IT Pro.
In all but one test, we use a single gigabit Ethernet port from the device being tested to a Netgear S3300-52X 100/1000/10,000 switch. We use a Quanta MESOS CB220 server on the other end to administer the workloads. The MESOS CB220 connects to the network via 10 gigabit Ethernet.
In this section, we read and write sequential data using a few different techniques for recording performance. First, we look at I/O at a queue depth of one while scaling up the block size. This is similar to the way ATTO works, but our version lets us drop to a queue depth of one, while ATTO's minimum is four.
In the next series of tests, we measure sequential reads and writes at two block sizes—128KB and 1MB—while increasing the queue depth from one to 256.
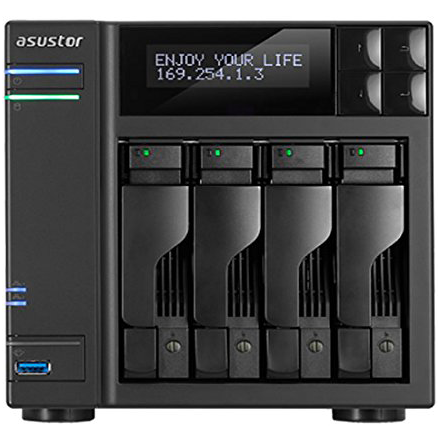
Synology's DS415+ ran flawlessly through both suites. The Asustor AS7004T with a Core i3 processor performed slightly better in a few measurements, but we'd expect that given its higher-end CPU. The AS7004T also boasts four times as much DRAM.
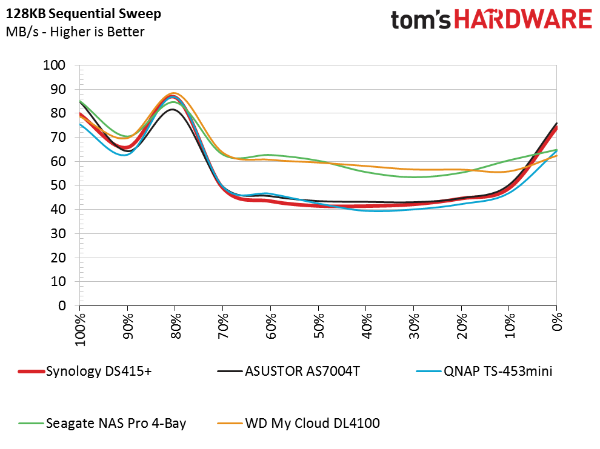
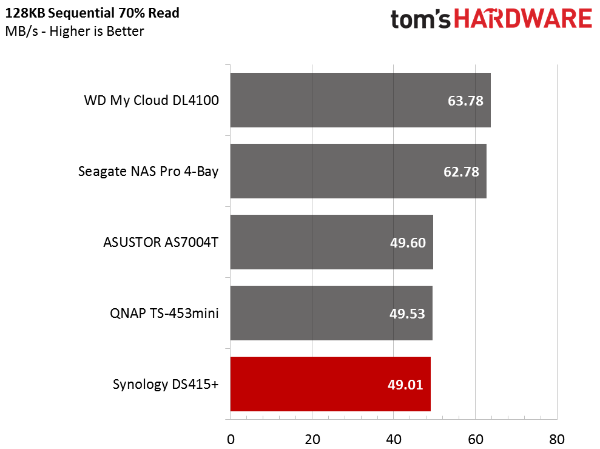
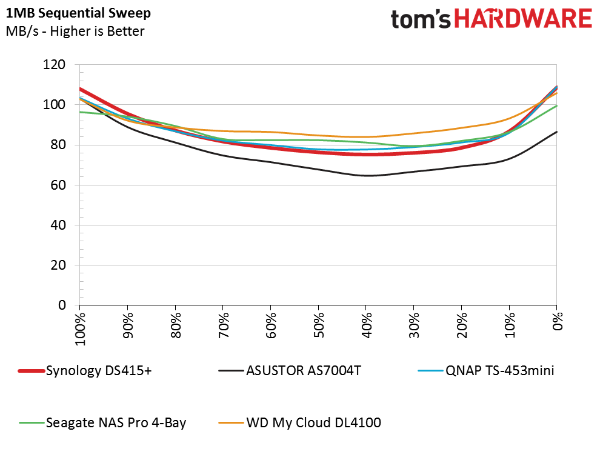
The mixed workload tests deserve special attention. Here, we test with two different block sizes and start with 100 percent reads. In 10 percent increments, we add writes to the mix until we finish with 100 percent sequential writes. As you can see, the systems perform well at the 100 percent extremes. The area in the middle with mixed reads and writes creates a bathtub curve where throughput drops. Our goal is to identify the appliance with the lowest fall-out as it reads and writes data.
Get Tom's Hardware's best news and in-depth reviews, straight to your inbox.
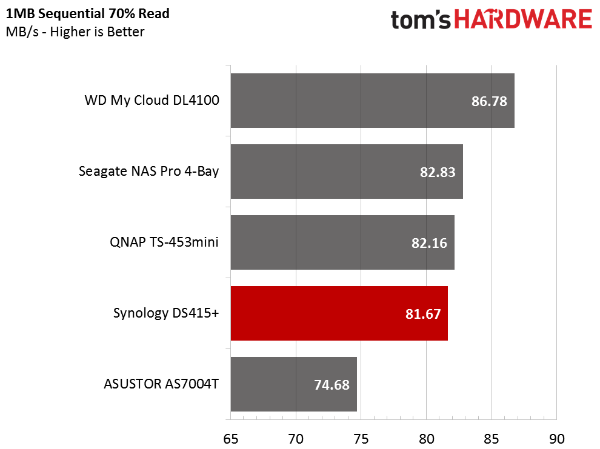
The second chart takes a snapshot of the 70/30 mix. This workload is widely considered to be optimal for measuring workstation performance.
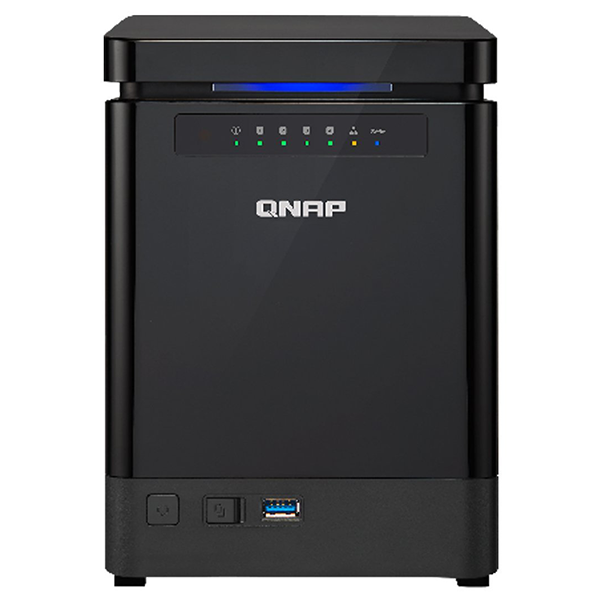
All of the systems fare about the same in these tests, but the two based on Marvell SoCs demonstrate the shallowest bathtub curve as the mix equalized at 50 percent.
Random Performance
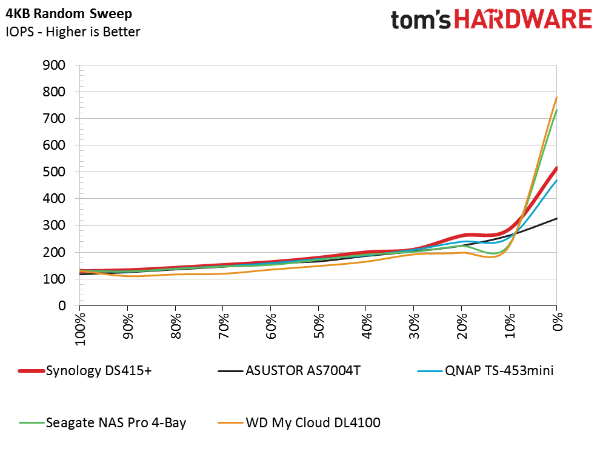
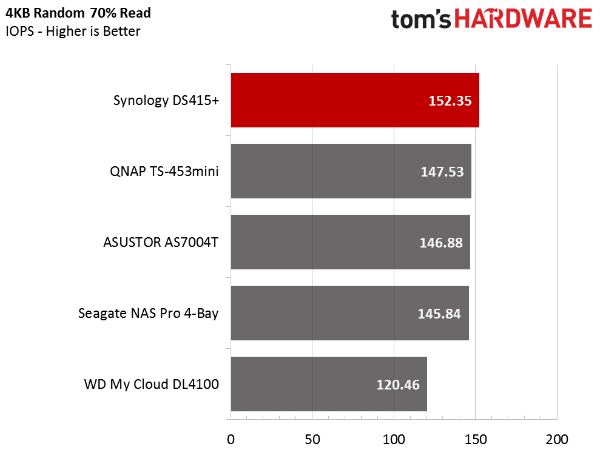
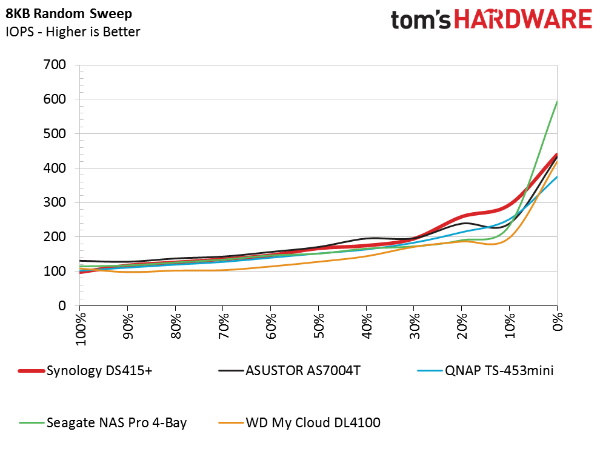
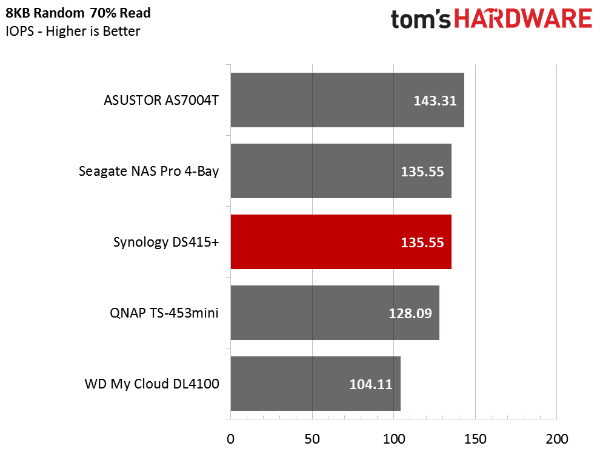
Next, we run the same tests, this time using random data and smaller block sizes. Random performance is often de-emphasized in the NAS world. After all, most file transfers are sequential. But if you use your NAS to run applications from a host PC, you will want a system that can handle random transfers fairly adeptly.
We're using 4KB and 8KB measurements; 4KB is often associated with Windows environments and 8KB is VMware's magic number.
The DS415+'s random reads scale well as queue depth increases. We didn't see a large increase from a queue depth of one to two, but between four and eight there was a large boost to IOPS.


The random data sweeps show a different profile from our sequential results. Still, all of the charted systems perform similarly in these tests.
Current page: 4-Corner Testing
Prev Page A Closer Look Next Page SMB, iSCSI & Standard Server Workloads
Chris Ramseyer was a senior contributing editor for Tom's Hardware. He tested and reviewed consumer storage.
-
Rookie_MIB Nothing wrong with focusing on having an appliance do it's primary task (storage) and do it well. Most people will set up a NAS device and just leave it to do it's job silently in a corner or a closet somewhere for a few years.Reply
As long as it's capable of performing that job, then I would call it a good product. -
BoredSysAdmin I learned from my mistakes, maybe you should learn from my and don't touch synology (especially in business environment) with a ten foot poleReply
http://www.boredsysadmin.com/2015/10/a-bit-of-insight-into-synology-or-why.html -
HideOut WHy wouldnt you just get a buffalo 441e @ under $200. Its not as powerful but for home users you need nothing more. No home user should be spending over $500 on a bare box. Thats nuts.Reply -
milkod2001 ZyXEL NAS540Reply
With 1.2 GHz dual-core CPU and 1 GB of DDR3 RAM, The two Ethernet LAN ports for under €150 would probably piss all over this.
Would love to see this unit reviewed. By specs and price it looks like really good value for average home user.
