Tigo T-One 240GB Low Cost SSD Review
Why you can trust Tom's Hardware
Mixed Workload And Steady State
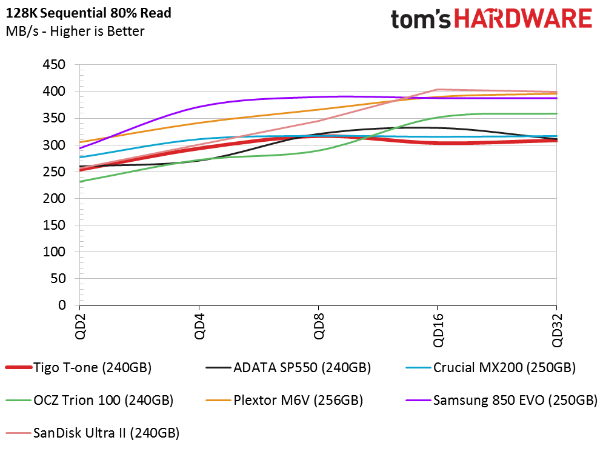
80 Percent Sequential Mixed Workload
Our mixed workload testing is described in detail here, and our steady state tests are described here.
The mixed workload tests give us a clearer picture of real-world application and boot drive performance. Windows and other operating systems read and write small files as you work. It's often possible to observe as many as 200 operations taking place in the background.
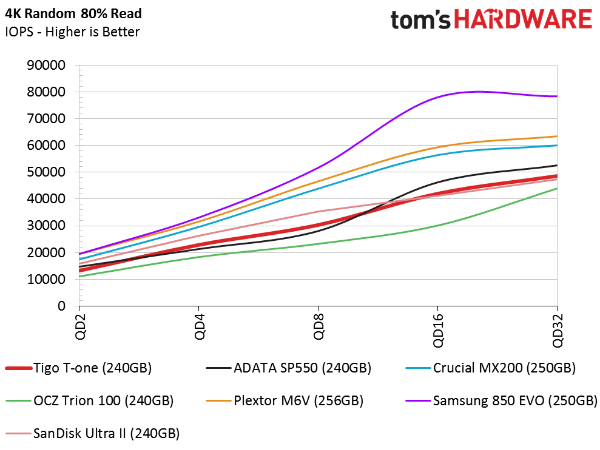
80 Percent Random Mixed Workload
In both the sequential and random mixed workload tests, Tigo's 240GB T-One falls to the bottom of our charts. The company could improve its performance here by increasing the SLC buffer size. That would take away some flash capacity available to you (and the cost is incurred at a 3:1 ratio because it takes 3GB of TLC to equal 1GB of SLC).
Sequential Steady State
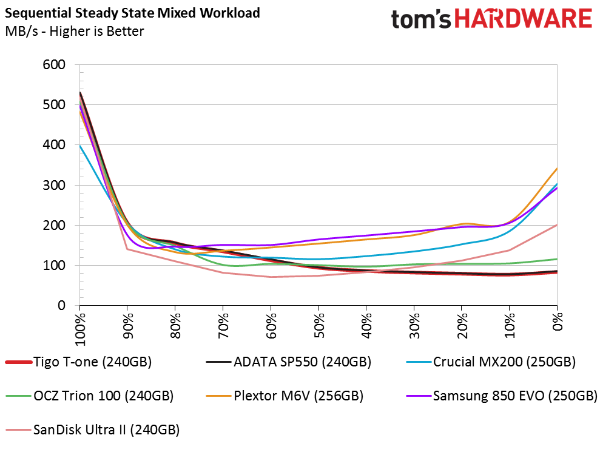
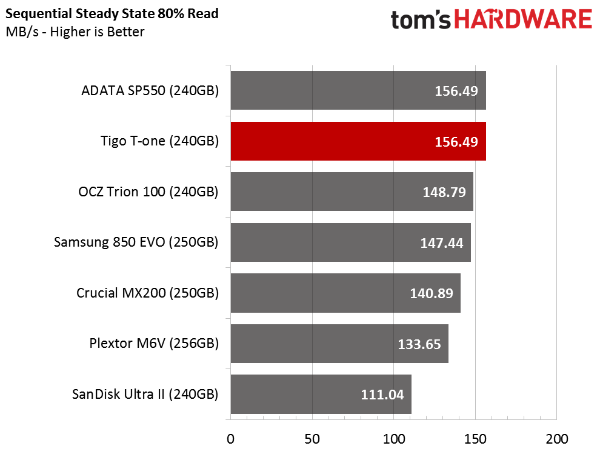
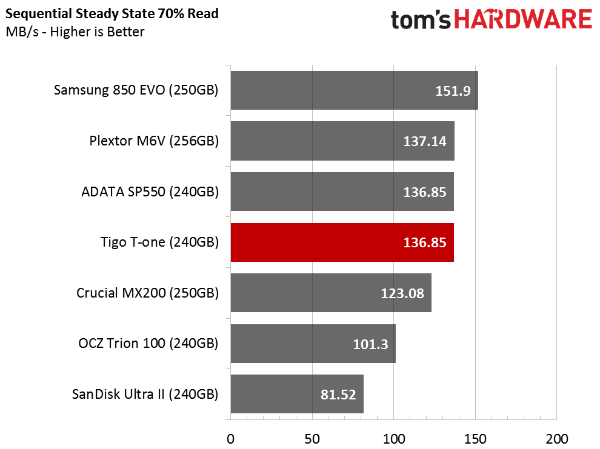
Most desktop users will never tax their SSDs into a steady state condition, but performance will drop as the drive fills up. The same is true if you write a lot of data at one time. The small SLC buffer makes low write performance a certainty.
Random Write Steady State
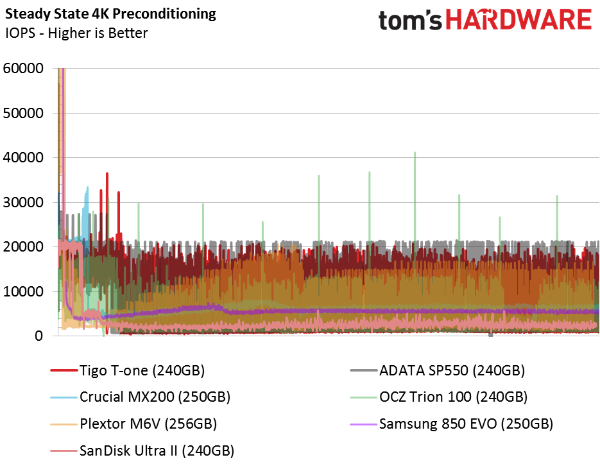
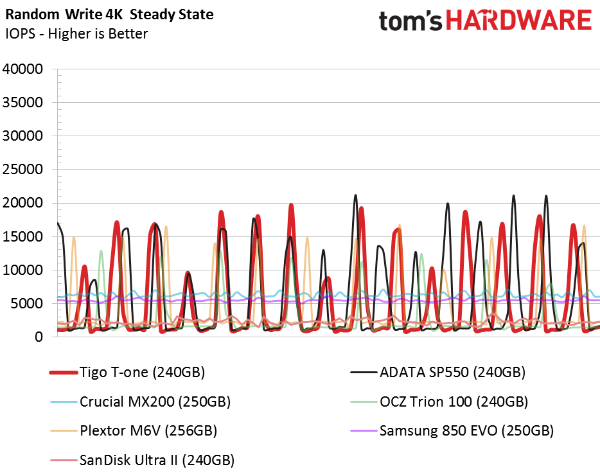
None of the drives in these charts was built for use in a RAID array. We use the random steady state tests to look for products that deliver higher and consistent IOPS results. Dicey numbers compound as drives are added to an array; those are the ones you want to stay away from in RAID.
Get Tom's Hardware's best news and in-depth reviews, straight to your inbox.
Current page: Mixed Workload And Steady State
Prev Page Four-Corner Performance Testing Next Page Real-World Software Performance
Chris Ramseyer was a senior contributing editor for Tom's Hardware. He tested and reviewed consumer storage.
-
James Mason Would have like to see a price to performance chart to compare all the ones tested.Reply -
darcotech The price of Samsung EVO 850 250Gb is 88.67USD not 149.99. And could be probably found even cheaper.Reply
Buying cheap SSD from non established company is big no for me. My data are on it, and I want to feel safe (even if I have backup). -
joex444 Even if you wanted to spend just $61 on a 240GB SSD, there are other options. PNY, AData, and Kingston all offer 240GB SSDs *lower* than $61. These are all companies that have been around for a good amount of time whereas Tigo is a completely unknown company from China, which tends to be a source of lower quality parts compared to S. Korea, Japan, or Taiwan.Reply -
shrapnel_indie Tektronix is an old U.S. company that still exists. I hope the opening statements were about when Tigo started and not them as Tektronix got its start in 1946.Reply
http://www.tek.com/about-us -
RobinEricsson > Tigo is a division of TektronixReply
Tektronix, as in the electronics test and measurement tool company (http://www.tek.com/ )? Are you sure about that?
It doesn't seem that computer memory and oscilloscopes are closely related. Plus the website of Tektronix's parent company, Danaher, doesn't list Tigo or its worldwide brand Kimtigo as one of the companies in its portfolio (http://www.danaher.com/our-businesses/business-directory ). -
captaincharisma its like every computer related company in the world is selling its own SSD drives nowReply -
mapesdhs I recently tested a Gloway SSD (a model eBay keeps pushing in its "other items like this" listings), easily one of the worst models I've ever come across, terrible write speeds. Definitely avoid.Reply -
rhysiam Your verdict seems a little scare-mongering and introduces a theme which (unless I've missed it) wasn't addressed anywhere else in the review" "you need to decide if losing data is worth the $20 you saved".Reply
What are you basing that on? Have you got data or theory or at least personal experience to back that up?
That line made me go and read the article, assuming I'd find a story of multiple failed drives during your testing process, but I can't see a single sentence about reliability or data retention in the article (correct me if I'm wrong!) You shouldn't really advise your readers to avoid a drive because it'll lose their data if you haven't actually addressed or supported that assertion in the article itself. -
CRamseyer Here is the deal with reliability. The big names in the industry do no cut corners. Samsung, Intel, Micron/Crucial, SK Hynix, Toshiba and SanDisk are the fab companies. They make the flash and they also get first pick when from the production. These companies also know about features in the memory to enable or disable to increase reliability, performance and so on. Most of the extra switches have to do with the ECC (linked to reliability).Reply
I kill SSDs all of the time. It happens so often that I don't even think about it when it happens. Many of the companies send me early drives to test with pre-release firmware. I would estimate that 2 our of every 5 die during testing. Retail products have a much higher success rate. I may kill one in every 60 or so. My testing goes well beyond what anyone would consider normal use so don't let the high percentage take away from buying a new SSD.
When a product review goes live that isn't the end of my testing. At any time I'm developing 3 to 5 new tests for consideration in SSD or NAS reviews. Every once in awhile you will see one of these tests in a regular review to show a corner case problem.
With that said, it's rare for a fab company SSD to fail. I'm not saying they never fail, just the rate is much lower than products from smaller companies. I have around 300 SSDs (maybe more) dating back to 2007 so we are not talking about a small sample size.
Last but not least, I've been in 4 test labs. Two of the companies were fab companies and two were not. The difference is night and day between what the big names in the industry do compared to what the smaller companies do.
That is not to say that I would never use SSDs from smaller companies. I do use them in my lab but when it comes to systems I keep valuable data on, I use fab company drives. -
wh3resmycar ocz trion 100 goes for like $50 here in the philippines (240gb). i use my ssd for games mainly and considering i have a 100MB connection i can afford to have a broken ssd and redownload my whole librabry in a couple of hours.Reply
