Fast And Cheap? Five Sub-$160 Z87 Motherboards For Enthusiasts
Intel’s Haswell architecture has mainstream leanings. And yet some of the motherboards out there are really high-end. Today we're looking at five platforms under the $160 mark that hopefully put some value back into being an enthusiast.
Power, Heat, And Efficiency
Why you can trust Tom's Hardware
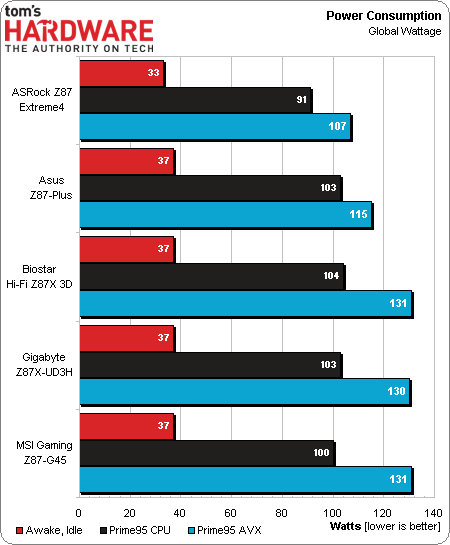
We manually enable power-saving settings on each board before starting the benchmarks. Although the performance numbers came in very close, we tend to look for the power results to match.
In fact, the power consumption differences appear much larger than the benchmark result deltas.
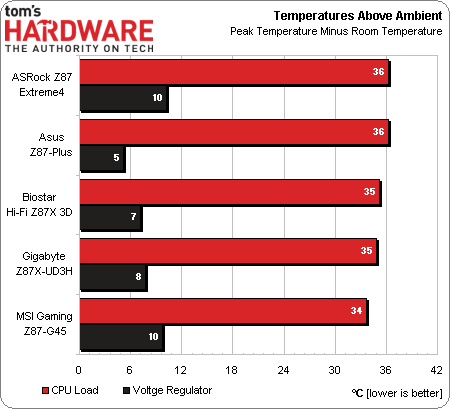
We expect the most miserly motherboards to also have the lowest temperatures, but this isn't true either. ASRock’s Z87 Extreme4 demonstrates the lowest power consumption and the highest temperatures.
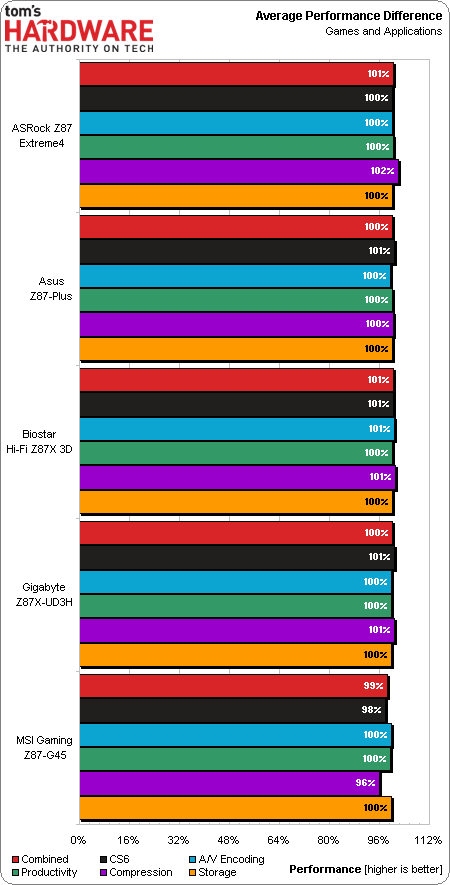
Again, performance differences are minor. MSI’s barely-noticeable losses in a handful of benchmarks nudge its benchmark score to just 1% under average. ASRock’s miniscule overclock likely helps it go 1% over average. Meanwhile, Biostar’s similar 1%-over-average result takes us by surprise.
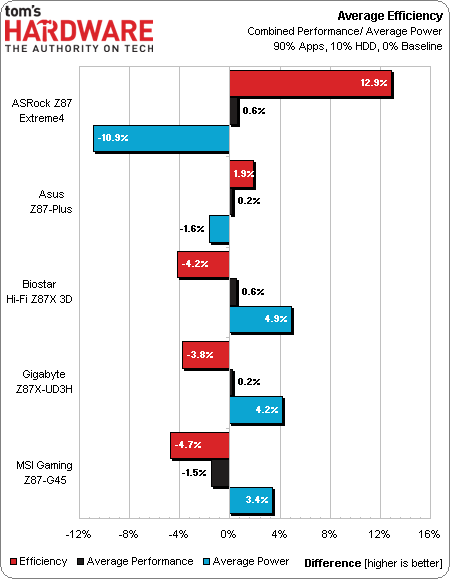
The reason we show performance on an efficiency page is that it’s an easy way to compare work to energy. In this case, the comparison is work over time, so factoring out the time gives the best-performing boards a slightly larger lead. With a difference in computing time of less than 1% over average for each board, the easiest calculations are probably sufficient.
This chart shows that ASRock’s actual performance lead is roughly equal to its overclock. Still, an average power consumption nearly 11% below the average of all five boards allows its Z87 Extreme4 to take top efficiency honors.
Current page: Power, Heat, And Efficiency
Prev Page Results: File Compression Next Page OverclockingGet Tom's Hardware's best news and in-depth reviews, straight to your inbox.
-
InvalidError The sad things about "exposing enthusiast features" on z87:Reply
1- the x8x4x4 PCIe controller is a CPU feature in all i5 and i7. All the z*7 chipset does is unlock the CPU feature
2- same goes for multipliers on K-chips: CPU feature locked out by non-z*7 chipsets
3- SATA-6G ports do not really cost Intel any thing extra to put on-chip (little more than a PLL tweak to lock on faster signals), which makes it somewhat of a shame they aren't fully standard
4- USB3 ports do not cost Intel all that much extra either - maybe an extra square millimeter on silicon to upgrade all remaining USB2 ports to USB3
5- the DMI bus can only manage ~20Gbps so it will bottleneck if you attempt to use even 1/5th the total the connectivity available on z87
More connectivity, yes. But DMI lacks the muscle to actually stress that extra IO. As such, it is little more than a glorified SATA port replicator and USB hub.
I almost exclusively use Intel CPUs but it still annoys me how Intel charges extra for trivial things or unlock stuff they arbitrarily locked out just because they can. -
Crashman Reply
It still saves motherboard makers a lot of money when they don't need to add all those controllers. And it frees up some of those x1 slots. Remember that most users don't use "everything at once" to fill up the DMI, so having the x1 slots available rather than consumed by onboard devices adds flexibility to a build.11349374 said:The sad things about "exposing enthusiast features" on z87:
1- the x8x4x4 PCIe controller is a CPU feature in all i5 and i7. All the z*7 chipset does is unlock the CPU feature
2- same goes for multipliers on K-chips: CPU feature locked out by non-z*7 chipsets
3- SATA-6G ports do not really cost Intel any thing extra to put on-chip (little more than a PLL tweak to lock on faster signals), which makes it somewhat of a shame they aren't fully standard
4- USB3 ports do not cost Intel all that much extra either - maybe an extra square millimeter on silicon to upgrade all remaining USB2 ports to USB3
5- the DMI bus can only manage ~20Gbps so it will bottleneck if you attempt to use even 1/5th the total the connectivity available on z87
More connectivity, yes. But DMI lacks the muscle to actually stress that extra IO. As such, it is little more than a glorified SATA port replicator and USB hub.
I almost exclusively use Intel CPUs but it still annoys me how Intel charges extra for trivial things or unlock stuff they arbitrarily locked out just because they can.
In other words, they might be charging for stuff that should be free or should have been included all the way back in the Z68, but past omission doesn't negate current usefullness.
-
DookieDraws I am planning a new Haswell build, soon, and I really appreciate the the effort put into this review. Very helpful!Reply
The market is flooded with tons of these Z87 motherboards and it can be very overwhelming researching them. So, hopefully we'll see a few more Z87 reviews from you guys, soon.
Would also like to see some powerful i7 builds built around more energy efficient components. That would be very interesting. Hint. :) -
Novuake Yeah, I would not be caught dead with a Biostar board. Booo... Interesting that the G45 did not overclock to well, they are usually not the best OCers due to low cost VRMs, thought this would change with Haswell. Hmmm...Reply -
axehead15 I really think that ASRock has taken a lot of steps to put the naysayers to rest. The amount of features that is on these boards for the cost is incredible.Reply
Rather surprised that Biostar had such a good board. Maybe it's time to start considering those boards for future builds. -
JPNpower Can anybody tell me the true difference between the Asus Z87-A and Z-87 plus, without all the marketing hogwash? I'm confused what the difference is. (woth say $15 extra for the plus?)Reply -
vertexx Trying to pick a winner based strictly on the numbers - tough when the measured numbers have been commoditized to the extent they have. Funny to give in on ASRock based on a temporary price break. I think the feature-set vs. value helps ASRock stand on it's own. I really think there is a good target audience for each of these boards. Pulling that out would be a great analysis.Reply
It is great to see a round-up of the mainstream boards, though, so thanks! -
InvalidError Reply
Most users don't have enough such devices to fill every port in the first place (how many people need more than two upper-tier SSDs?) but those who might actually "need" and use 6xSATA-6G would be people wanting to do things like RAID0/1/5 with 3-6x SSDs. At 6x SSDs, we would be looking at ~25Gbps peak not counting GbE, USB3 or PCIe devices on the 8x 2.0 lanes.11349464 said:It still saves motherboard makers a lot of money when they don't need to add all those controllers. And it frees up some of those x1 slots. Remember that most users don't use "everything at once" to fill up the DMI, so having the x1 slots available rather than consumed by onboard devices adds flexibility to a build.
Still does not change the fact that the only reason why Intel gets away with charging $10-15 extra for less than $1 worth of features while the DMI bus lacks the bandwidth to properly support them for people who may actually intend to use them is because they have a practical monopoly which allows them to arbitrarily fragment the market so they can artificially inflate prices.
The main reason most people go with z?7 is the overclock unlock for K-chips. That itself is the biggest joke since it is a completely artificial limitation Intel engineered into their products to enforce co-upselling. As shown with the h87 slip-up, the h87 is perfectly capable of managing multipliers on Haswell K-chips when the K-chip lacks the microcode to enforce the z87 unlock "requirement."
I don't bother with overclocking so this does not affect me... but it still annoys me on the basis of principles and general dislike for hair-splitting for profit.


