Thermaltake Toughpower DPS G RGB 1250W PSU Review
Thermaltake recently released a new flagship Titanium-class PSU, the Toughpower DPS G RGB with 1250W max. power. Besides an RGB LED fan, this unit also features high performance, modular cabling, and compatibility with the SPM cloud platform.
Why you can trust Tom's Hardware
Cross-Load Tests And Infrared Images
Our cross-load tests are described in detail here.
To generate the following charts, we set our loaders to auto mode through our custom-made software before trying more than 25,000 possible load combinations with the +12V, 5V and 3.3V rails. The load regulation deviations in each of the charts below were calculated by taking the nominal values of the rails (12V, 5V and 3.3V) as point zero.
Load Regulation Charts


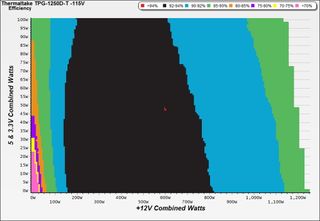
Efficiency Chart

Efficiency is very high; a large part of this chart registers 92%-94%. There's even a small red dot in the middle where efficiency exceeds 94%.
Ripple Charts


Infrared Images
We removed the top cover and applied 660W load for about 12 minutes before taking some photos of the PSU with our modified FLIR E4 camera, which delivers 320x240 IR resolution (76,800 pixels).


The temperature inside the PSU stays low, even though we applied 53% of its maximum-rated capacity load for quite a while with the fan removed. We only noticed high temperatures on a DC-DC converter that handles one of the minor rails. The operating temperatures of the bridge rectifiers, the APFC's components, the primary switchers, and the +12V FETs stay normal. This is a highly efficient Titanium-class power supply, so thermal loads are kept low.
Current page: Cross-Load Tests And Infrared Images
Prev Page Protection Features Next Page Transient Response TestsStay on the Cutting Edge
Join the experts who read Tom's Hardware for the inside track on enthusiast PC tech news — and have for over 25 years. We'll send breaking news and in-depth reviews of CPUs, GPUs, AI, maker hardware and more straight to your inbox.
Aris Mpitziopoulos is a Contributing Editor at Tom's Hardware US, covering PSUs.
-
GPUEnthusiast I think those cables look straight ugly with three colors like that. In a windowed case, you won't even notice they're sleeved and it will instead look like an old style power supply with the rainbow wires, just really thick. I think they should stick with black and red, or just black. That yellow is faded too much and looks like it's for a banana themed build.Reply -
g-unit1111 Maybe it's me but I fail to grasp how an RGB ring on a PSU adds to it. Especially since most cases have bottom-mounted PSUs these days.Reply -
jimmysmitty Reply18420891 said:Maybe it's me but I fail to grasp how an RGB ring on a PSU adds to it. Especially since most cases have bottom-mounted PSUs these days.
It's all about them ground effects brah!!!!!
I agree though. Unless you have a very open bottom, most do not since most have a dust filter, it wont really show. I would expect a LED logo instead. -
turkey3_scratch This is a really great power supply! The transient response performance is top-notch. I really like it. The only thing I wish is for it to be a multirail design.Reply -
basroil Almost something I could recommend, if not for that horrible double line frequency oscillation in the 12V. I would have expected a digitally controlled system to be able to remove simple harmonics like that. Perhaps their controller algorithm isn't all that great?Reply -
powernod I was anxiously expecting this review due to CWT's new CST platform.Reply
Just like Aris said at the end of his review, i'm expecting to see how the smaller wattage models will perform.
The 1250 watt model seems like an excellent unit, and the only thing i disliked is the small output from the smaller rails ( 20A @5V &3.3V / 15A @5VSB ).
P.S. Once again, an excellent review from Aris!!