Thermaltake Toughpower DPS G RGB 850W PSU Review
In addition to its flagship Titanium line, Thermaltake also equipped the DPS G Gold family with an RGB fan. The highest-capacity model outputting up to 850W is our test subject today.
Why you can trust Tom's Hardware
Efficiency, Temperature, And Noise
Efficiency
Our efficiency testing procedure is detailed here.
Using the results from the previous page, we plotted a chart showing the TPG-0850D-R's efficiency at low loads, and loads from 10 to 110 percent of its maximum-rated capacity.


The TPG-0850D-R only appears in second-to-last place with normal loads. Under light loads, its performance is significantly better. We can point our finger at the CSH LED platform's efficiency, given the competition Thermaltake faces in this price range.
Efficiency At Low Loads
In the following tests, we measure the TPG-0850D-R's efficiency at loads significantly lower than 10 percent of its maximum capacity (the lowest load the 80 PLUS standard measures). The loads we dialed were 20, 40, 60 and 80W. This is important for representing when a PC is idle with power-saving features turned on.
| Test # | 12V | 5V | 3.3V | 5VSB | DC/AC (Watts) | Efficiency | Fan Speed | Fan Noise | PF/AC Volts |
|---|---|---|---|---|---|---|---|---|---|
| 1 | 1.202A | 0.491A | 0.476A | 0.195A | 19.65 | 69.19% | 0 RPM | 0 dB(A) | 0.866 |
| 12.133V | 5.064V | 3.348V | 5.059V | 28.40 | 115.1V | ||||
| 2 | 2.430A | 0.979A | 0.985A | 0.396A | 39.71 | 79.12% | 0 RPM | 0 dB(A) | 0.932 |
| 12.127V | 5.058V | 3.343V | 5.047V | 50.19 | 115.1V | ||||
| 3 | 3.665A | 1.476A | 1.496A | 5.036A | 59.87 | 85.20% | 0 RPM | 0 dB(A) | 0.964 |
| 12.122V | 5.050V | 3.338V | 5.036V | 70.27 | 115.1V | ||||
| 4 | 4.887A | 1.984A | 1.978A | 0.795A | 79.80 | 86.41% | 0 RPM | 0 dB(A) | 0.973 |
| 12.115V | 5.043V | 3.334V | 5.025V | 92.35 | 115.1V |
Efficiency isn't as high as we'd expect from an expensive Gold-rated unit under light loads. With 20W, we don't want to see below 70% readings, while at 40W it'd be nice to see measurements above 80%.
DPSApp Screenshots
You'll find screenshots of the DPSApp software below, which we took under light loads.


Efficiency readings are way off, while the wattage numbers are close to correct for once.
5VSB Efficiency
The ATX specification states that 5VSB standby supply efficiency should be as high as possible, recommending 50 percent or higher efficiency with 100mA of load, 60 percent or higher with 250mA of load, and 70 percent or higher with 1A or more of load.
We take four measurements: one each at 100, 250 and 1000mA, and one with the full load the 5VSB rail can handle.
| Test # | 5VSB | DC/AC (Watts) | Efficiency | PF/AC Volts |
|---|---|---|---|---|
| 1 | 0.101A | 0.51 | 77.27% | 0.064 |
| 5.023V | 0.66 | 115.1V | ||
| 2 | 0.251A | 1.26 | 80.26% | 0.142 |
| 5.018V | 1.57 | 115.1V | ||
| 3 | 1.002A | 5.00 | 81.30% | 0.324 |
| 4.995V | 6.15 | 115.1V | ||
| 4 | 3.002A | 14.80 | 78.60% | 0.434 |
| 4.931V | 18.83 | 115.1V |


Contrary to the unit's overall average efficiency, the 5VSB circuit fares better.
Power Consumption In Idle And Standby
In the table below, you'll find the power consumption and voltage values of all rails (except -12V) when the PSU is idle (powered on, but without any load on its rails), and the power consumption when the PSU is in standby mode (without any load, at 5VSB).
| Mode | 12V | 5V | 3.3V | 5VSB | Watts | PF/AC Volts |
|---|---|---|---|---|---|---|
| Idle | 12.138V | 5.075V | 3.354V | 5.074V | 8.75 | 0.535 |
| 115.1V | ||||||
| Standby | 0.04 | 0.004 | ||||
| 115.1V |


Limited vampire power is to thank for the increased efficiency at 5VSB, especially under light loads.
Fan RPM, Delta Temperature, And Output Noise
Our mixed noise testing is described in detail here.
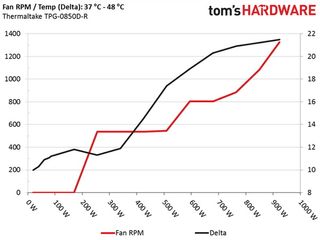
The first chart below illustrates the cooling fan's speed (in RPM), and the delta between input and output temperature. The results were obtained at 37°C (98.6°F) to 48°C (118.4°F) ambient temperature.

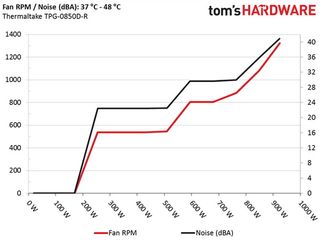
The next chart shows the cooling fan's speed (again, in RPM) and output noise. We measured acoustics from one meter away, inside a small, custom-made anechoic chamber with internals completely covered in sound-proofing material (be quiet! Noise Absorber kit). Background noise inside the chamber was below 18 dB(A) during testing, and the results were obtained with the PSU operating at 37°C (98.6°F) to 48°C (118.4°F) ambient temperature.

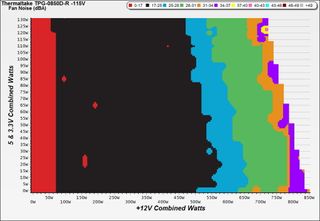
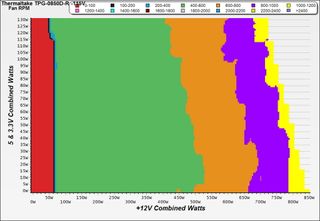
The following graphs illustrate the fan's output noise and speed over the PSU's operating range. The same conditions of the above graph apply to our measurements, though the ambient temperature was between at 28°C (82.4°F) to 30°C (86°F).

The PSU's fan is dead silent with 500 to 550W loads. It starts to spin at higher loads, but remains quiet until the load hits 800W. In general, this is a very quiet PSU that will satisfy enthusiasts who dislike noisy components.

As you can see from the graph above, the fan's speed doesn't exceed 1200 RPM, even in the worst-case scenario. Up to 650W load, the fan stays below 800 RPM.
Current page: Efficiency, Temperature, And Noise
Prev Page Load Regulation, Hold-Up Time, And Inrush Current Next Page Protection Features, EvaluatedStay On the Cutting Edge: Get the Tom's Hardware Newsletter
Join the experts who read Tom's Hardware for the inside track on enthusiast PC tech news — and have for over 25 years. We'll send breaking news and in-depth reviews of CPUs, GPUs, AI, maker hardware and more straight to your inbox.
Aris Mpitziopoulos is a Contributing Editor at Tom's Hardware US, covering PSUs.

Microsoft is switching RAM speed units in Task Manager — finally moving to the more technically correct MT/s

Pre-Memorial Day Sales 2024: Save on gaming laptops, CPUs, monitors and more

Lenovo ThinkPad P1 Gen 7 is the world's first laptop to sport LPCAMM2 memory — more compact, higher performance, lower power
-
powernod -It's not exactly a PSU-related question but more likely a general one.Reply
From the pictures from the monitoring software, i can notice that this software is able to measure CPU and GPU temperature. Do you have any idea if such monitoring is (relatively) accurate?
-Excellent review Aris !! -
Aris_Mp it takes readings from the system's (actually the individual components') sensors. If those are accurate then the software's readings will be accurate as well. Normally they are accurate.Reply -
Nuckles_56 That 12V transient response was certainly interesting, I don't think I've seen one do anything like that beforeReply -
turkey3_scratch Reply18886218 said:That 12V transient response was certainly interesting, I don't think I've seen one do anything like that before
Do what? -
Nuckles_56 Reply18886236 said:18886218 said:That 12V transient response was certainly interesting, I don't think I've seen one do anything like that before
Do what?
Go and plummet back down to almost 0V during the test -
turkey3_scratch Reply18887052 said:18886236 said:18886218 said:That 12V transient response was certainly interesting, I don't think I've seen one do anything like that before
Do what?
Go and plummet back down to almost 0V during the test
I don't think you're reading the transient response graph properly. It's not a measure of voltage but a measure of ripple (well, technically that is a measure of voltage but it's more a measure of instantaneous offsets of an average, or a highly zoomed in sector).
That or I am just missing something. I probably am. Not sure what I'm missing though. Forgive my ignorance. -
Nuckles_56 For this graph http://media.bestofmicro.com/ext/aHR0cDovL21lZGlhLmJlc3RvZm1pY3JvLmNvbS9TLzYvNjIxNzk4L29yaWdpbmFsLzEydl9vZmYuanBn/r_600x450.jpg I hope that I'm not reading it that badly wrongReply -
sparkyman215 Fantastic review Aris! I absolutely love reading in depth articles about anything. Terrible PSU for the price, but it's an awesome review. Congrats!Reply