Phison PS5018-E18 Controller With Micron 176L TLC Preview: Unleashing the Beast
Micron’s 176L TLC propels Phison PS5018-E18 to the upper echelons of PCIe Gen4 performance.
Get Tom's Hardware's best news and in-depth reviews, straight to your inbox.
You are now subscribed
Your newsletter sign-up was successful
Comparison Products
In today’s preview, we put the new B47R sample against some of the best SSDs on the market. This includes the WD Black SN850, Samsung 980 Pro, Gigabyte’s Aorus Gen4 7000s, and Patriot Viper’s VP4300. We also included slightly lower-performing SSDs such as the Silicon Power US70, Samsung’s 970 EVO Plus, and Adata XPG Gammix S50 Lite for good measure.
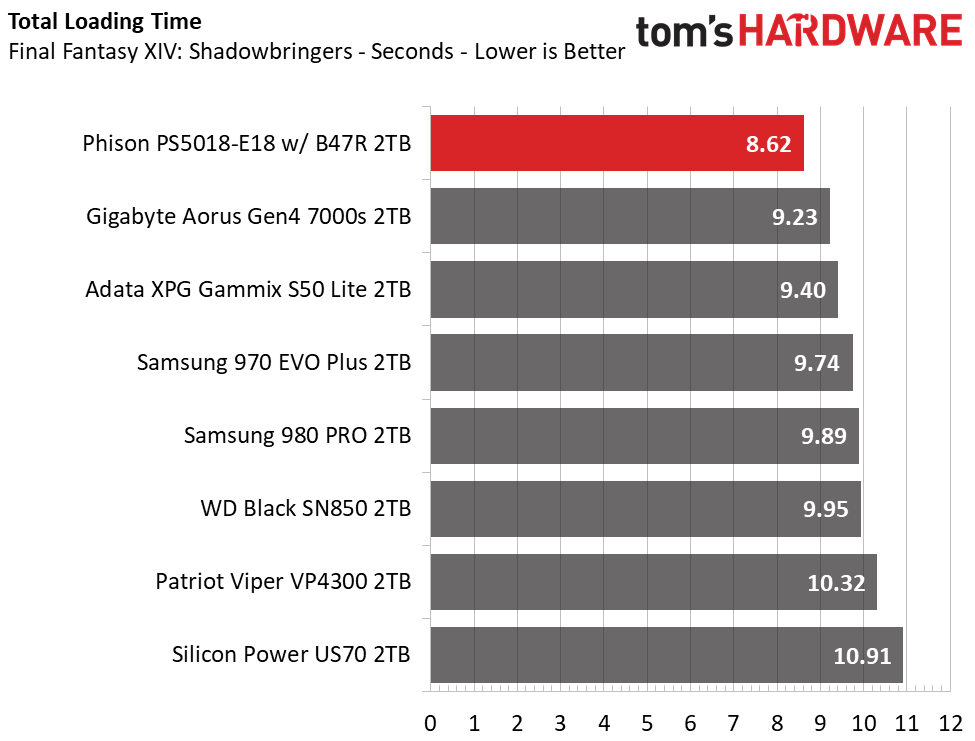
Game Scene Loading - Final Fantasy XIV
Final Fantasy XIV Shadowbringers is a free real-world game benchmark that easily and accurately compares game load times without the inaccuracy of using a stopwatch.
While Phison’s still at work optimizing the E18 for this new B47R flash, game-level load times in the Final Fantasy XIV have already shown significant improvement over the already-tuned Gigabyte Aorus Gen4 7000s with the older B27B 96L flash. This new sample is the fastest drive on the chart.
Transfer Rates – DiskBench
We use the DiskBench storage benchmarking tool to test file transfer performance with a custom dataset. We copy a 50GB dataset including 31,227 files of various types, like pictures, PDFs, and videos to a new folder and then follow-up with a reading test of a newly-written 6.5GB zip file.
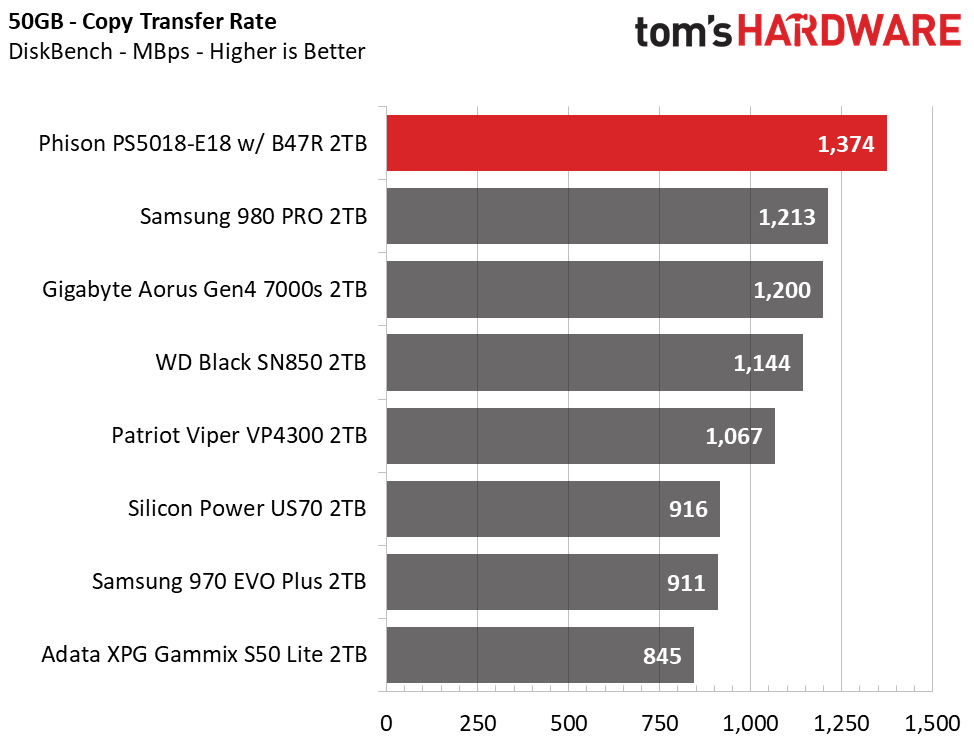
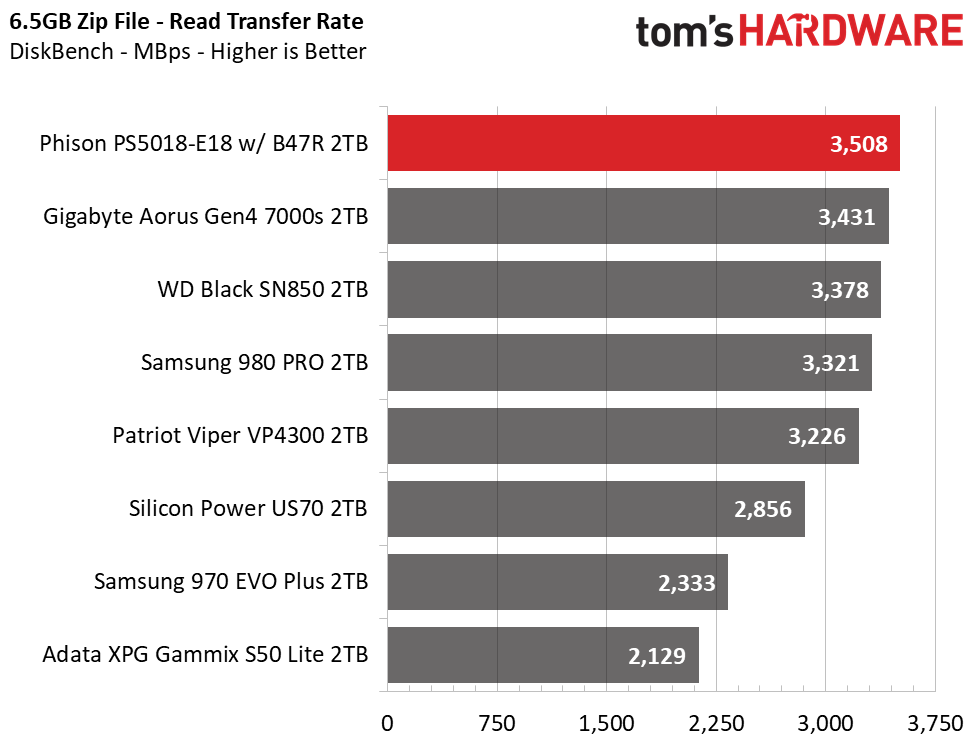
In addition to faster game load performance, the Phison PS5018-E18 takes the crown in our file transfer testing, too. It scores first place in both the file copy and .zip file read test, outpacing both the Samsung 980 Pro and WD _Black SN850, and leaves SSDs like Samsung’s 970 EVO Plus and Adata’s XPG SX Gammix S50 Lite in the dust.
Trace Testing – PCMark 10 Storage Test
PCMark 10 is a trace-based benchmark that uses a wide-ranging set of real-world traces from popular applications and everyday tasks to measure the performance of storage devices. The quick benchmark is more relatable to those who use their PCs for leisure or basic office work, while the full benchmark relates more to power users.
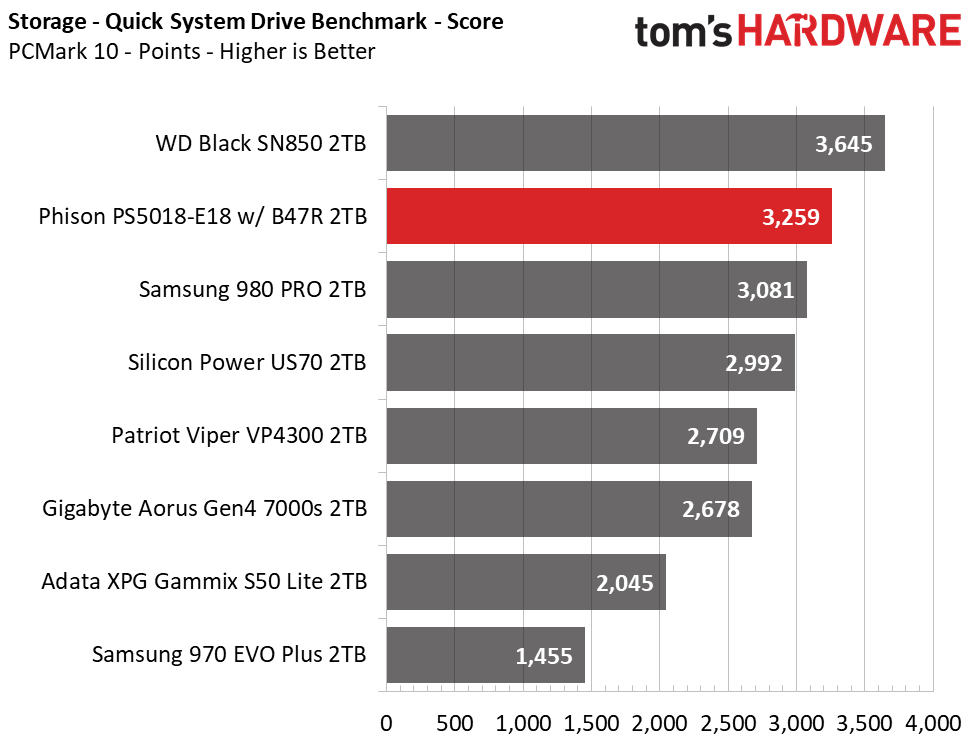
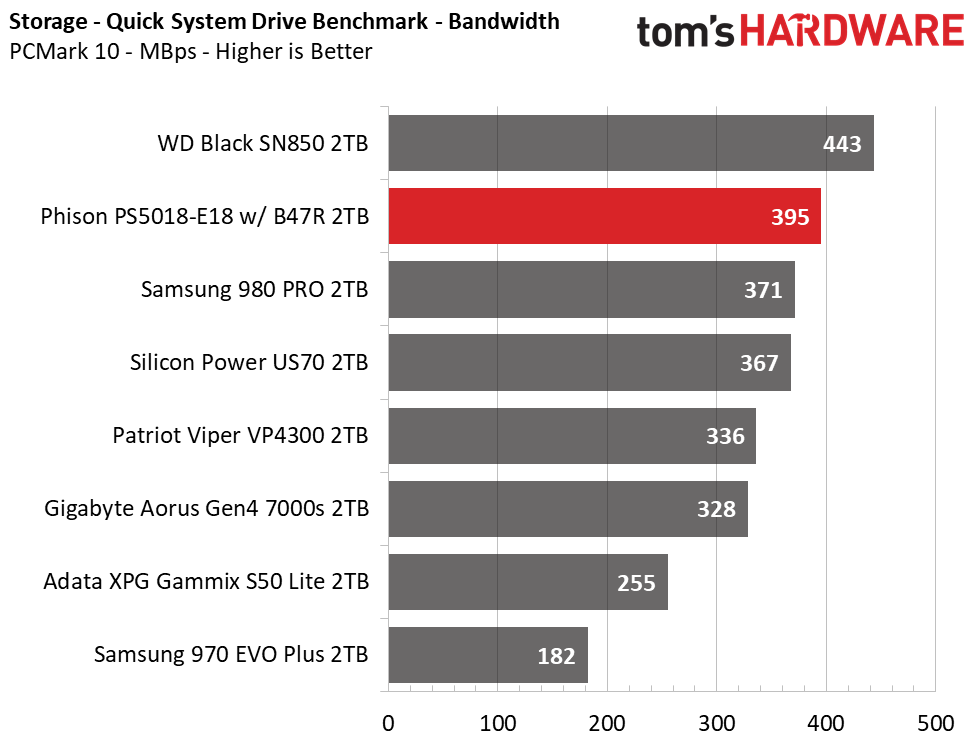
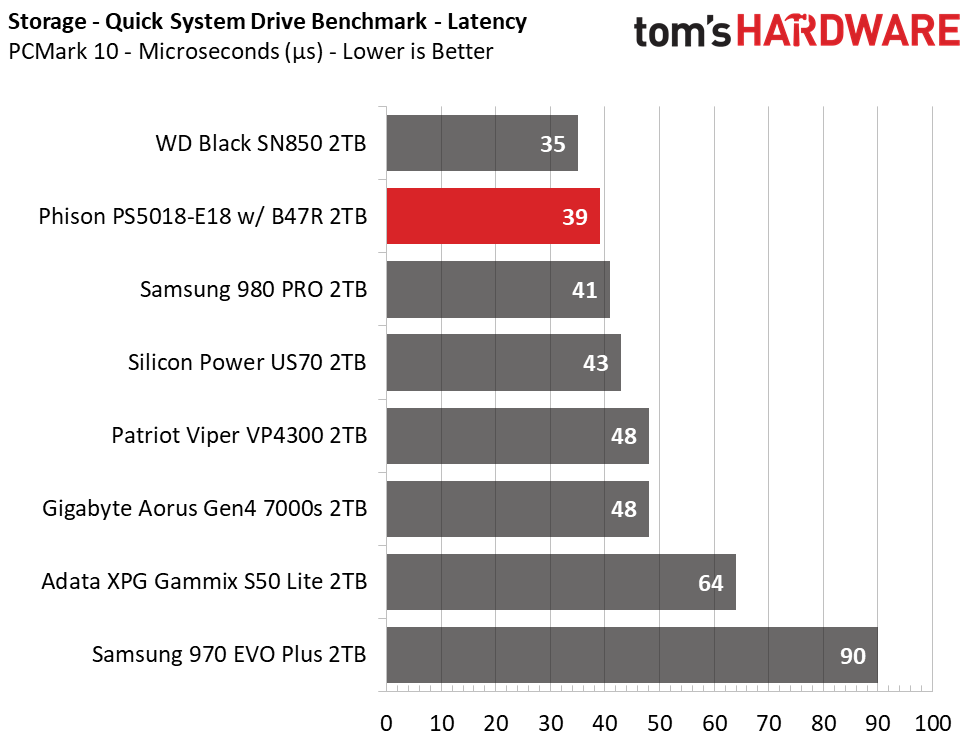
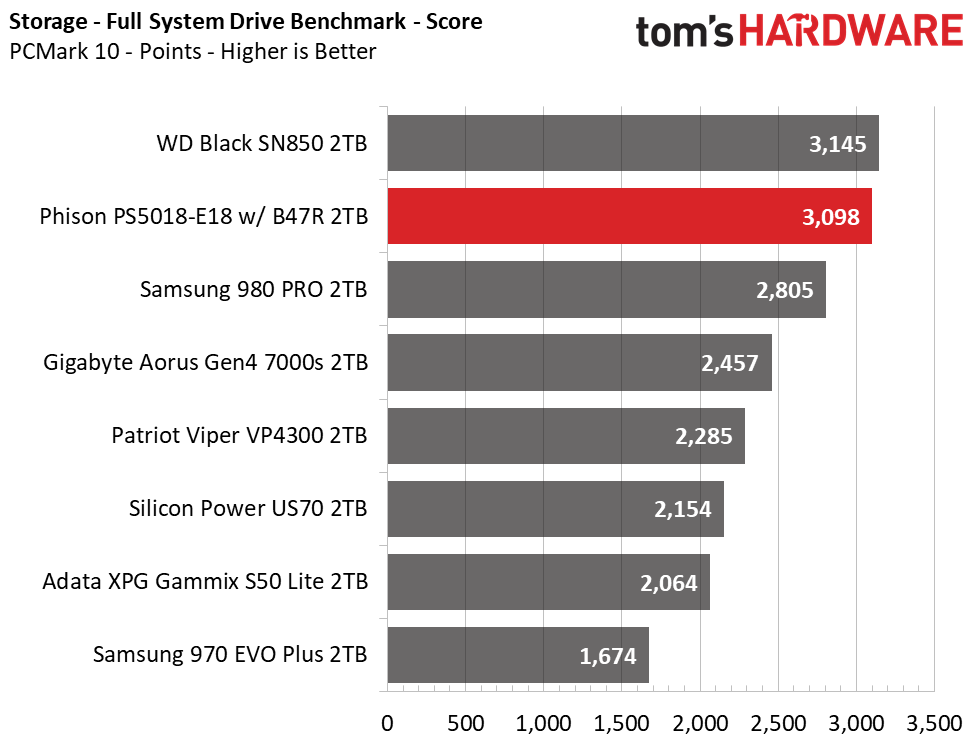
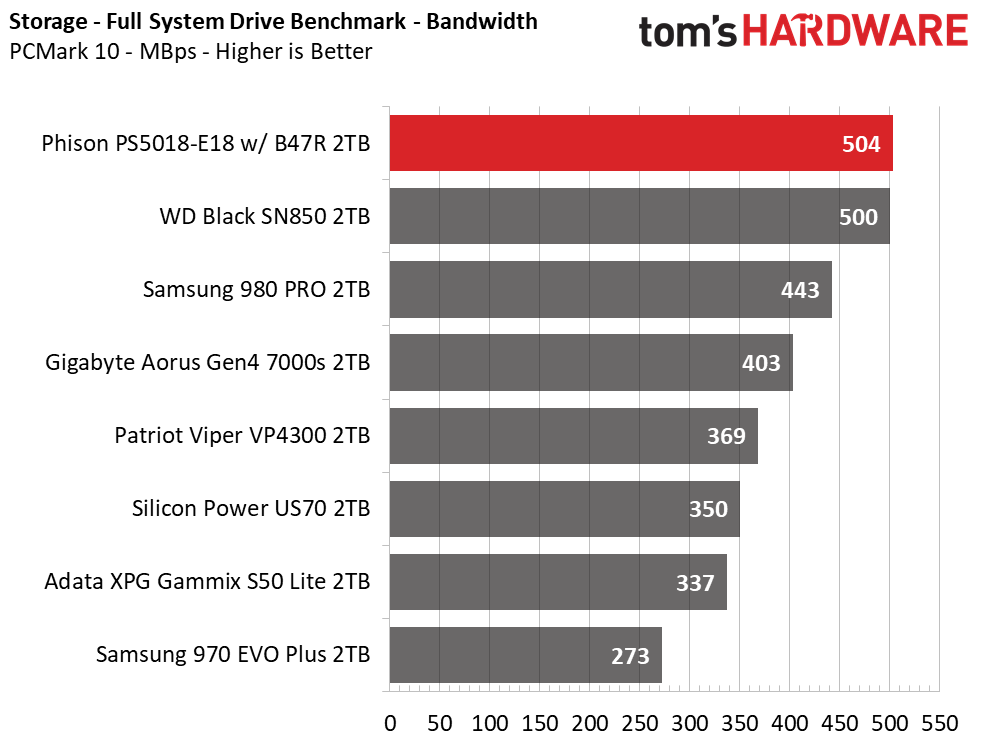
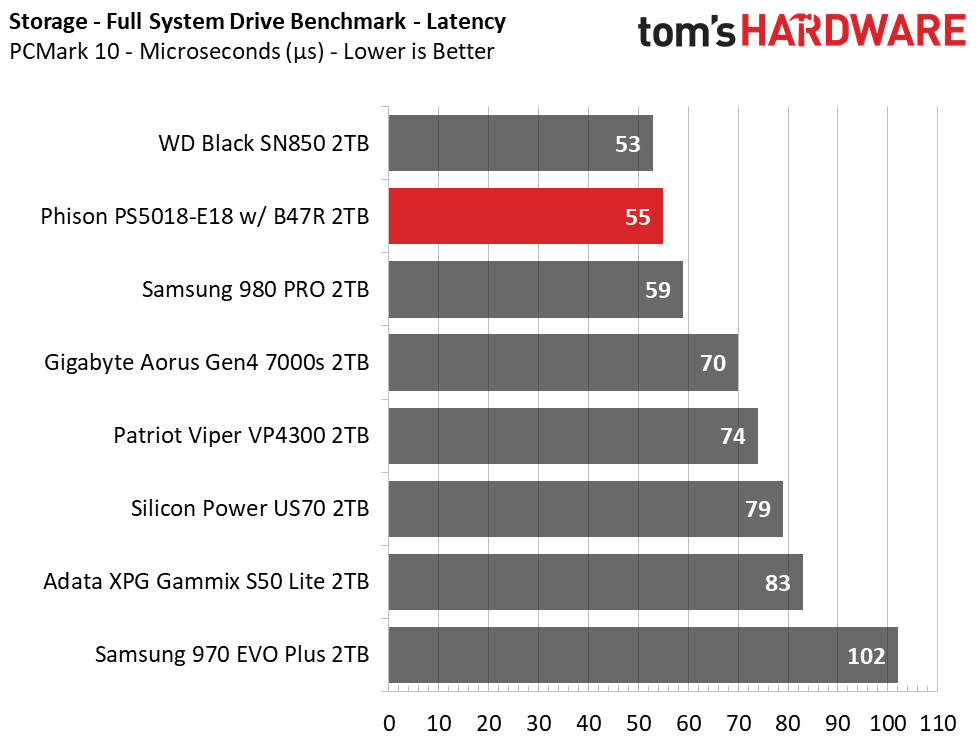
Not only have large file transfers improved, but the faster random access provided by Micron’s 176L TLC propels this new E18 sample to second place in PCMark 10’s workloads. While still trailing the WD_Black SN850, the E18 easily outpaces the Samsung 980 Pro.
Get Tom's Hardware's best news and in-depth reviews, straight to your inbox.
Synthetic Testing - ATTO / iometer
iometer is an advanced and highly configurable storage benchmarking tool while ATTO is a simple and free application that SSD vendors commonly use to assign sequential performance specifications to their products. Both of these tools give us insight into how the device handles different file sizes.
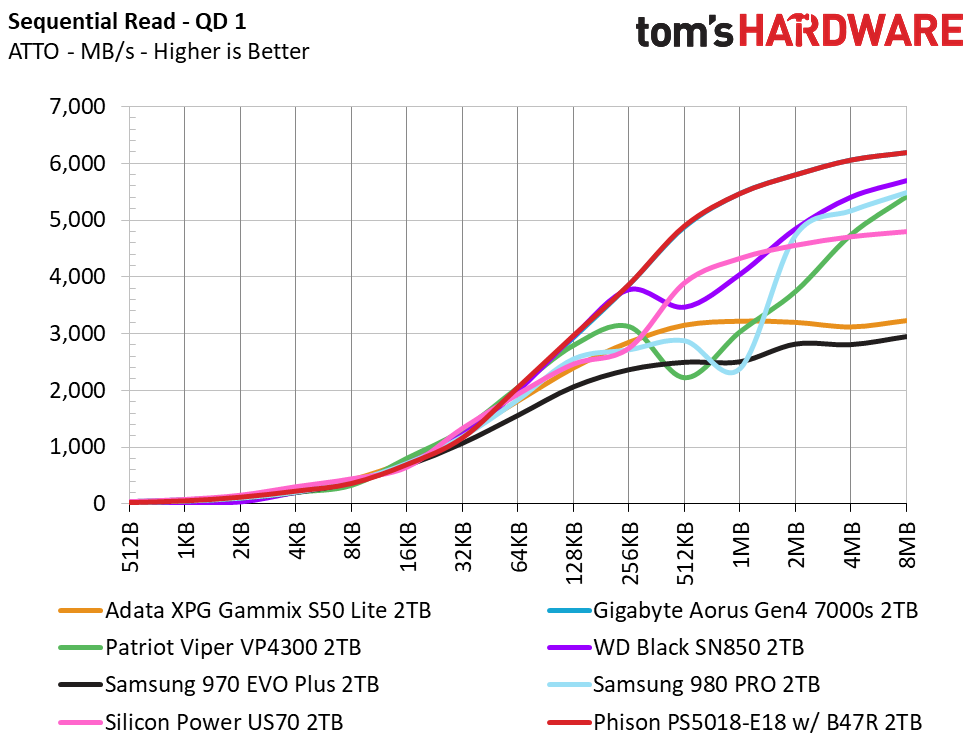
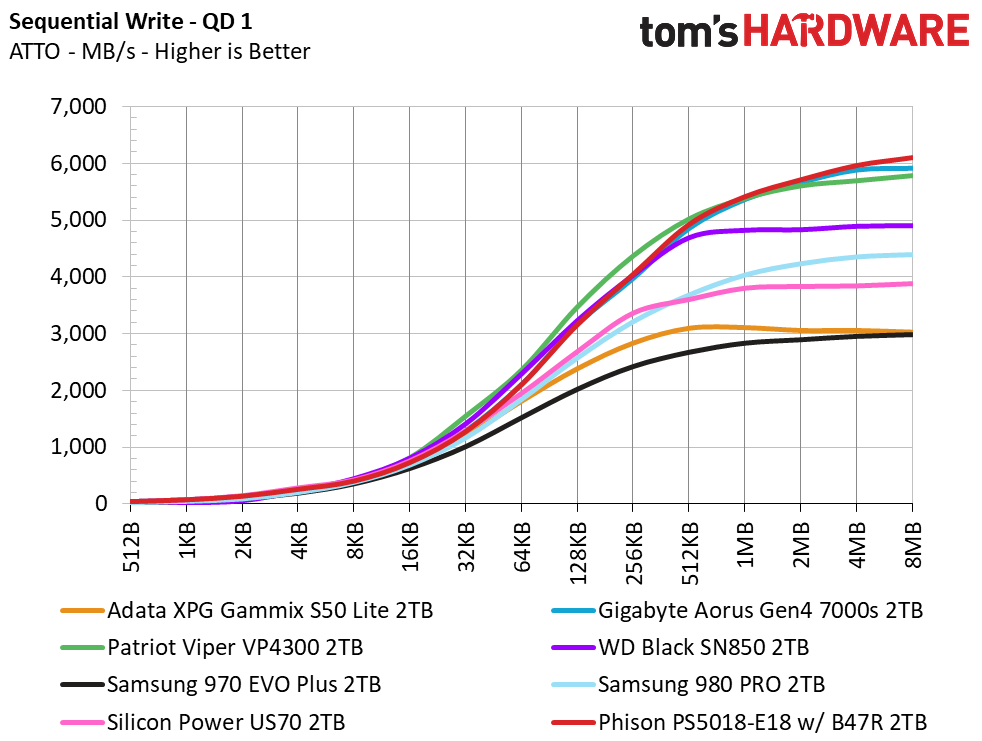
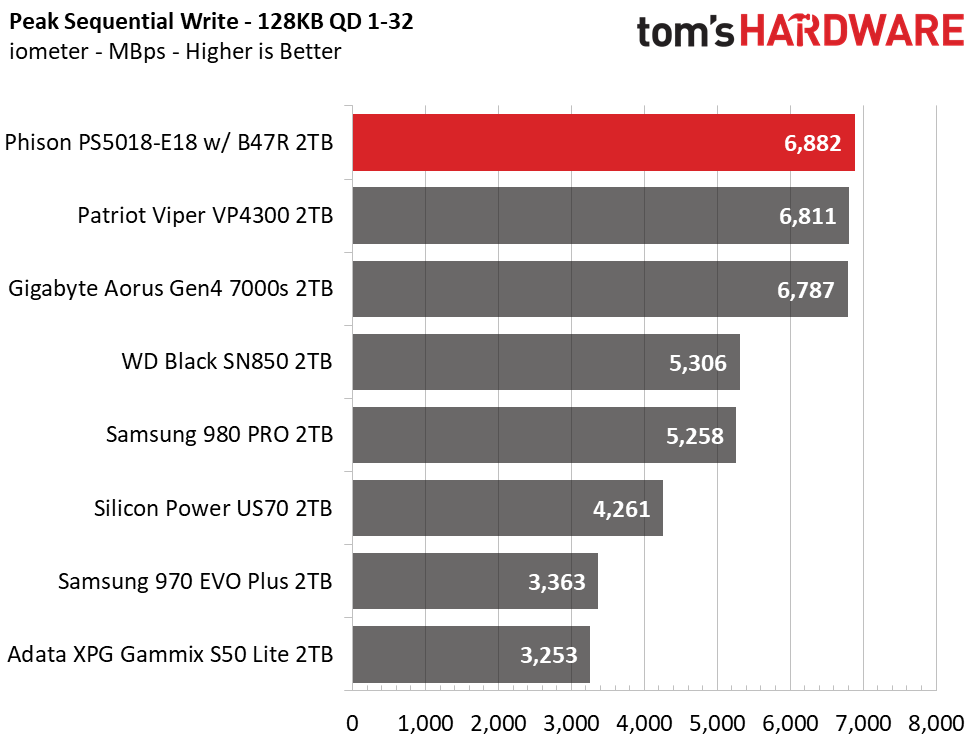
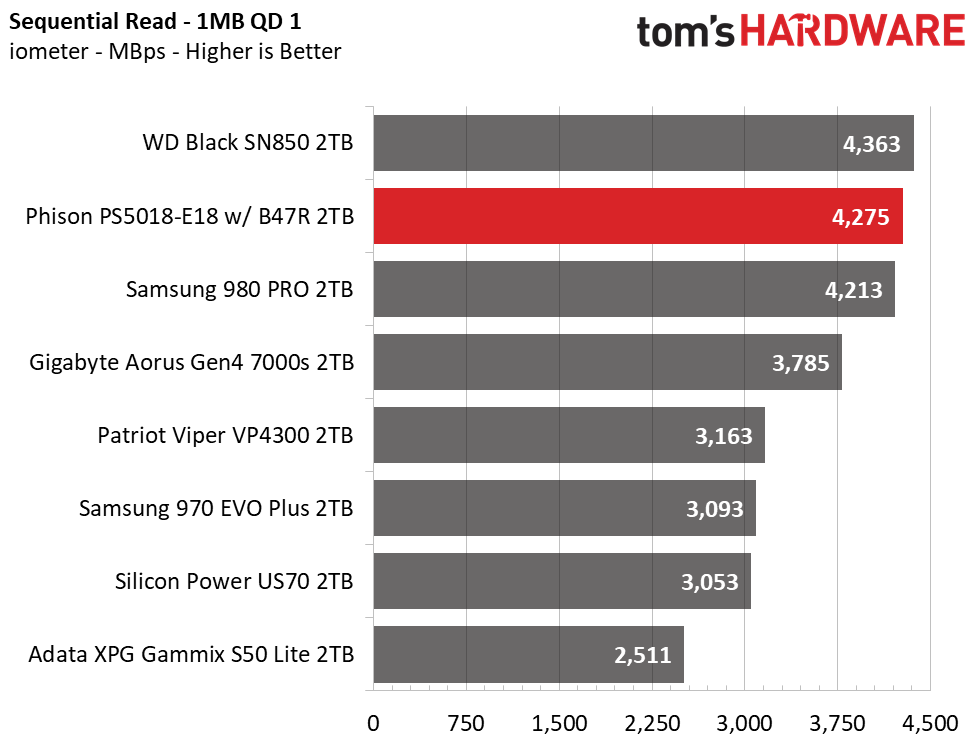
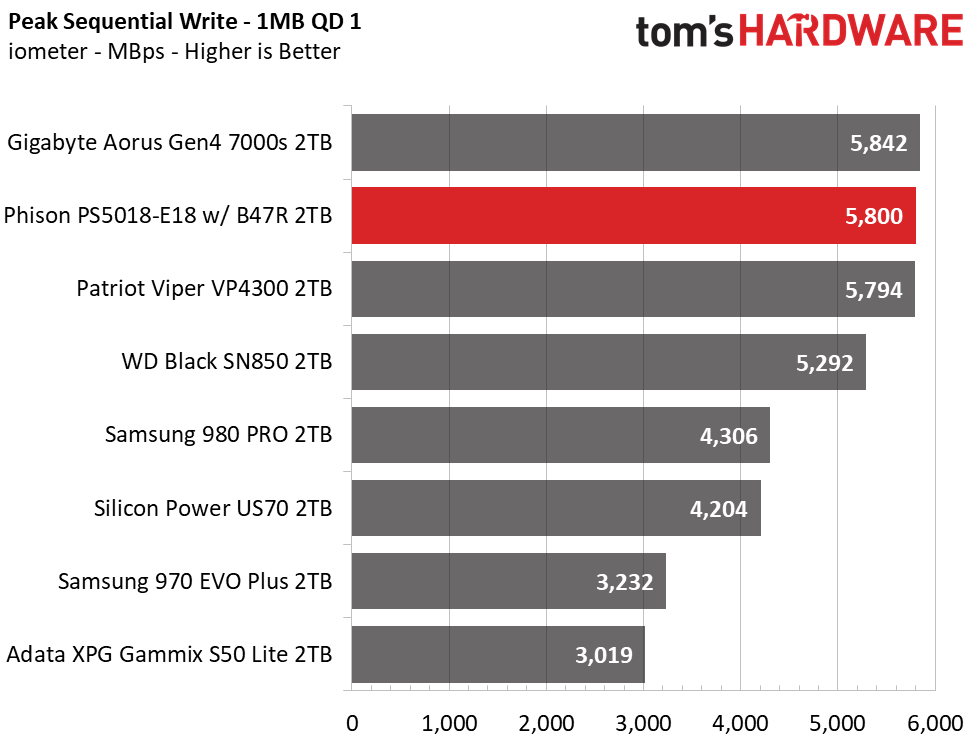
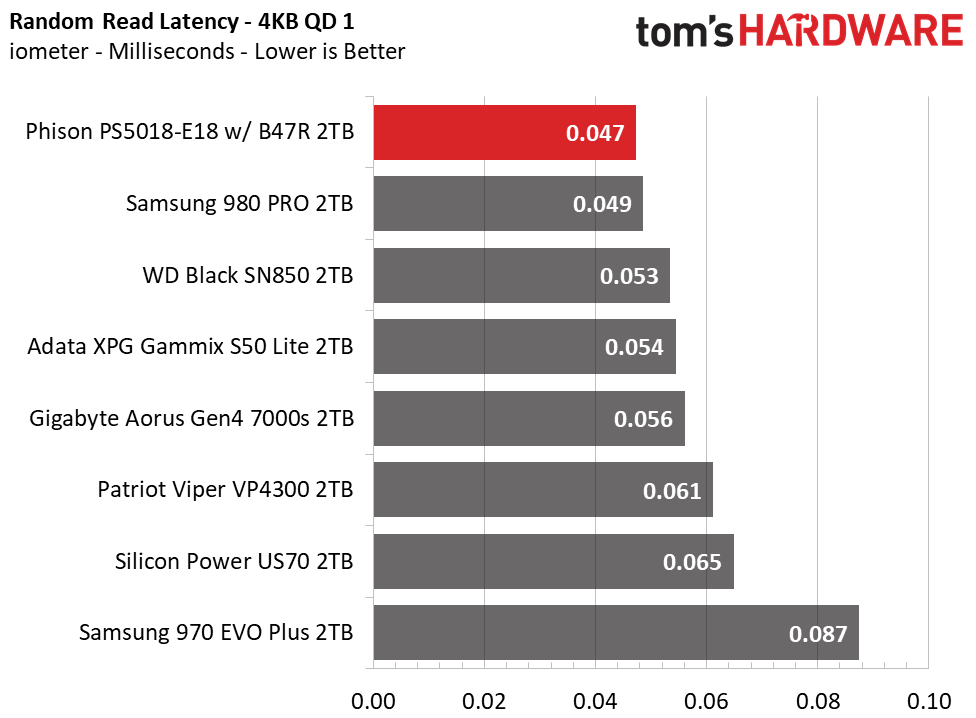
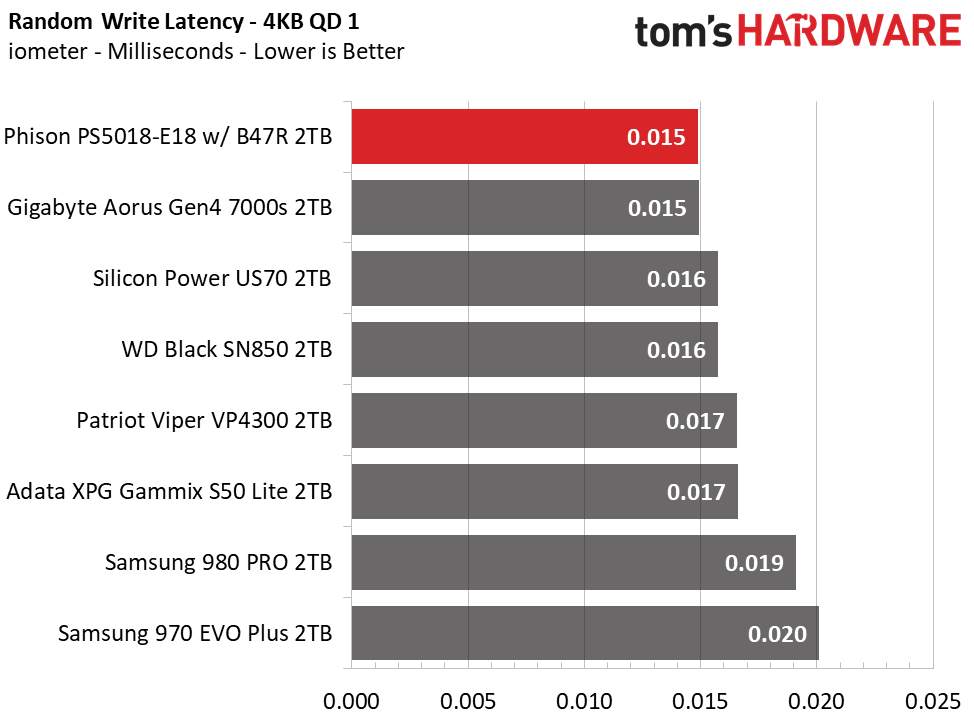
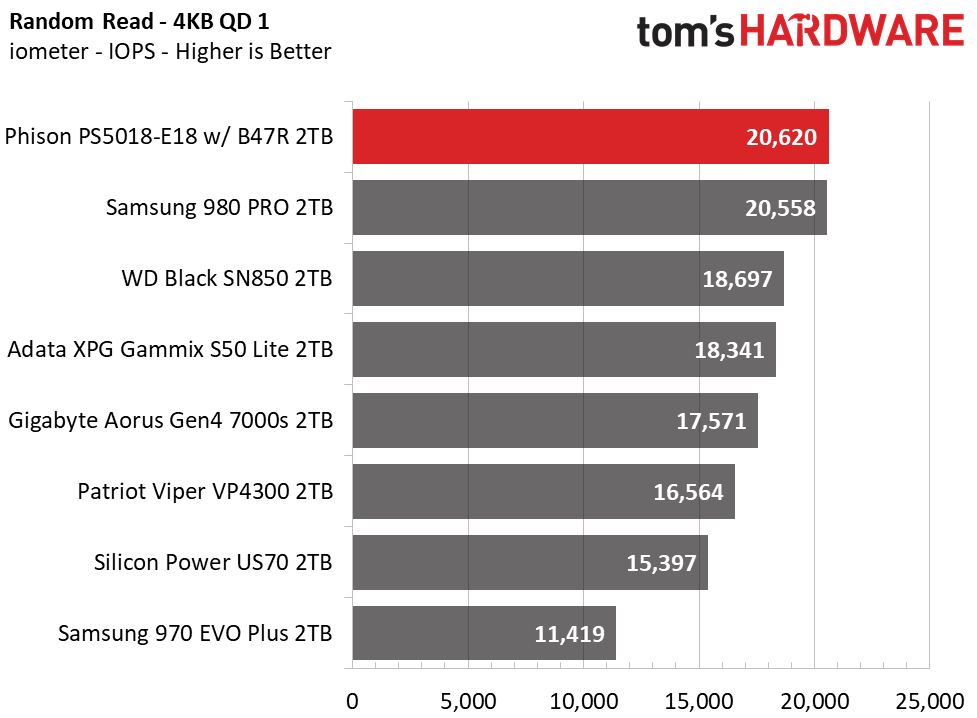
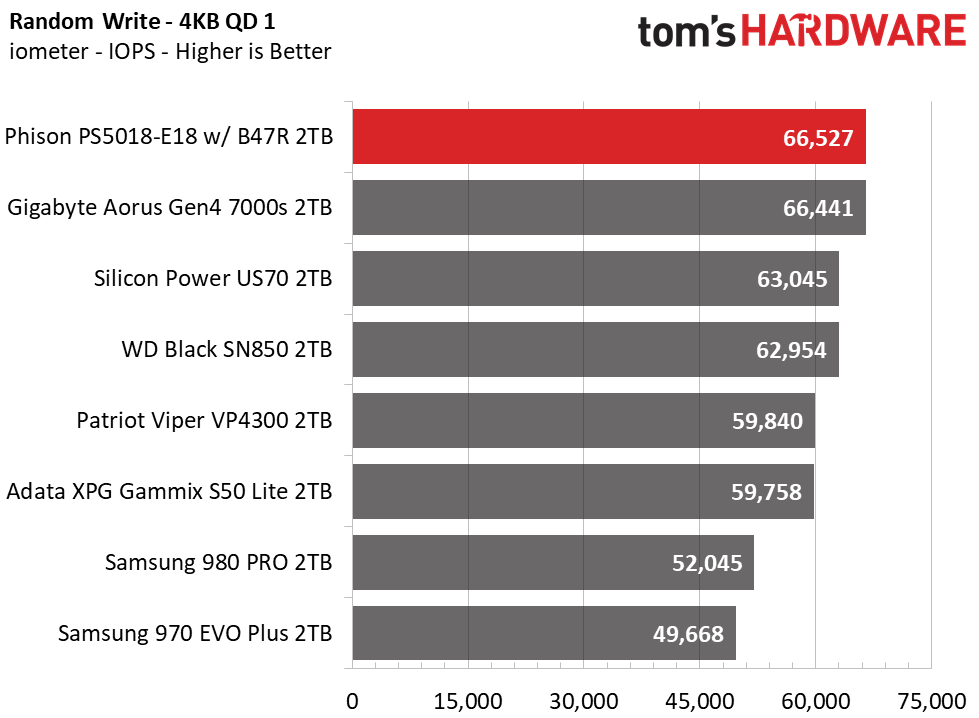
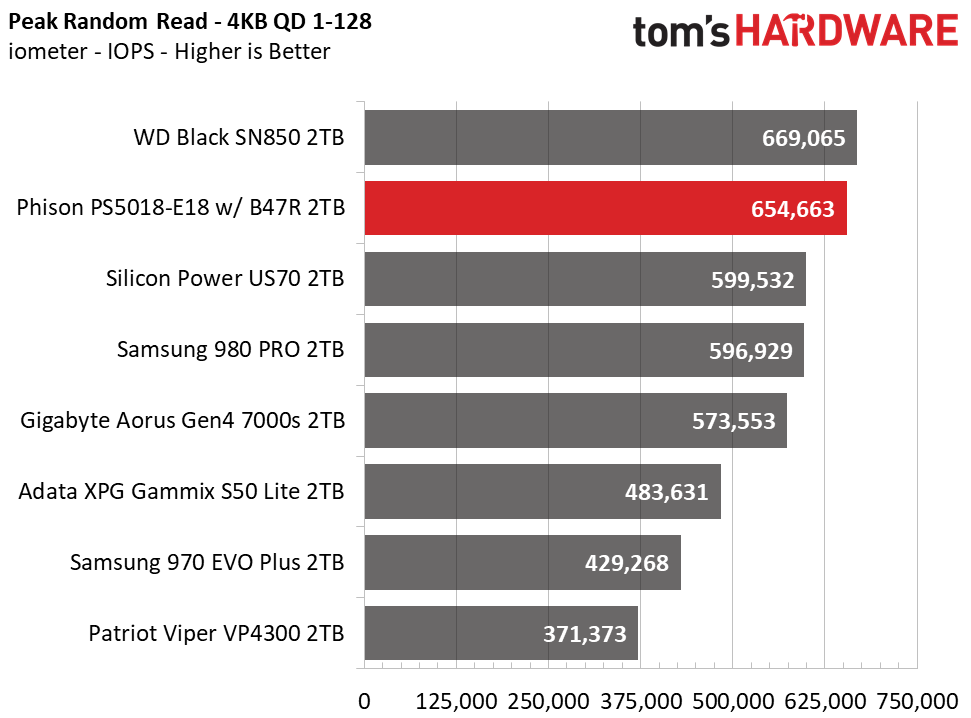
ATTO reveals strong low QD sequential performance and strong scaling across all block sizes, eclipsing both the WD_Black SN850 and Samsung 980 Pro.
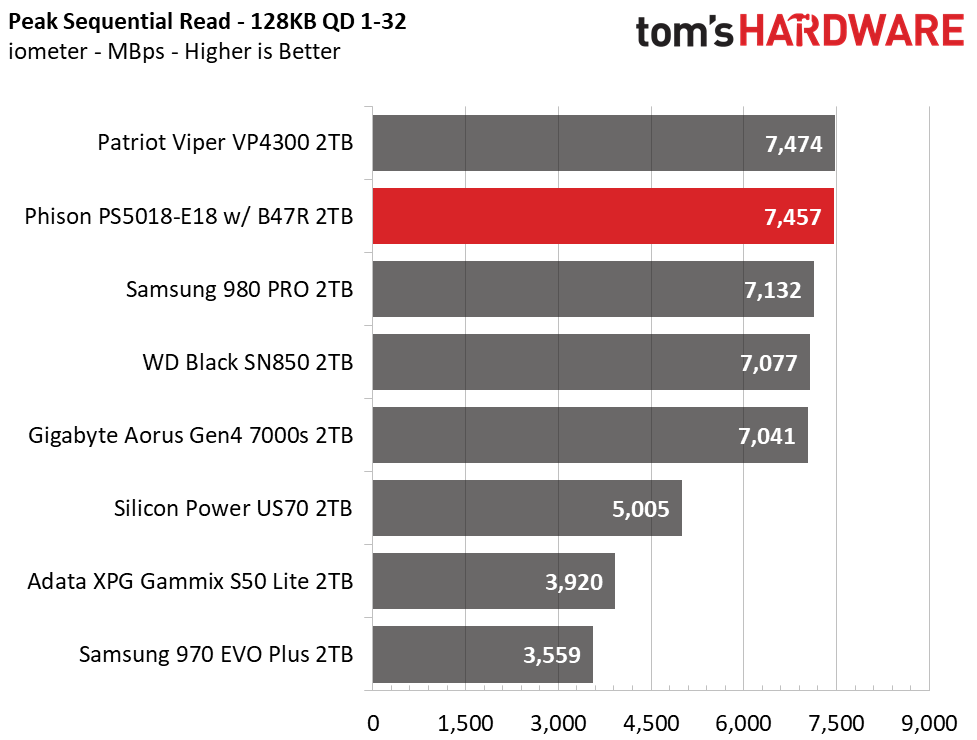
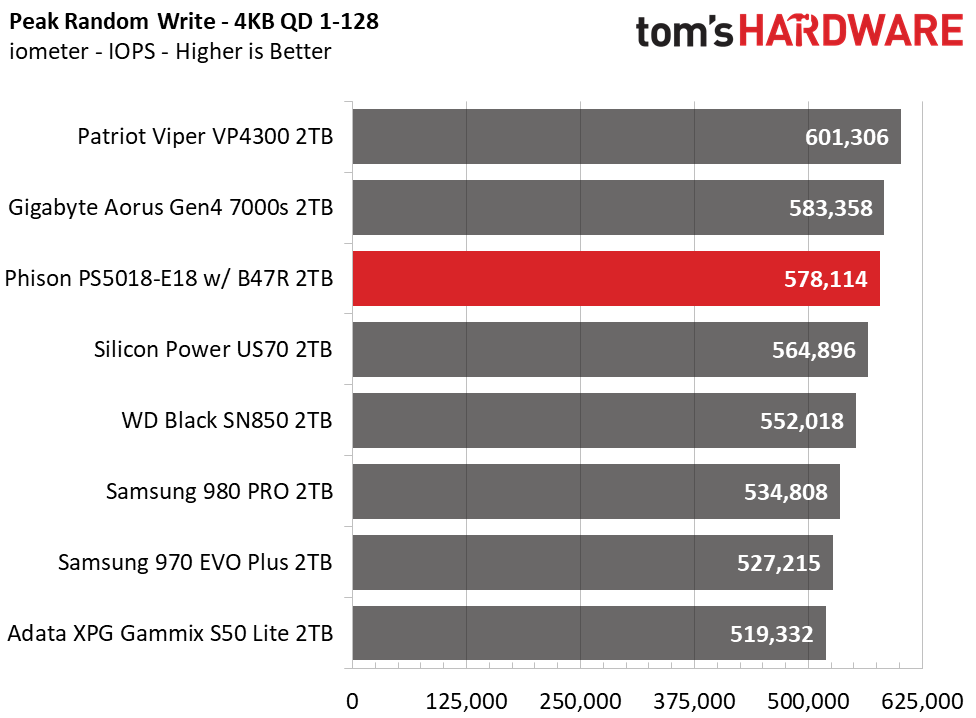
Iometer testing reveals strong results, too. Peak sequential speeds surpassed 7,450/6,850 MBps read/write on our AMD test bench, although we couldn't hit such high figures on our soon-to-be-deployed Intel Rocket Lake test bench. Random read performance is significantly faster than the Gigabyte Aorus Gen4 7000s, surpassing even the Samsung 980 Pro at a queue depth (QD) of 1. However, the WD_Black SN850 led the Phison sample when we intensified the workload to QD128.
Sustained Write Performance & Cache Recovery
Official write specifications are only part of the performance picture. Most SSDs implement a write cache, which is a fast area of (usually) pseudo-SLC programmed flash that absorbs incoming data. Sustained write speeds can suffer tremendously once the workload spills outside of the cache and into the "native" TLC or QLC flash. We use iometer to hammer the SSD with sequential writes for 15 minutes to measure both the size of the write cache and performance after the cache is saturated. We also monitor cache recovery via multiple idle rounds.
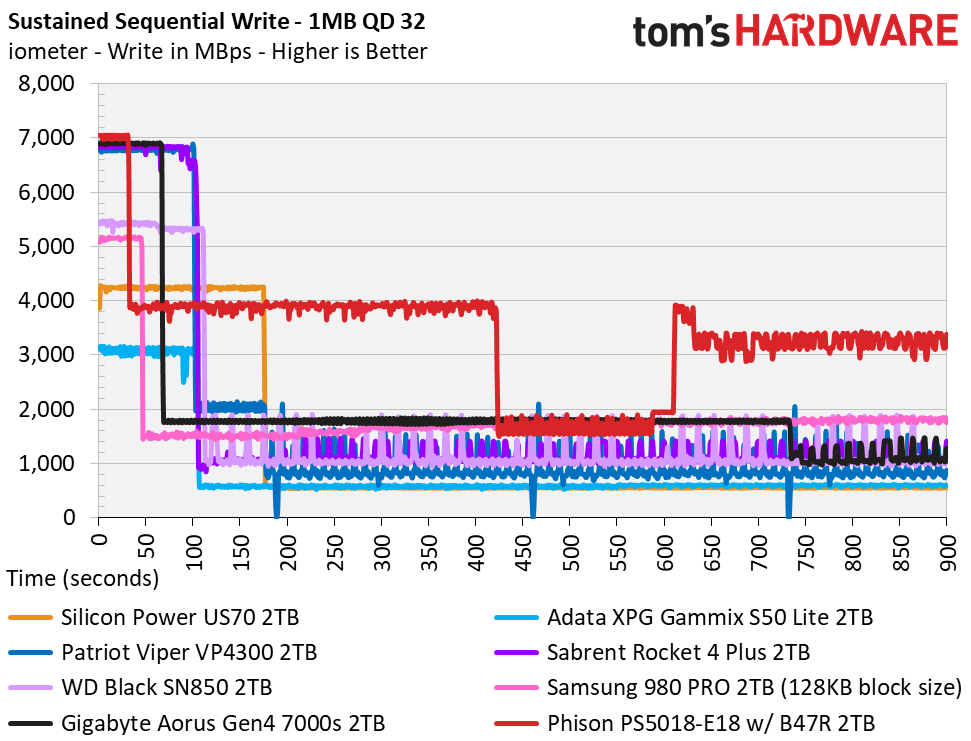
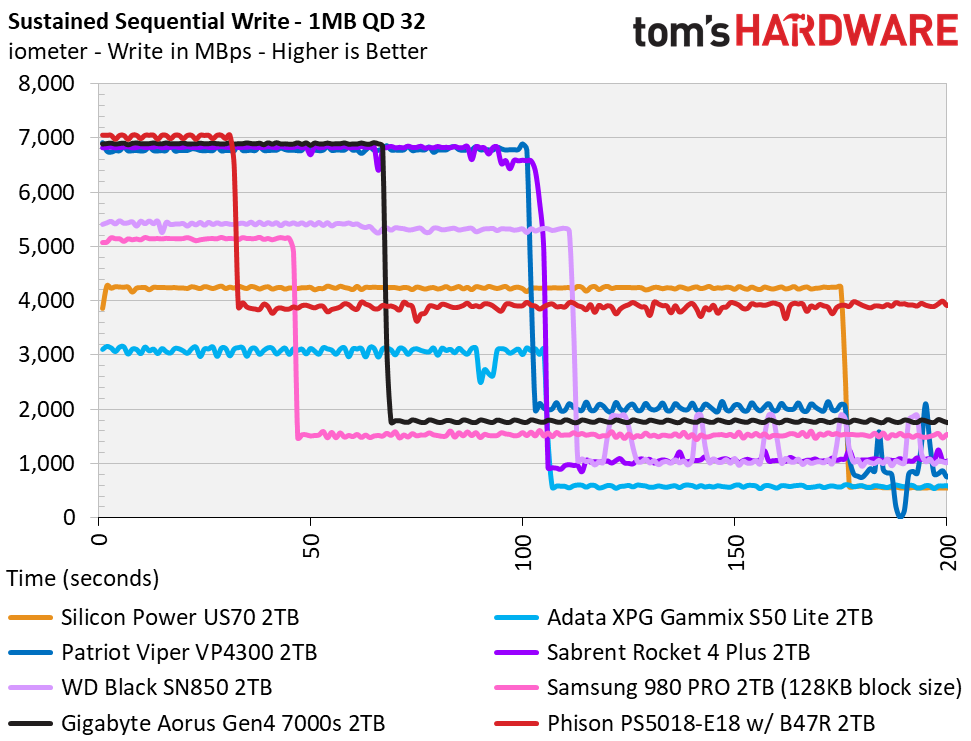
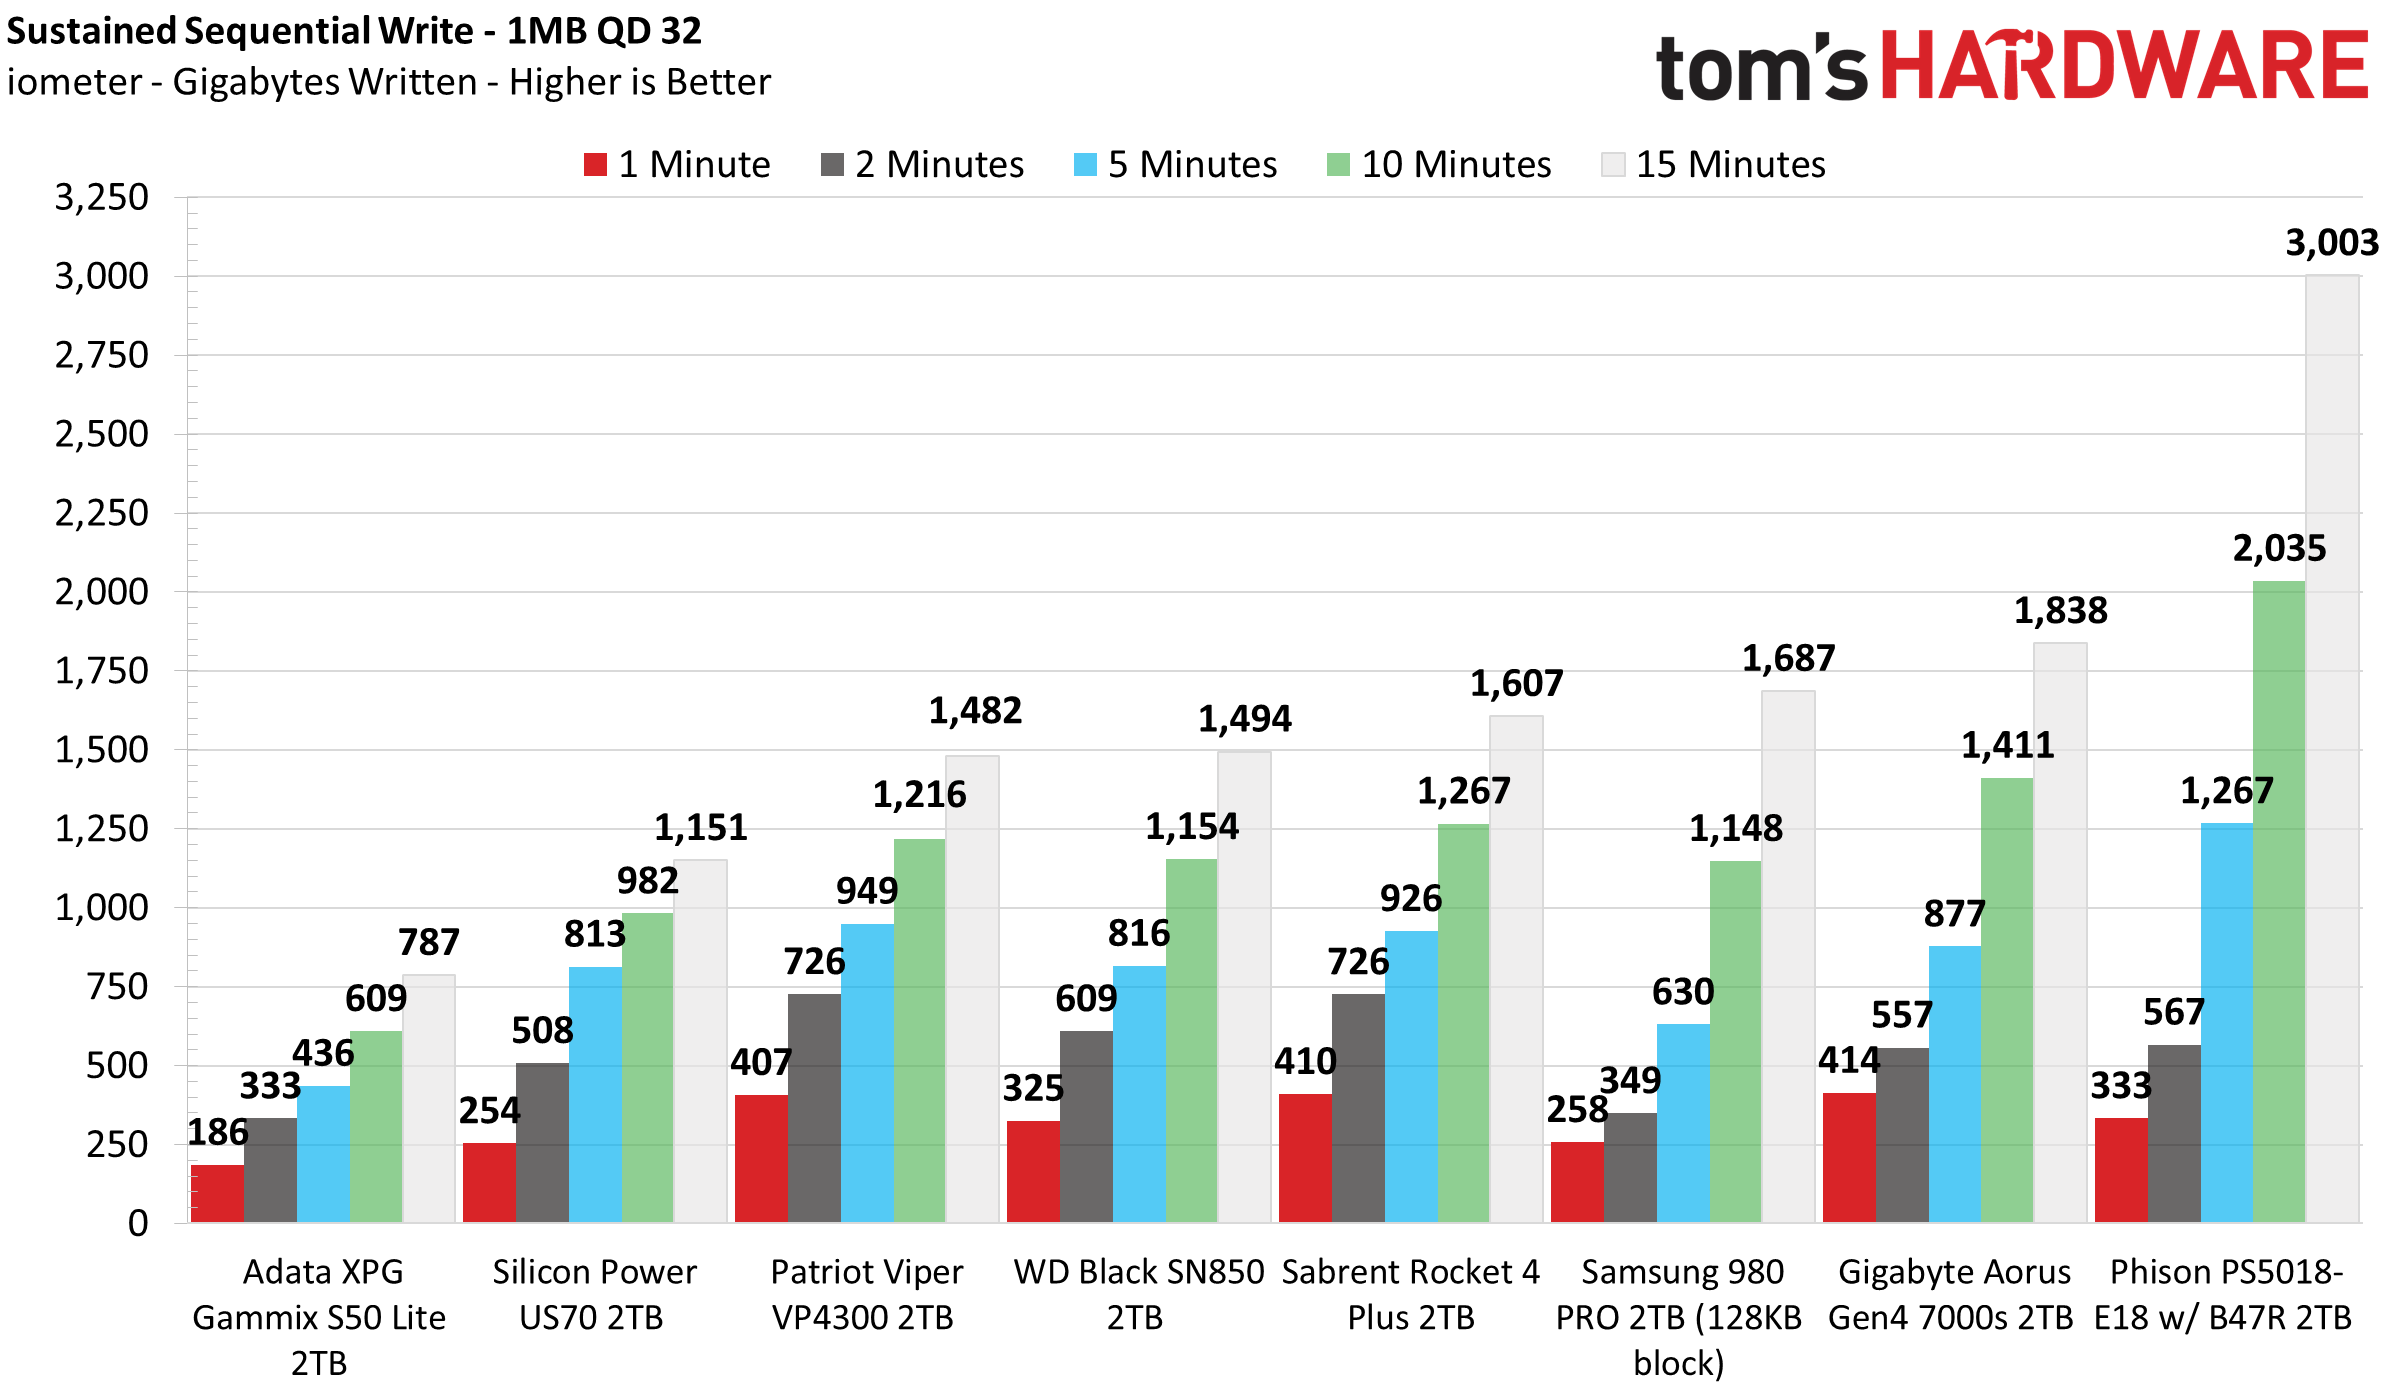
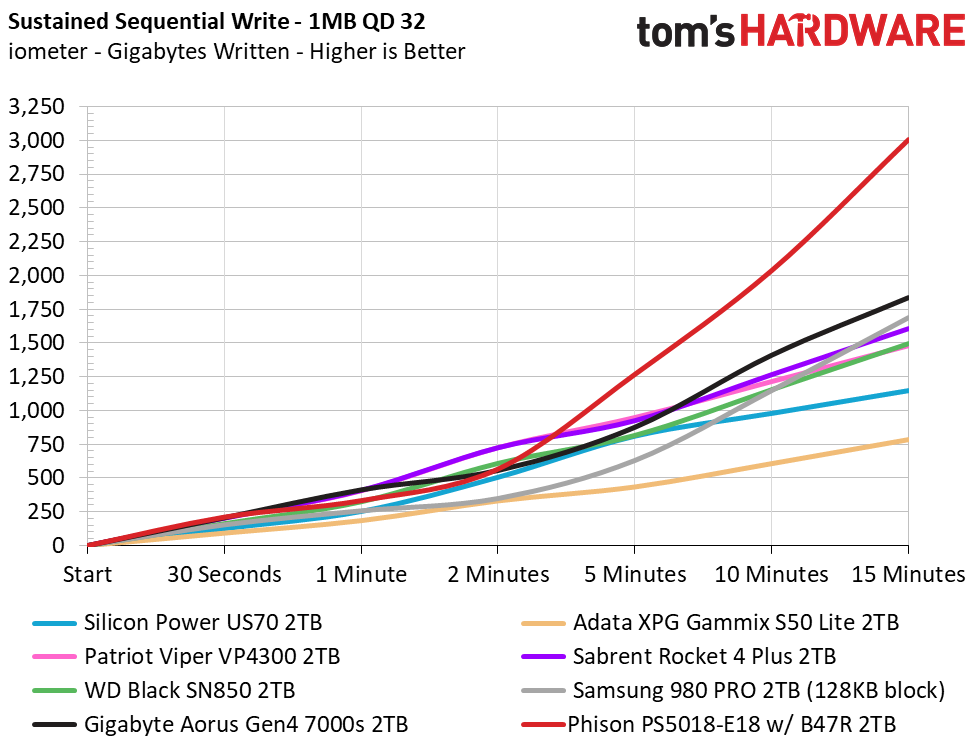
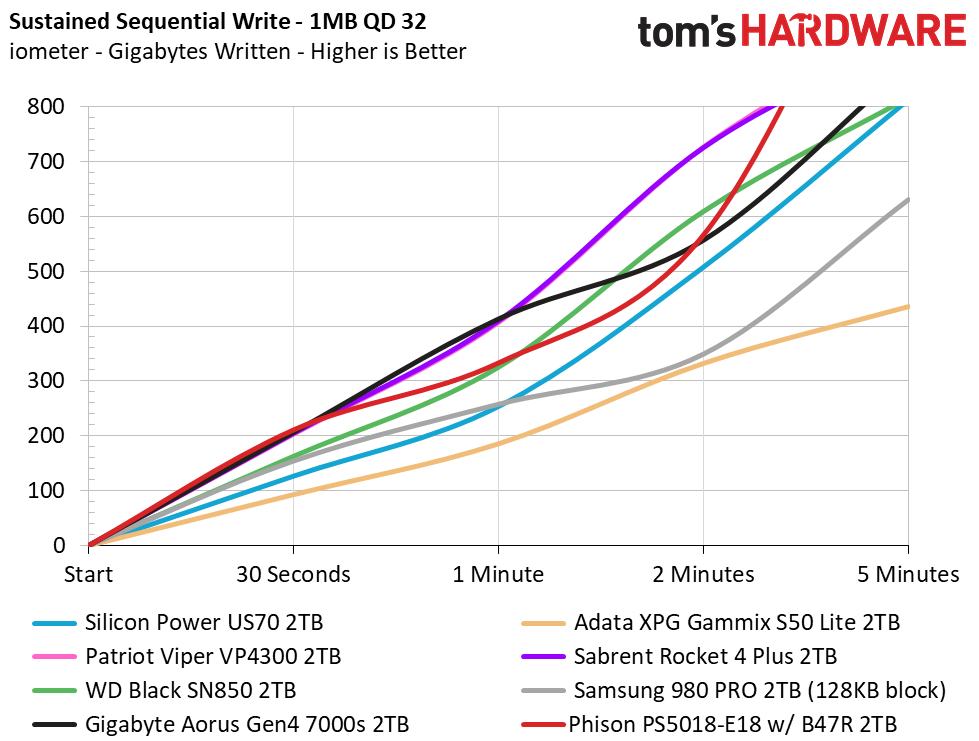
Sustained write performance on the E18 has varied quite a bit over the past few months and it will most likely continue to adapt as the company continues to tweak and tune its firmware. Our sample wrote at 7 GBps for the first 225GB of this test, and then 3.9 GBps on average for an additional 1.5TB of writes. Beyond that, the write speed degraded to roughly 1.6 GBps until full.
During recovery, the E18’s sustained write speed operated at 3.5-3.9 GBps in each of our following idle rounds up to half an hour, meaning full cache speed recovery will take longer.
Power Consumption and Temperature
We use the Quarch HD Programmable Power Module to gain a deeper understanding of power characteristics. Idle power consumption is an important aspect to consider, especially if you're looking for a laptop upgrade. Some SSDs can consume watts of power at idle while better-suited ones sip just milliwatts. Average workload power consumption and max consumption are two other aspects of power consumption, but performance-per-watt is more important. A drive might consume more power during any given workload, but accomplishing a task faster allows the drive to drop into an idle state more quickly, ultimately saving energy.
We also monitor the drive’s temperature via the S.M.A.R.T. data and an IR thermometer to see when (or if) thermal throttling kicks in and how it impacts performance. Bear in mind that results will vary based on the workload and ambient air temperature.
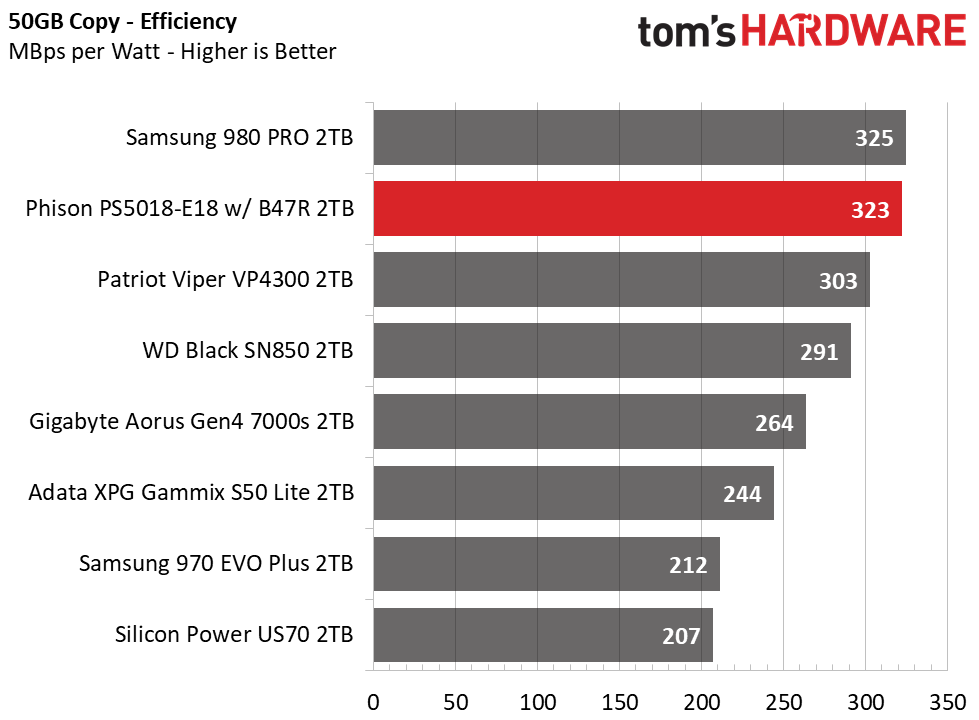
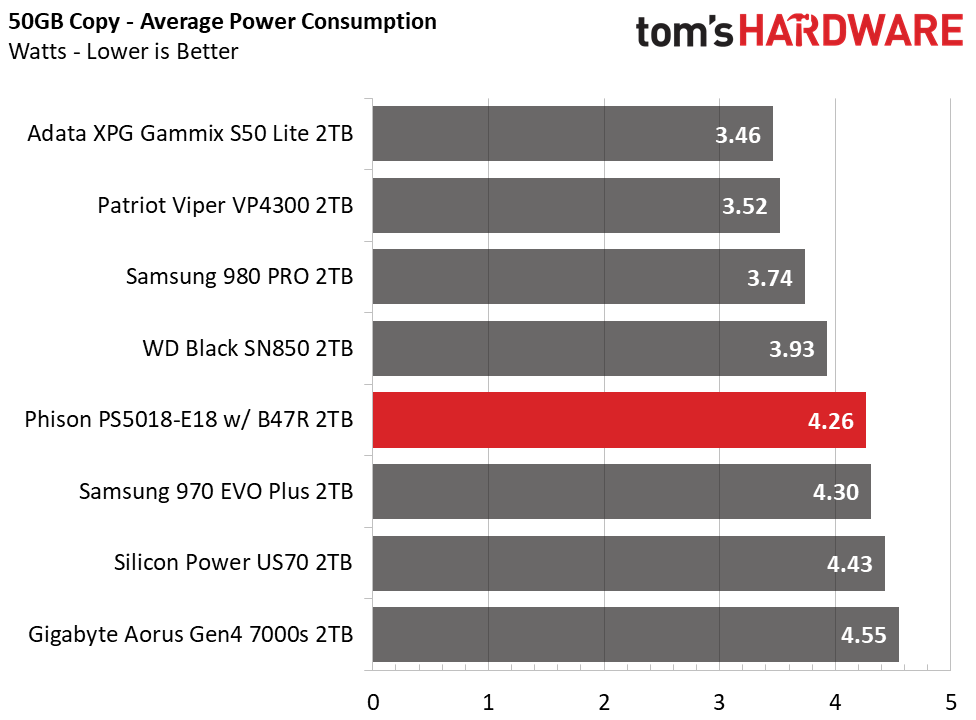
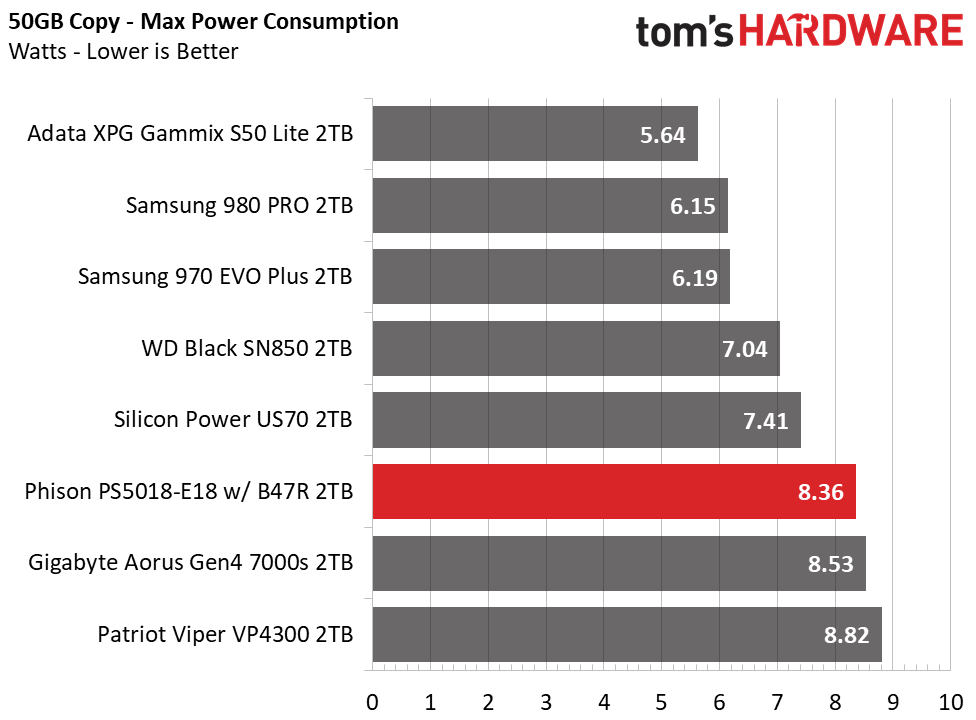
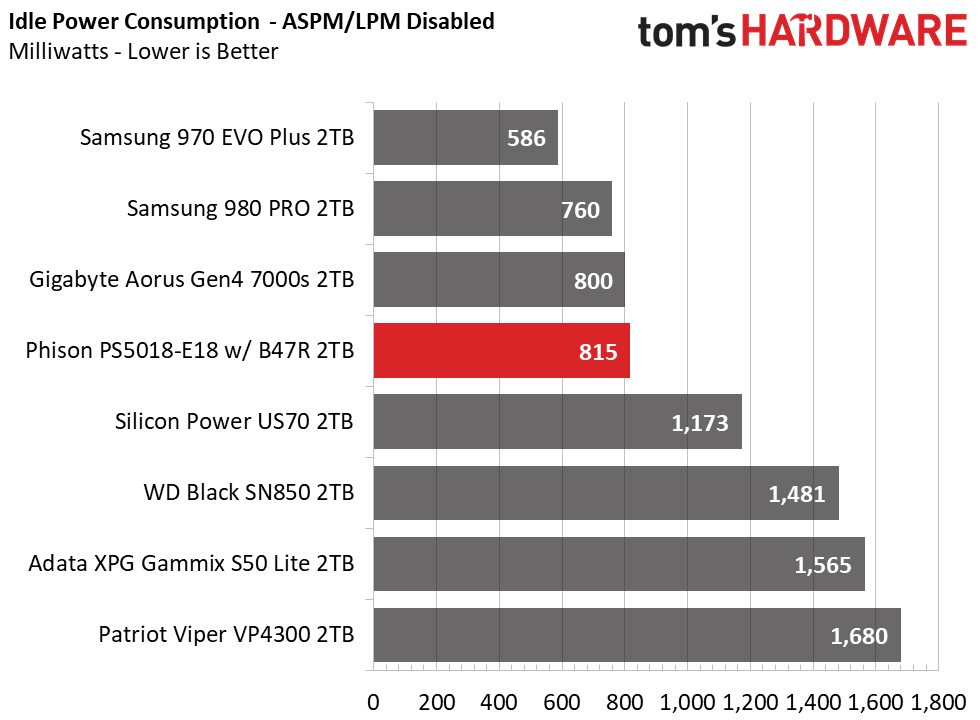
Phison’s E18 consumes a lot of power under full load, but it also delivers great power efficiency at the same time. It scores second to the Samsung 980 Pro on our efficiency ranking and power consumption looks to have improved by roughly 0.2-0.3 watts. Idle power consumption is also low when APSM is disabled.
On our 23C open-air test bench with no direct airflow and without a heatsink, the E18 controller measured 46 degrees Celsius while the flash measured 44 degrees. However, like the previous generation E18, this sample is also programmed to throttle after exceeding 70 degrees Celsius.
After transferring roughly 250GB of data to the SSD via multiple drag n’ drops within Windows Explorer the drive began to throttle and it even degraded to speeds as low as 380 MBps on average after reaching 75 degrees Celsius (the flash hit roughly 70 degrees). That means you'll get the best performance for extended duration workloads by using a heatsink or a built-in shroud on your motherboard.
MORE: Best SSDs
MORE: How We Test HDDs And SSDs
MORE: All SSD Content

Sean is a Contributing Editor at Tom’s Hardware US, covering storage hardware.
-
Makaveli This E18 controller much better performance with 144 Layer flash vs the 96 Layer stuff. Looking forward to a review with a final production firmware. If they can increase the SLC cache size and make it alittle bigger and bring the Endurance close to the level of the E16 drives will make this drive perfect.Reply
