Why you can trust Tom's Hardware
Comparison Products
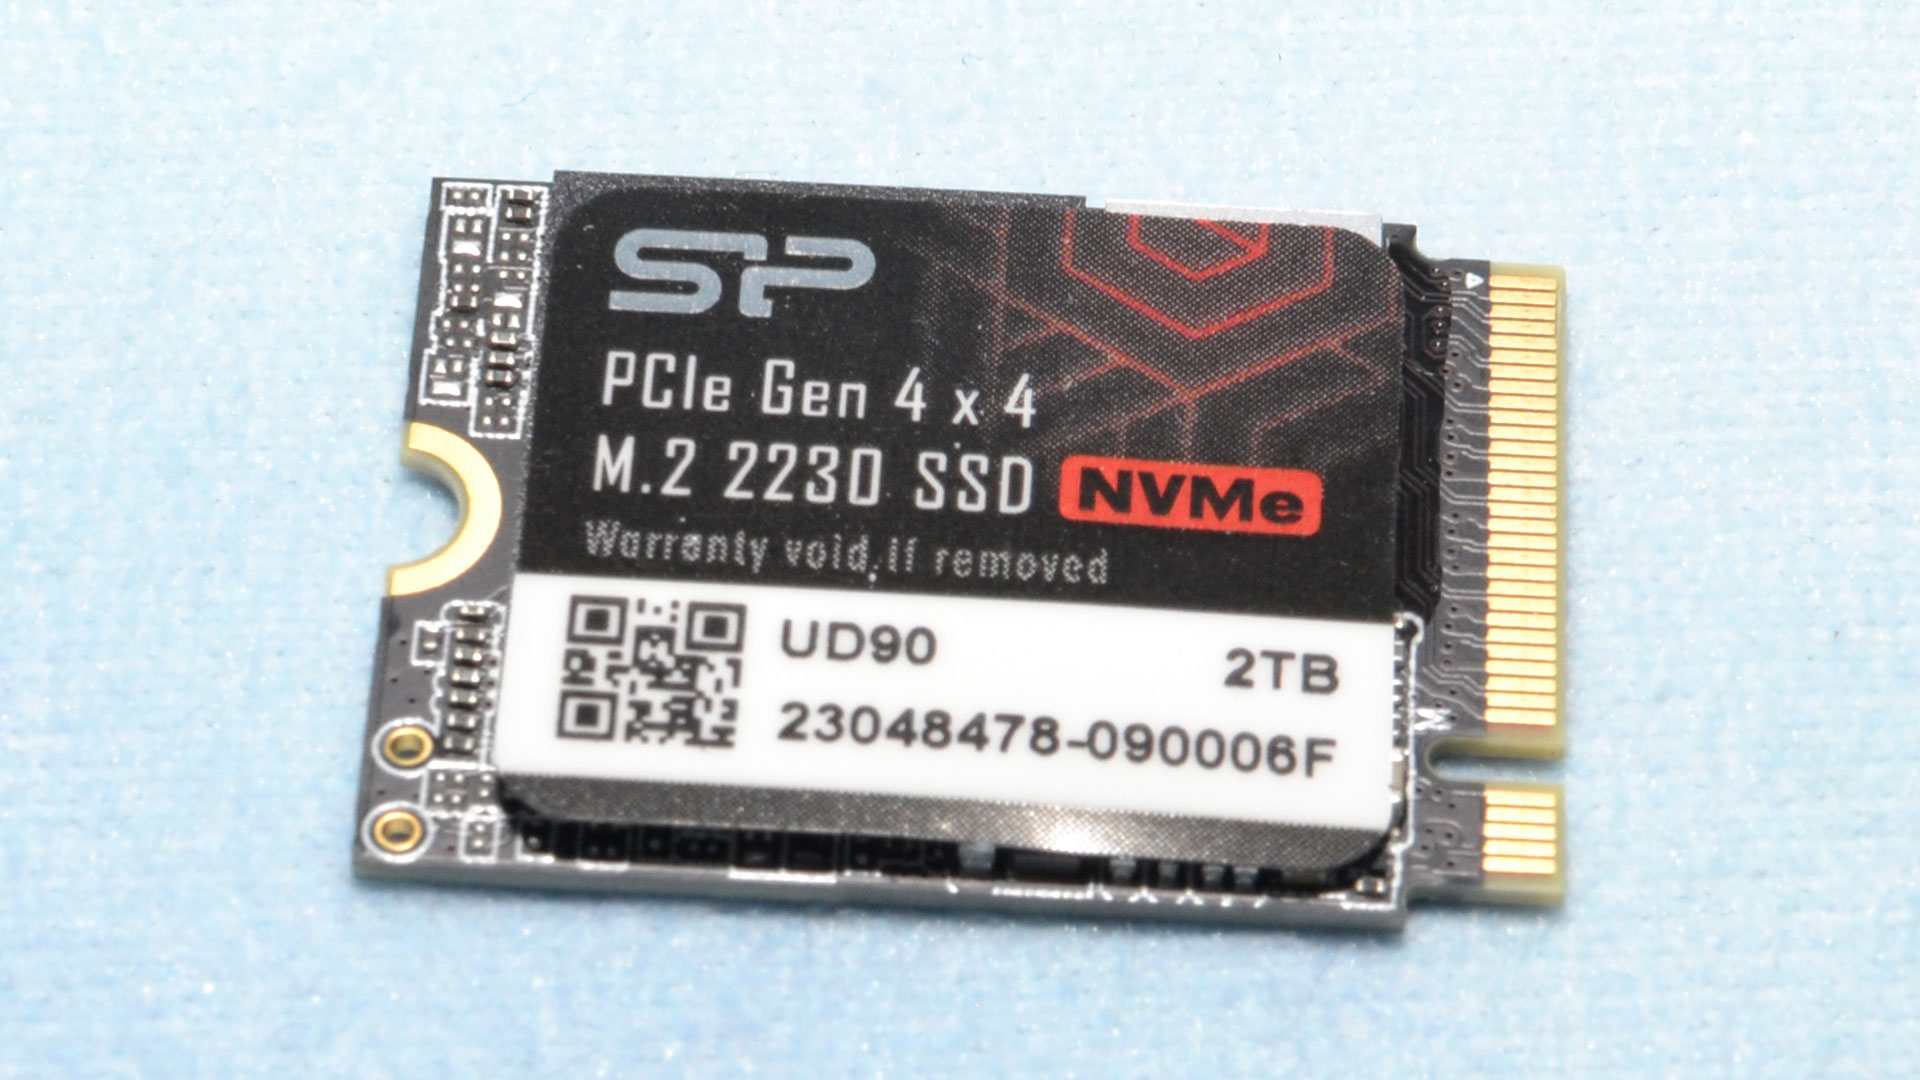
The 2TB Silicon Power UD 2230, not to be confused with the M.2 2280 UD90, competes directly with other 2TB QLC drives. This includes the Inland QN446, Addlink S91, and the Sabrent Rocket Q4 2230. The Teamgroup MP44S is a 1TB QLC drive, which would compete with the 1TB UD 2230 - and we see it’s quite viable for the Deck - and the Inland TN436 is a 1TB last-generation drive. The fastest 1TB drives we’ve tested have TLC, including the Corsair MP600 Mini, the Sabrent Rocket 2230, and the Inland TN446. The 2TB TLC WD Black SN770M also makes an appearance.
Steam Deck - General
To gauge general Steam Deck performance, we engage in a variety of typical storage situations with active time measurement. These activities include dealing with the default SteamOS through initial setup, re-imaging, initial booting, and booting in general. For game testing, we see how long it takes to install and boot the popular title Hollow Knight. For a full explanation of our testing procedure, see our Steam Deck storage testing article.
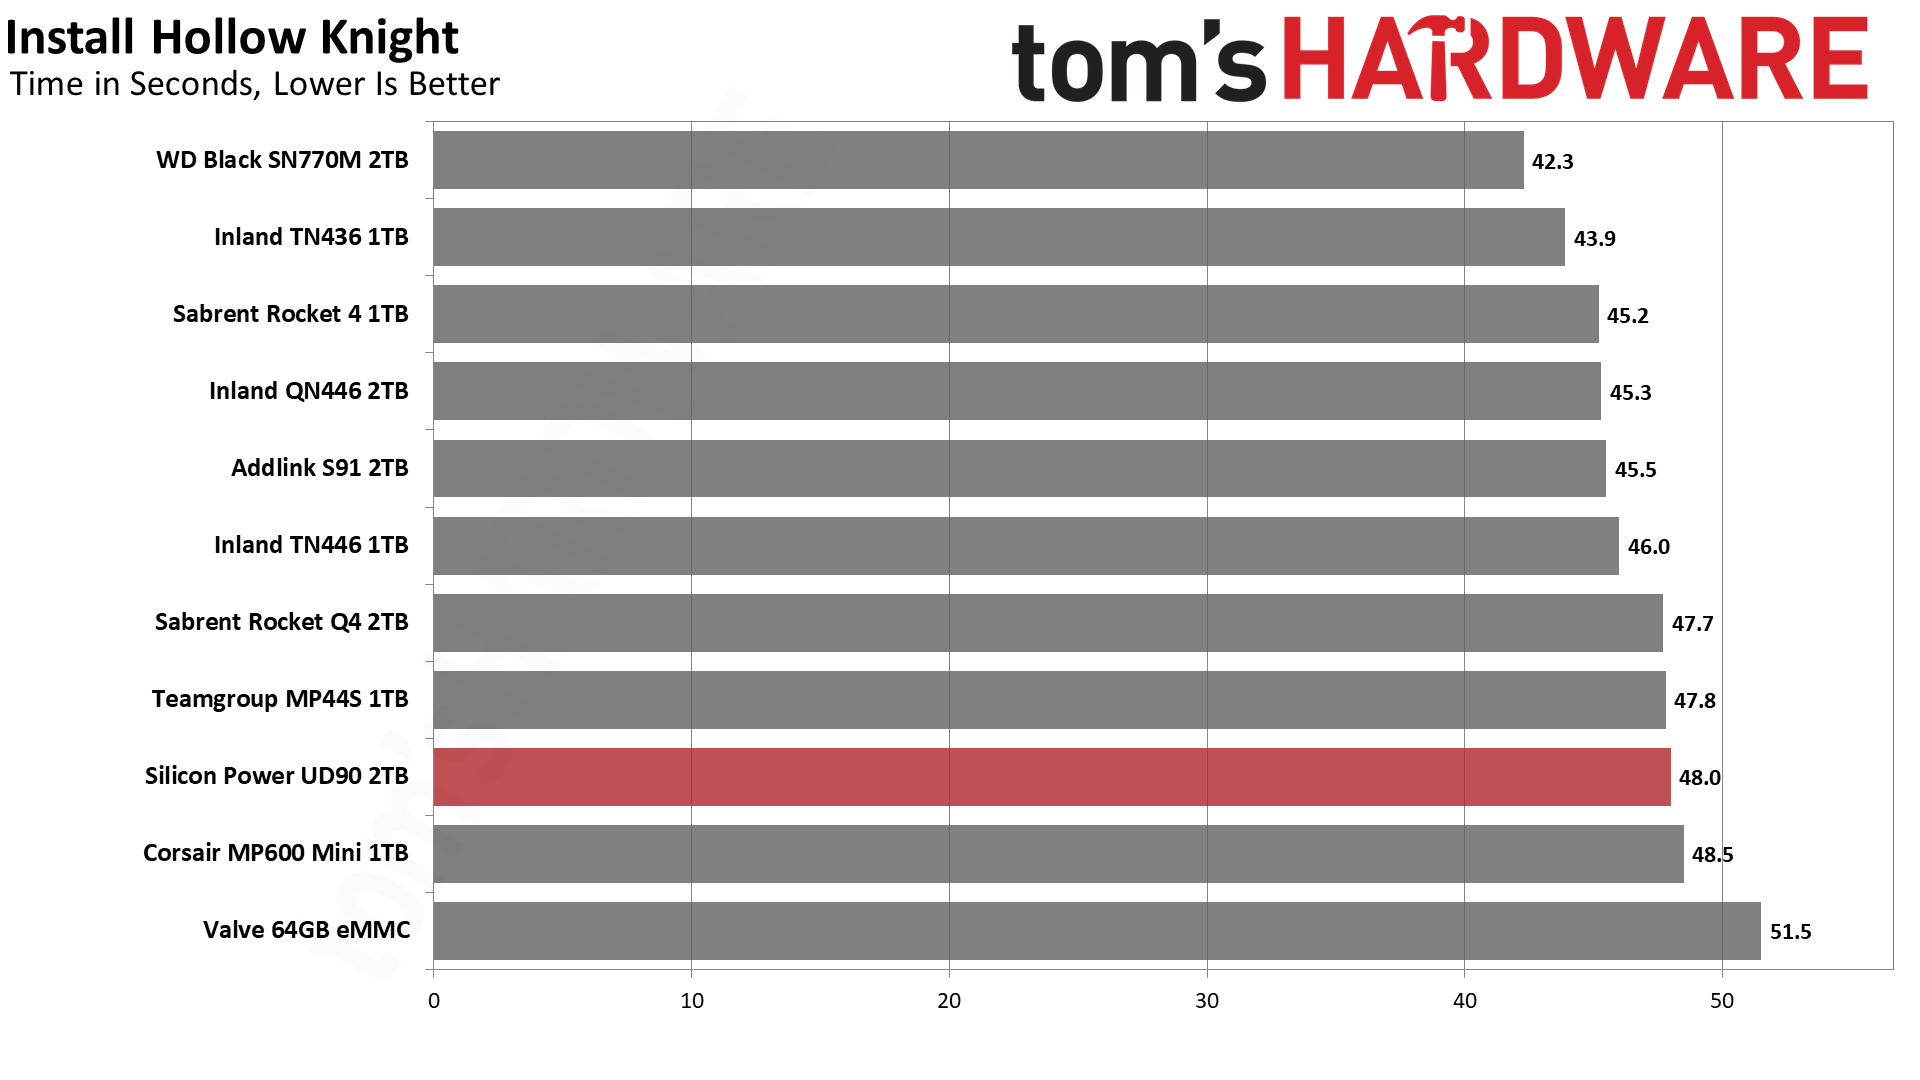
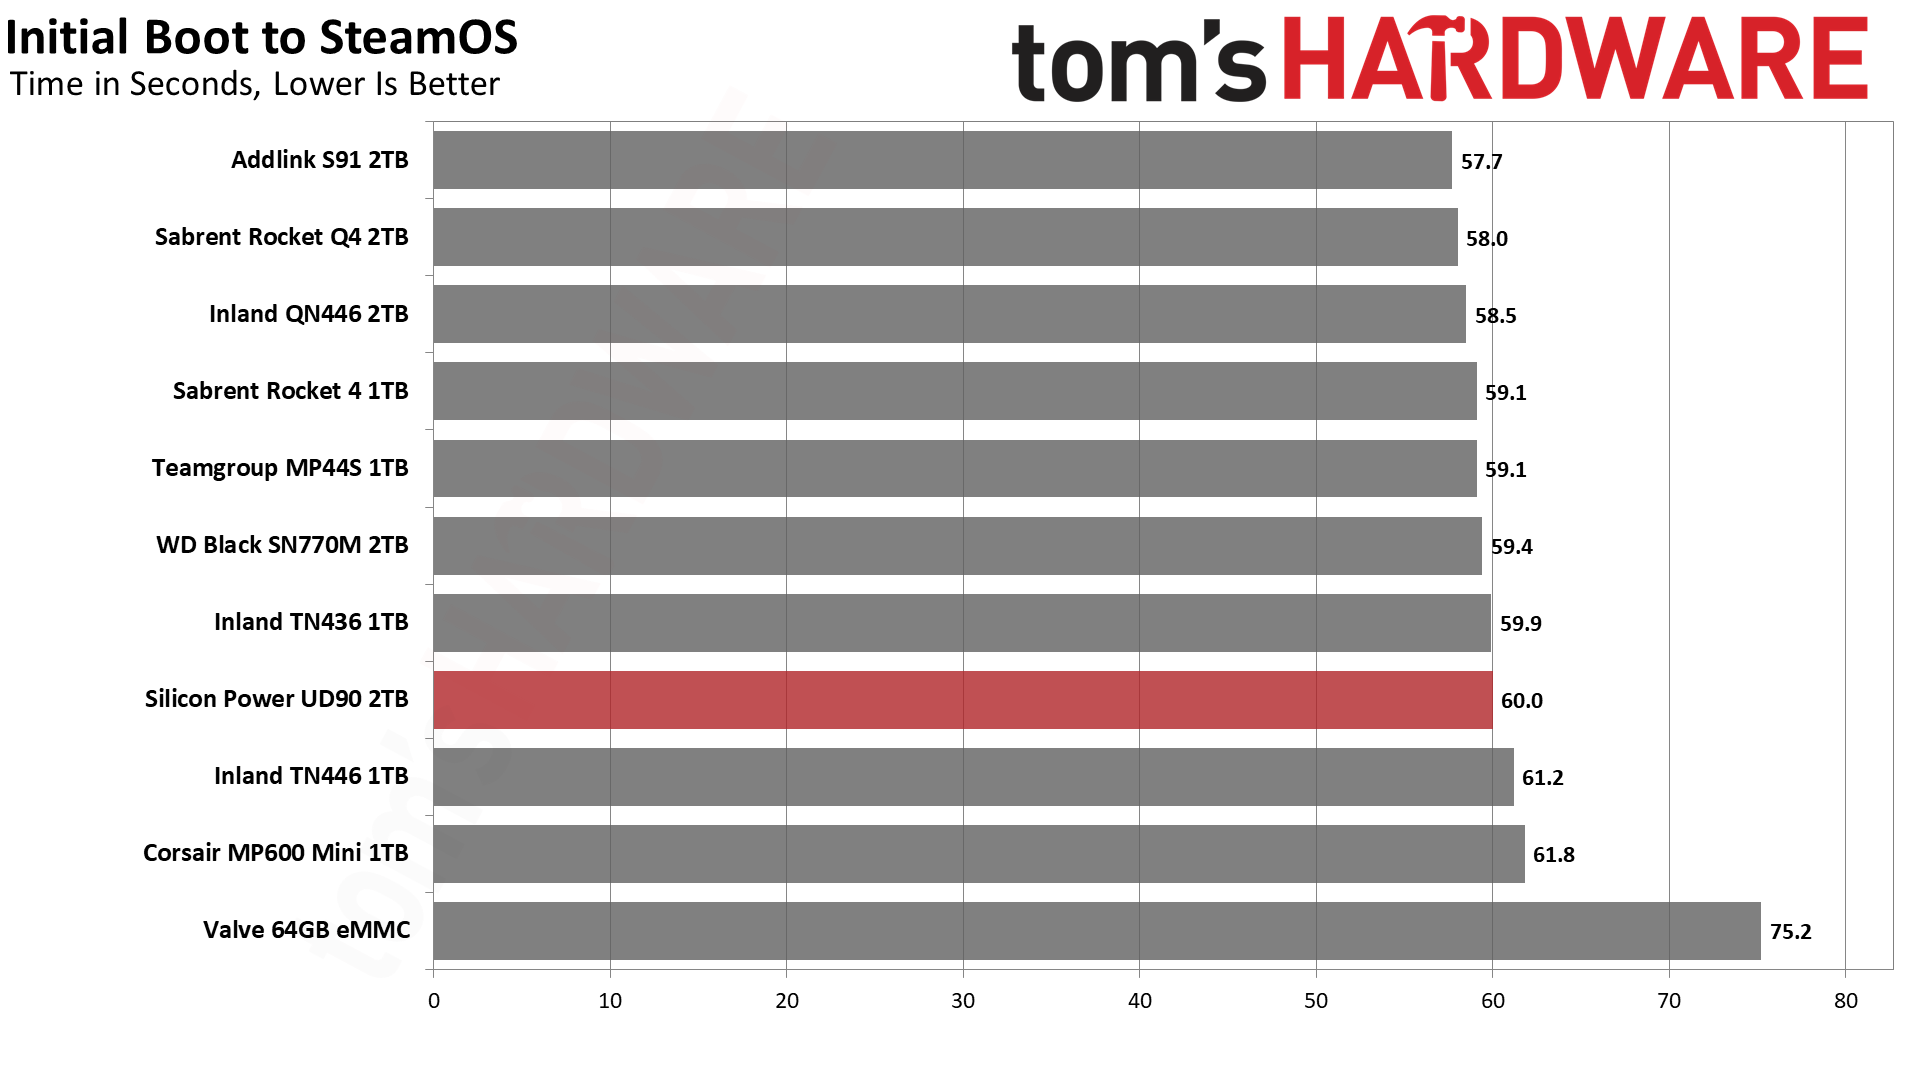
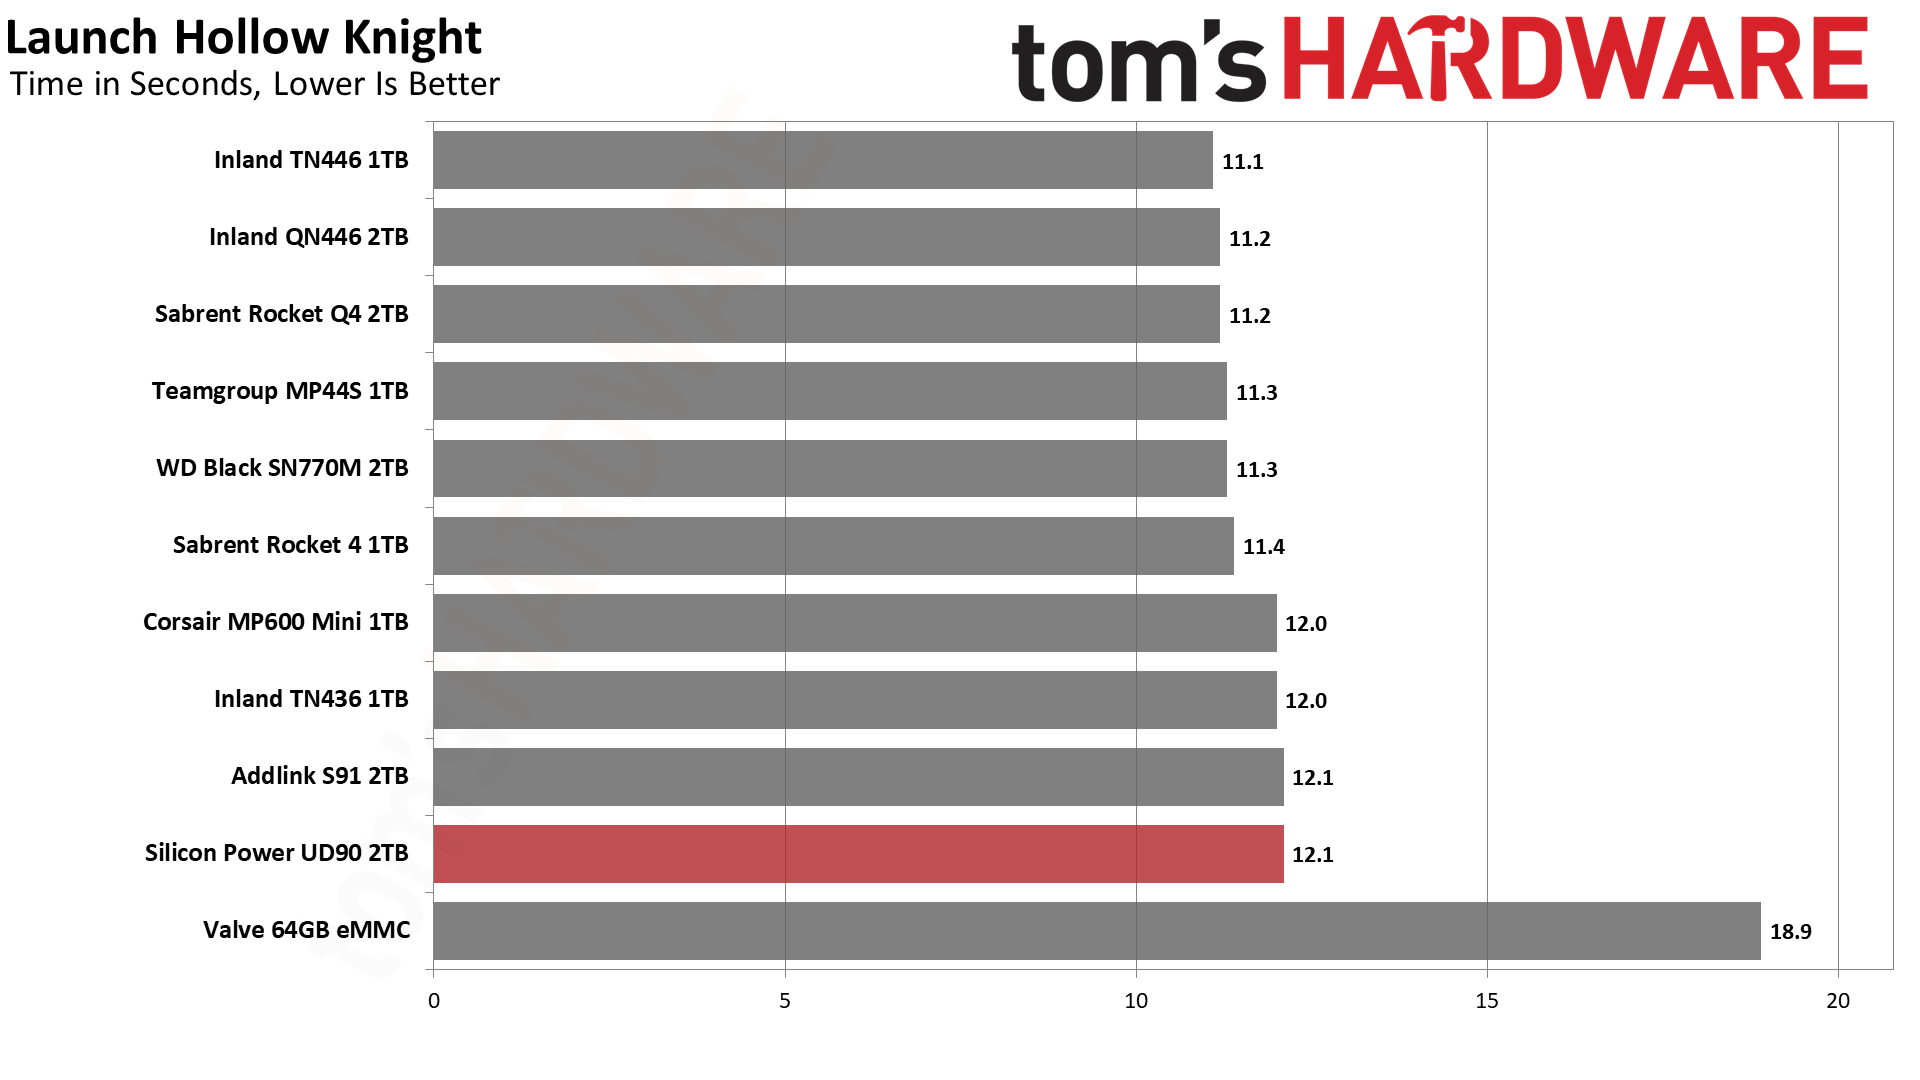
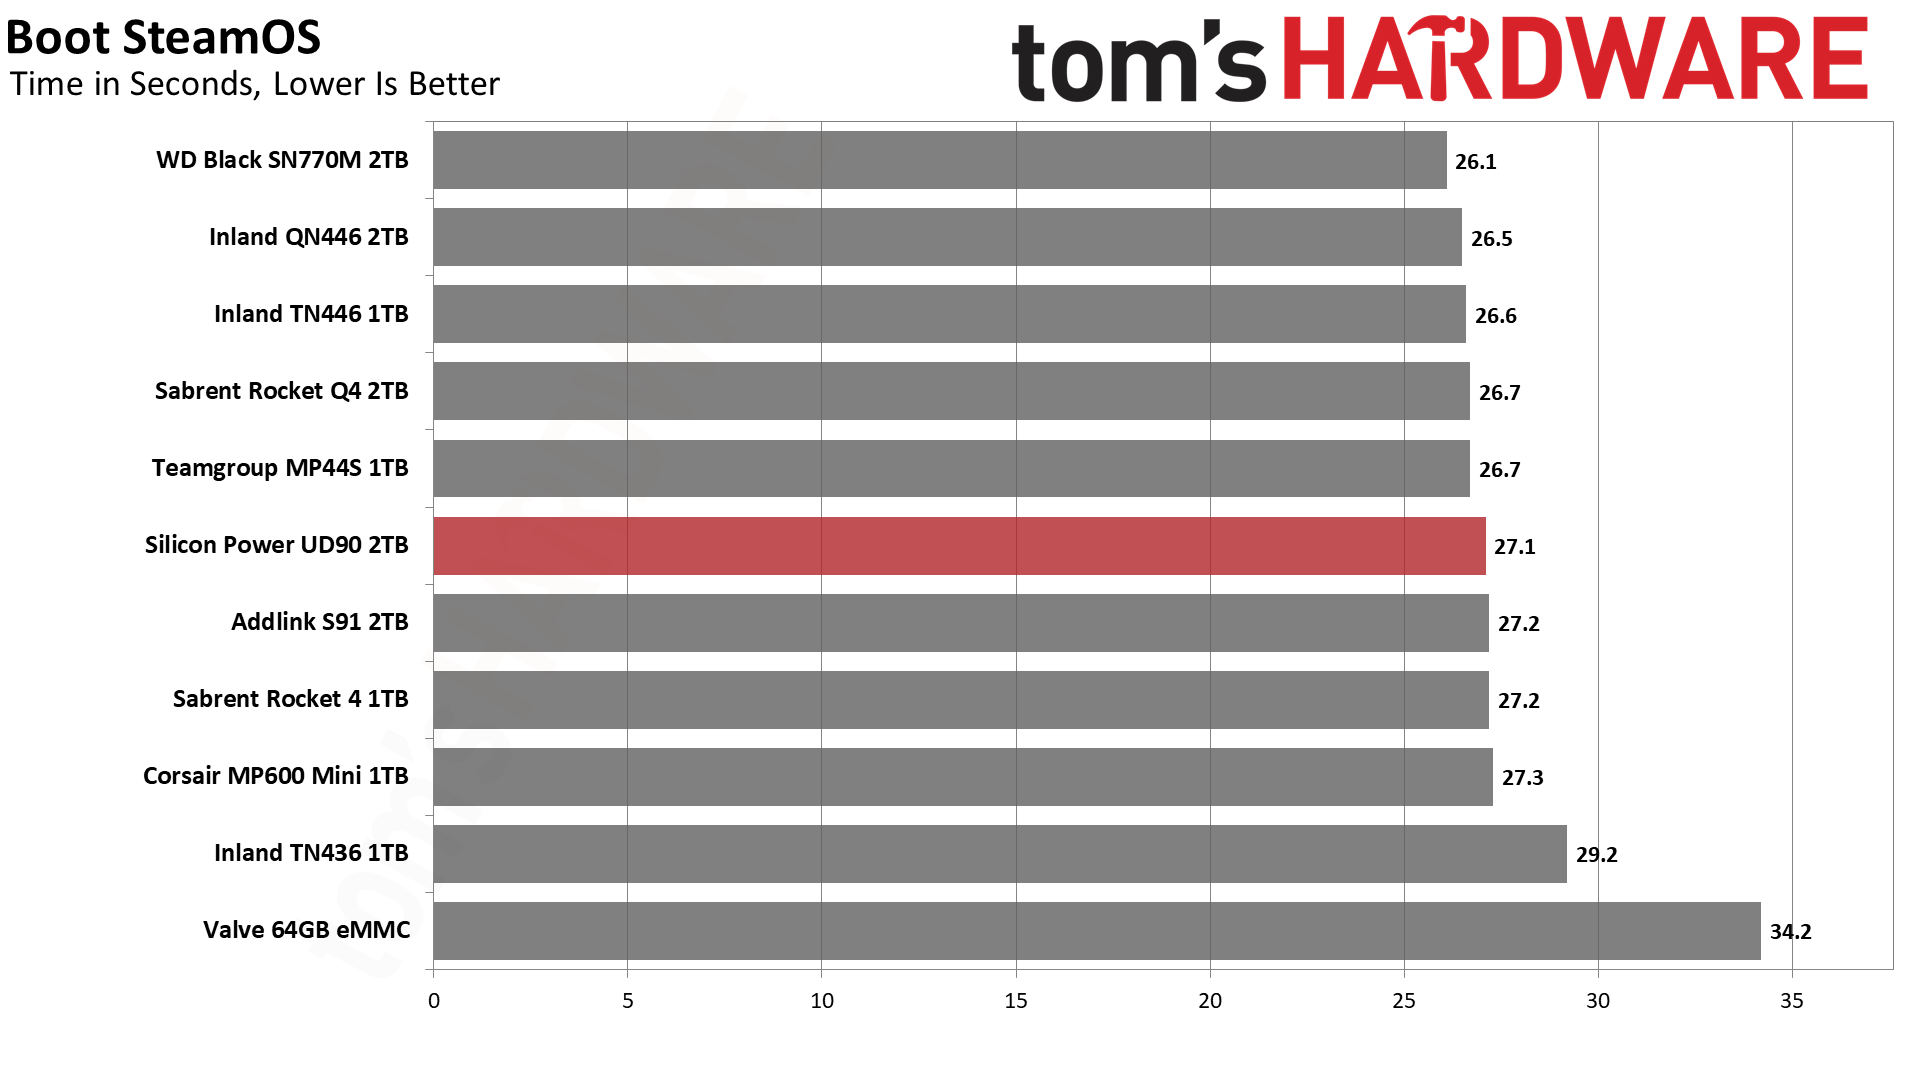
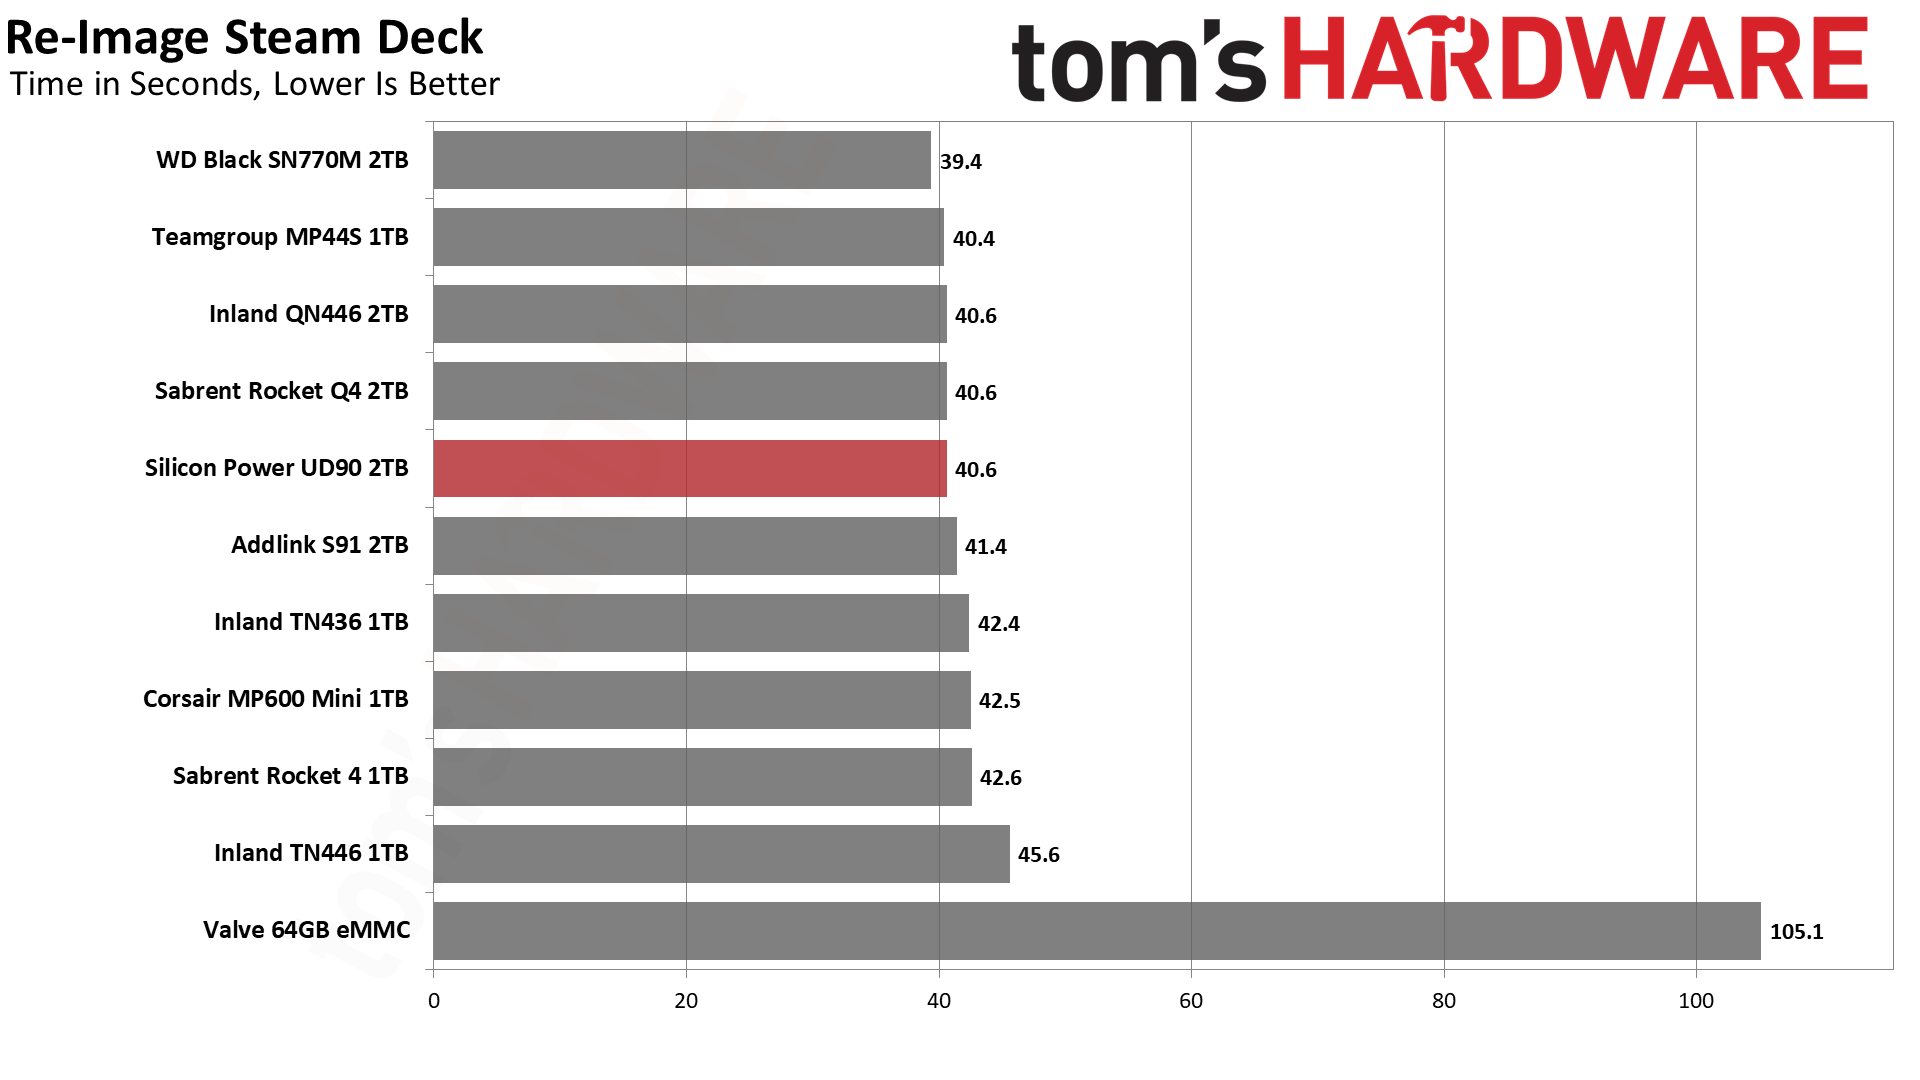
In terms of performance, the UD90 2230 fell in line with the rest of the QLC drives, like the Rocket Q4 2230, S91, and QN446. Any of these drives will be perfectly fine for the Steam Deck, and we have no trouble recommending QLC if you want a 2TB drive.
Steam Deck - KDiskMark and Temperature
One of the most popular, if not the most popular, storage benchmarks is CrysalDiskMark (CDM), which we use in our own Windows-based SSD testing suite. This benchmark relies on Microsoft’s DiskSpd with templated test settings. CDM lets you quickly see how a drive performs against its idealized, rated specifications and the benchmark can also hint at a more “real world” feel with low queue depth I/O testing.
The Linux flavor of this benchmark, which is easy to install on the Steam Deck, is KDiskMark. The “K” refers to the KDE desktop environment used on the Deck. KDiskMark relies on the Flexible I/O tester, or FIO, instead of DiskSpd. For the temperature portion we use data from the SMART sensors on the drive which can be directly polled and from which the maximum temperature can be extracted.
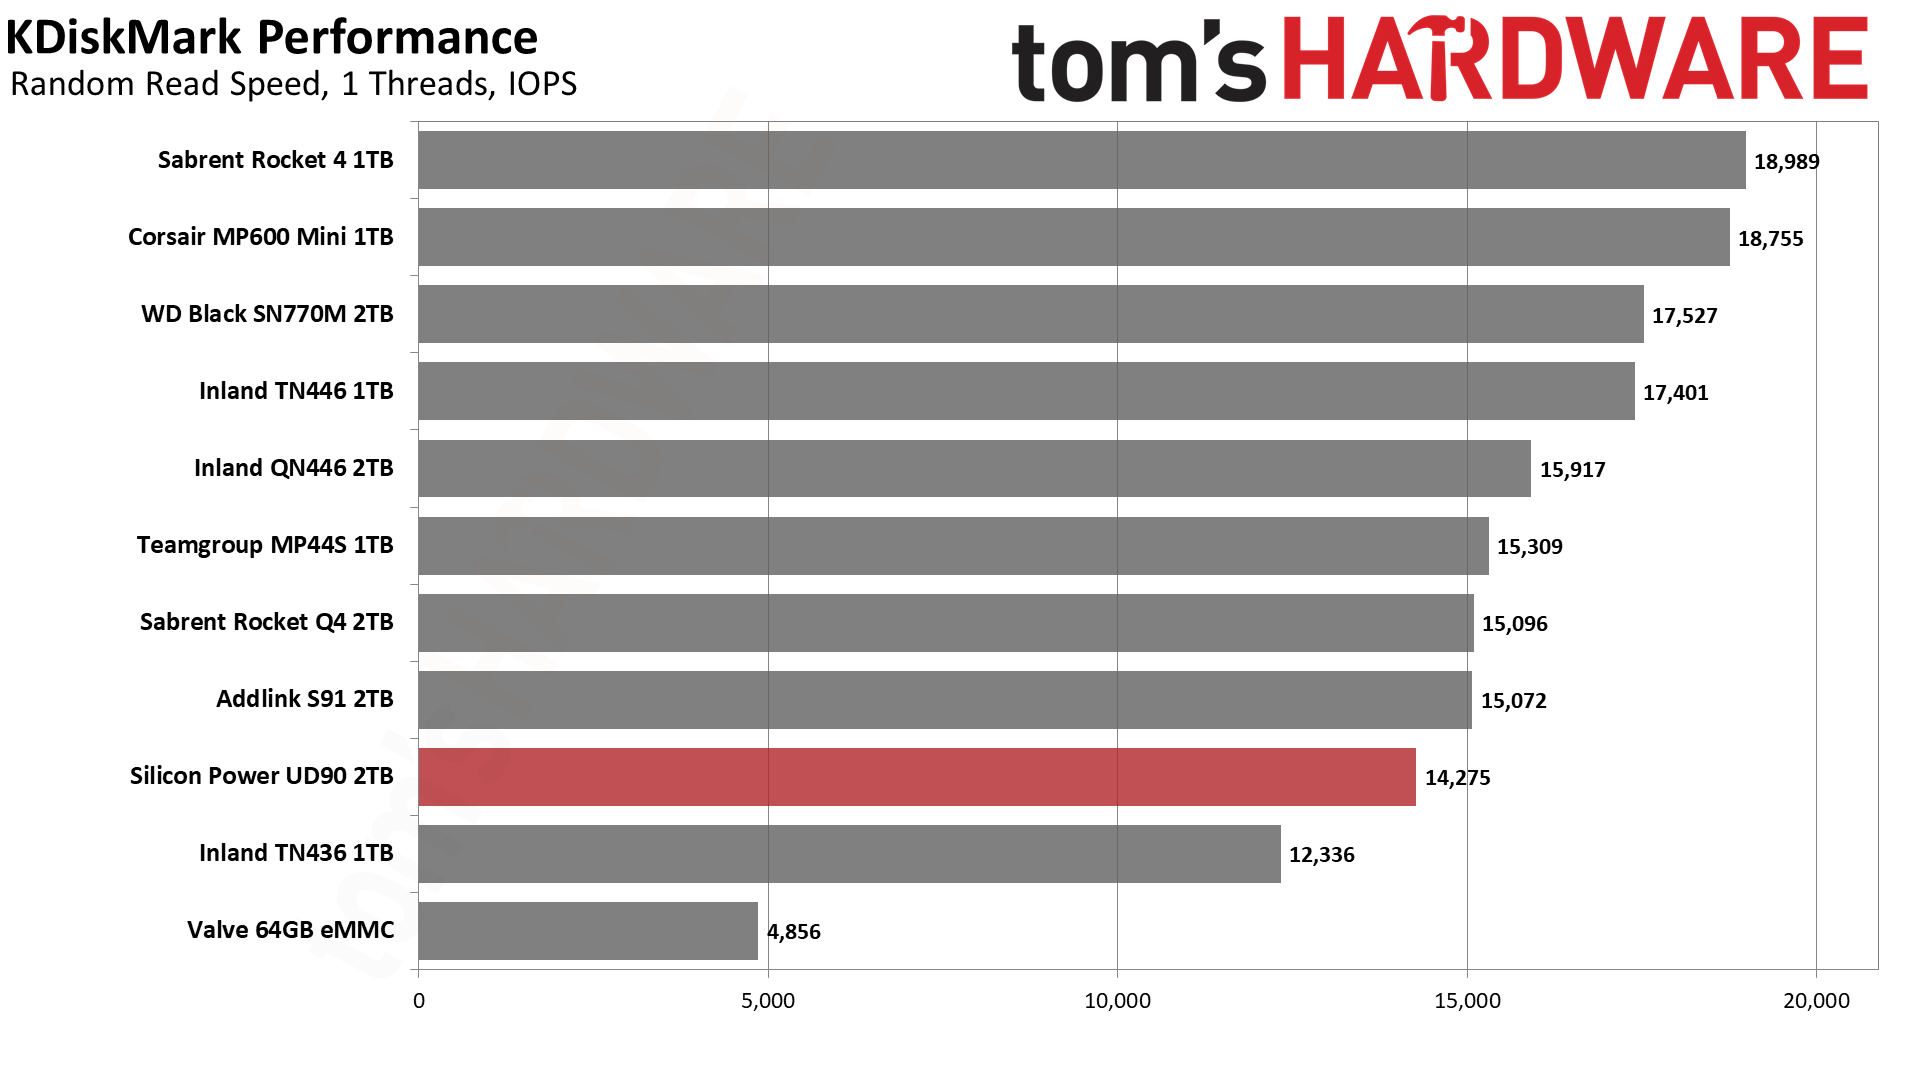
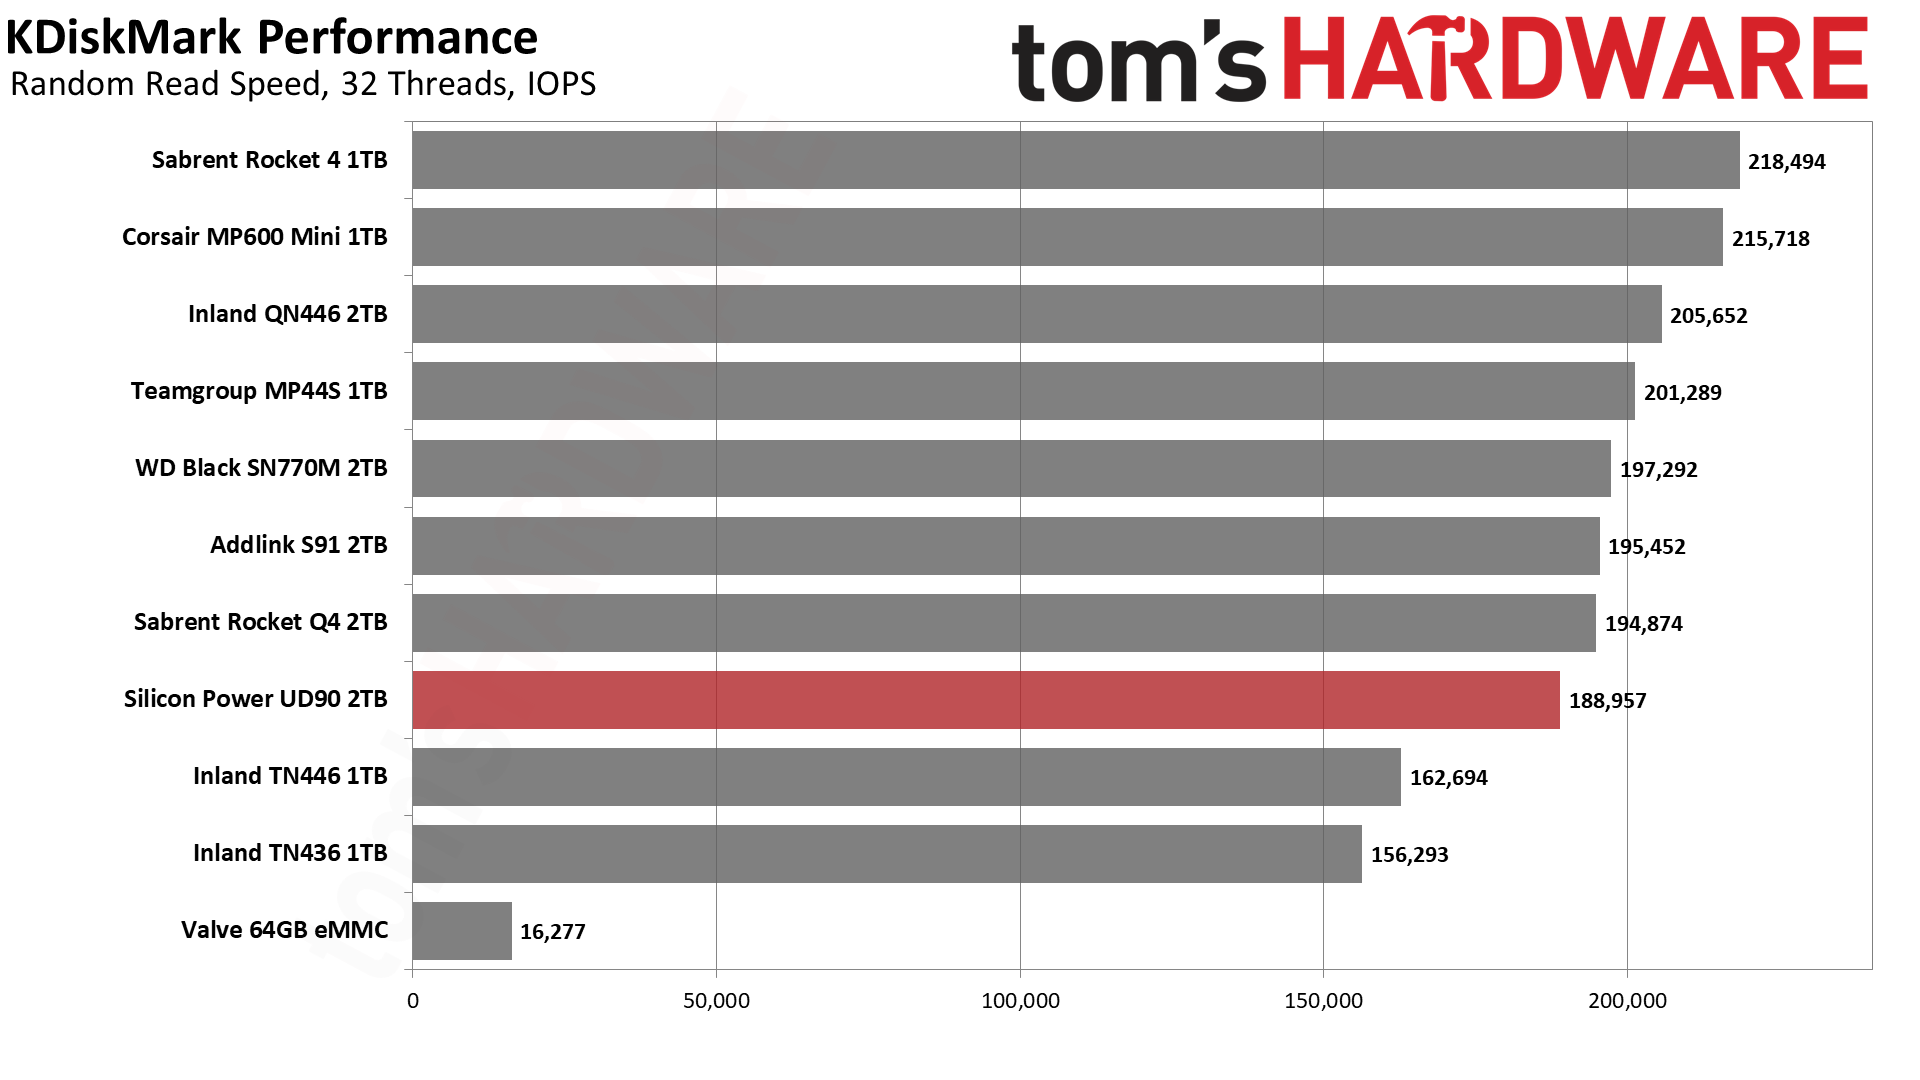
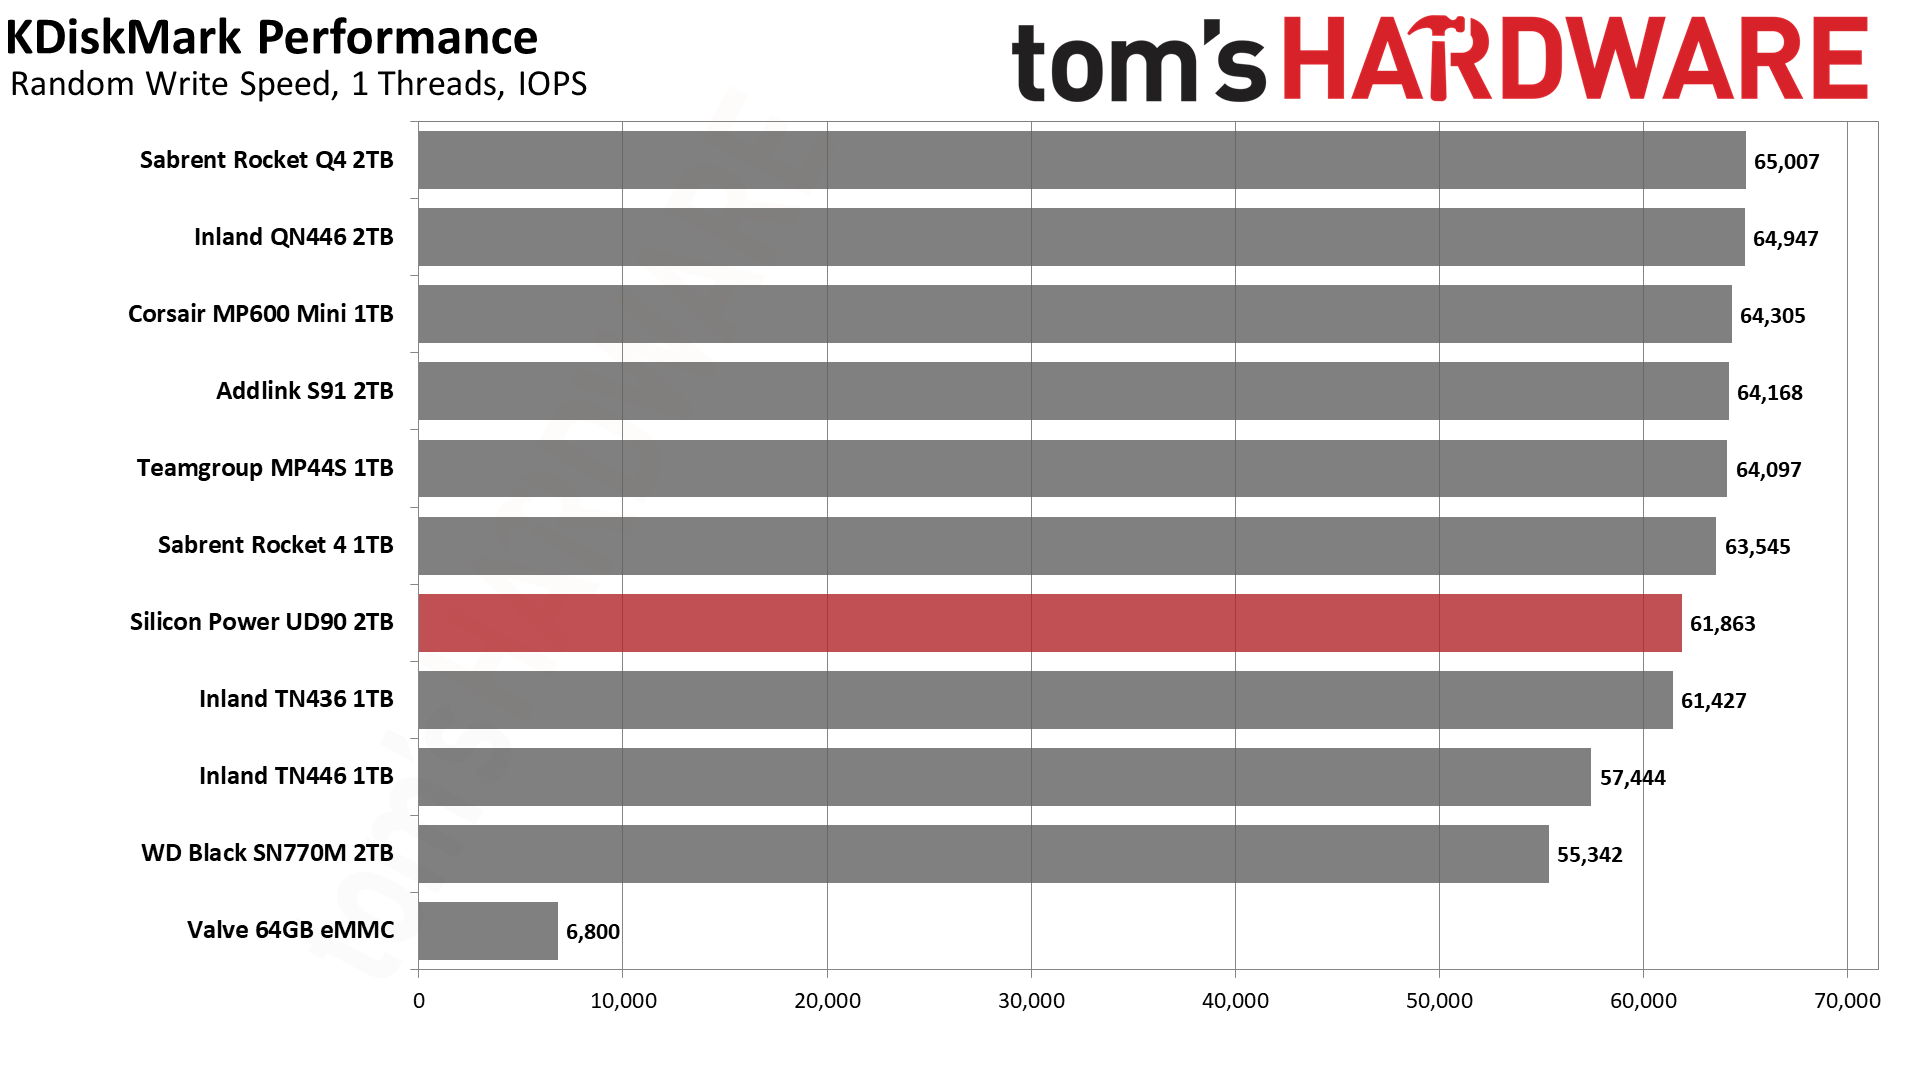
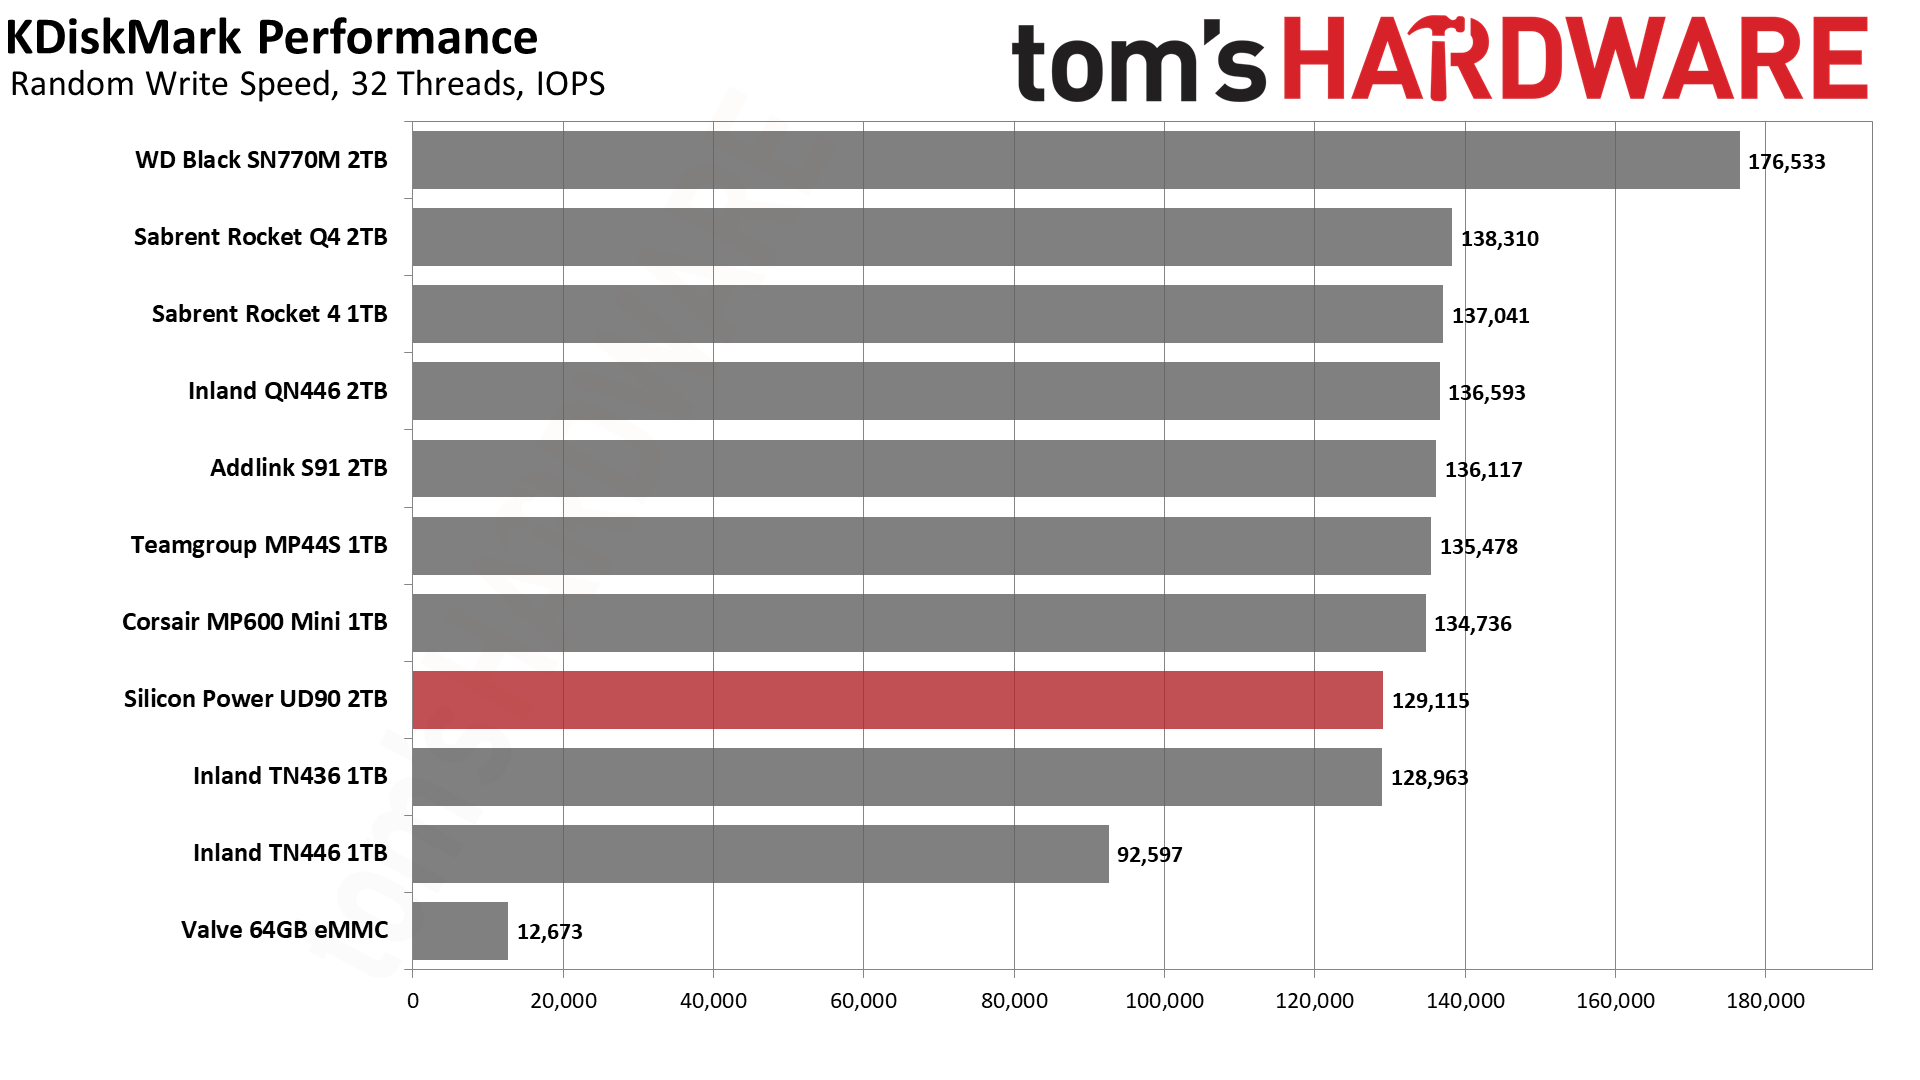
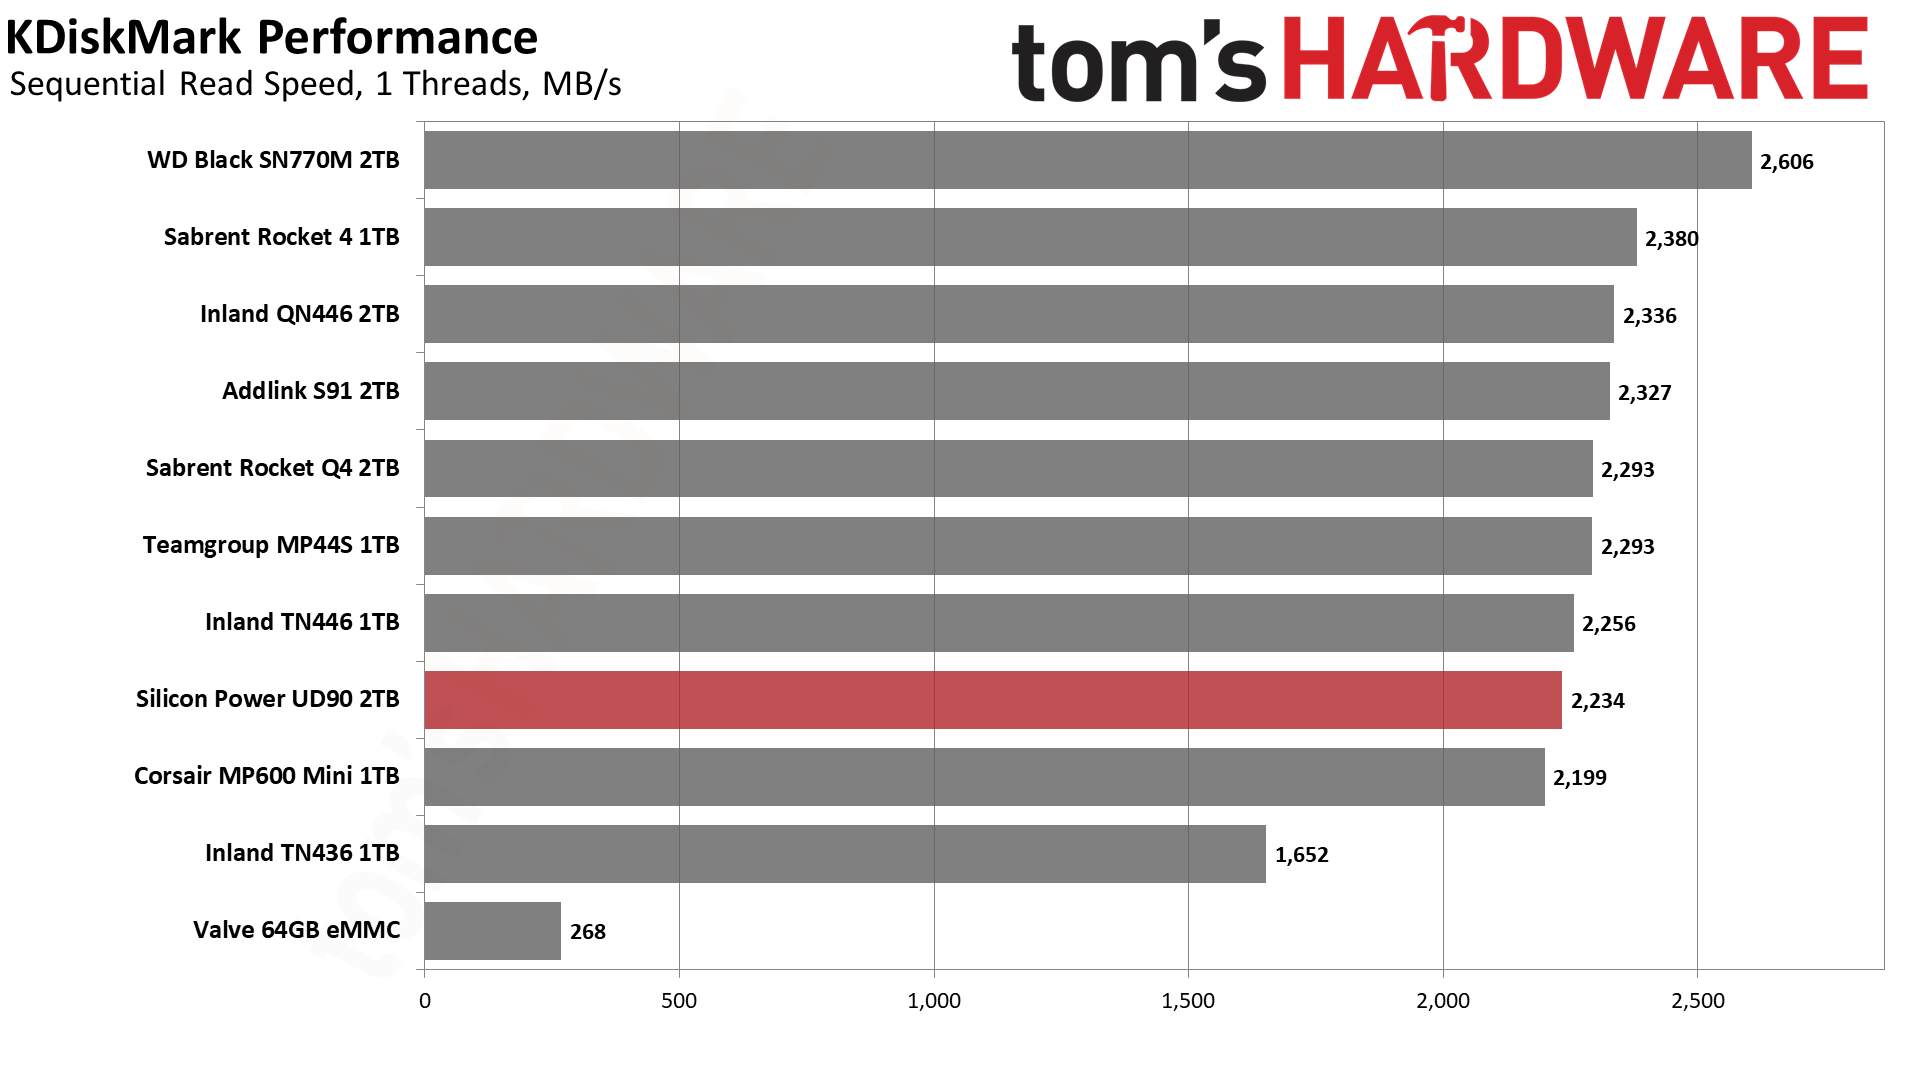
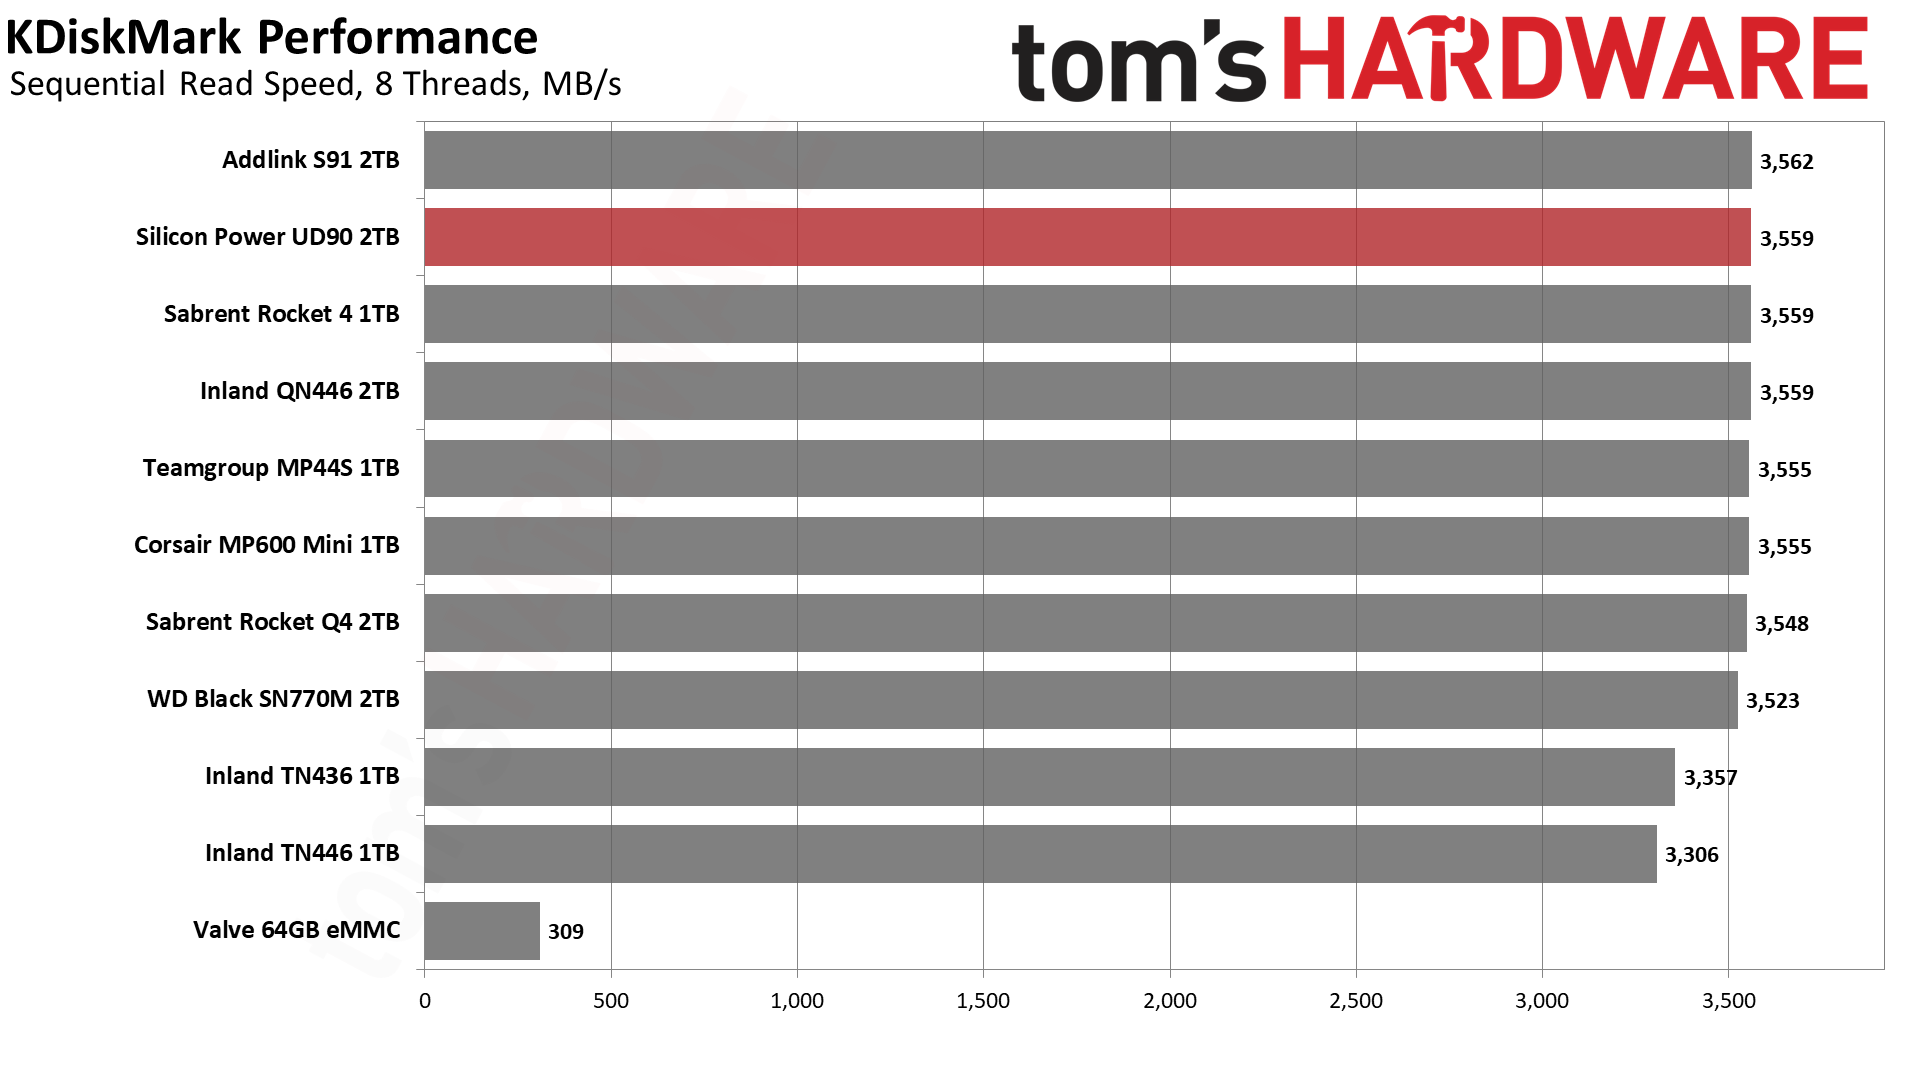
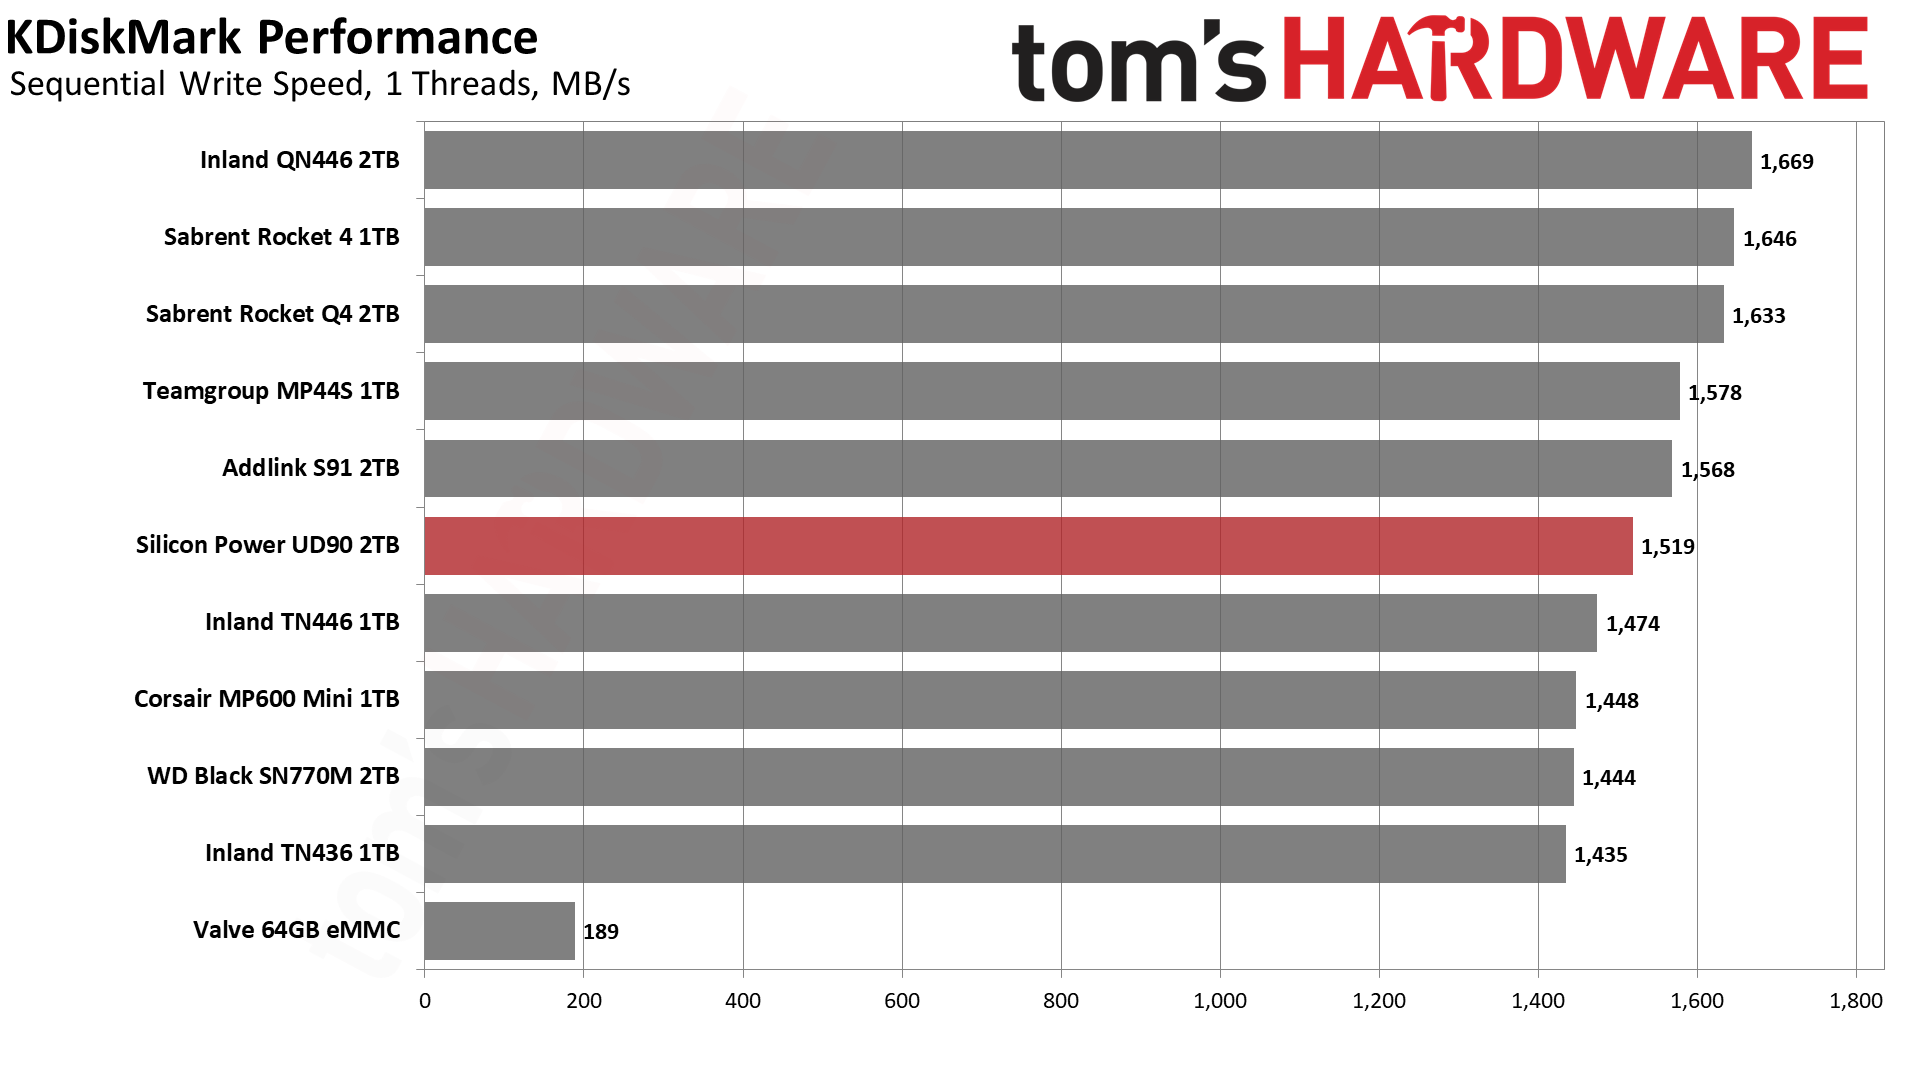
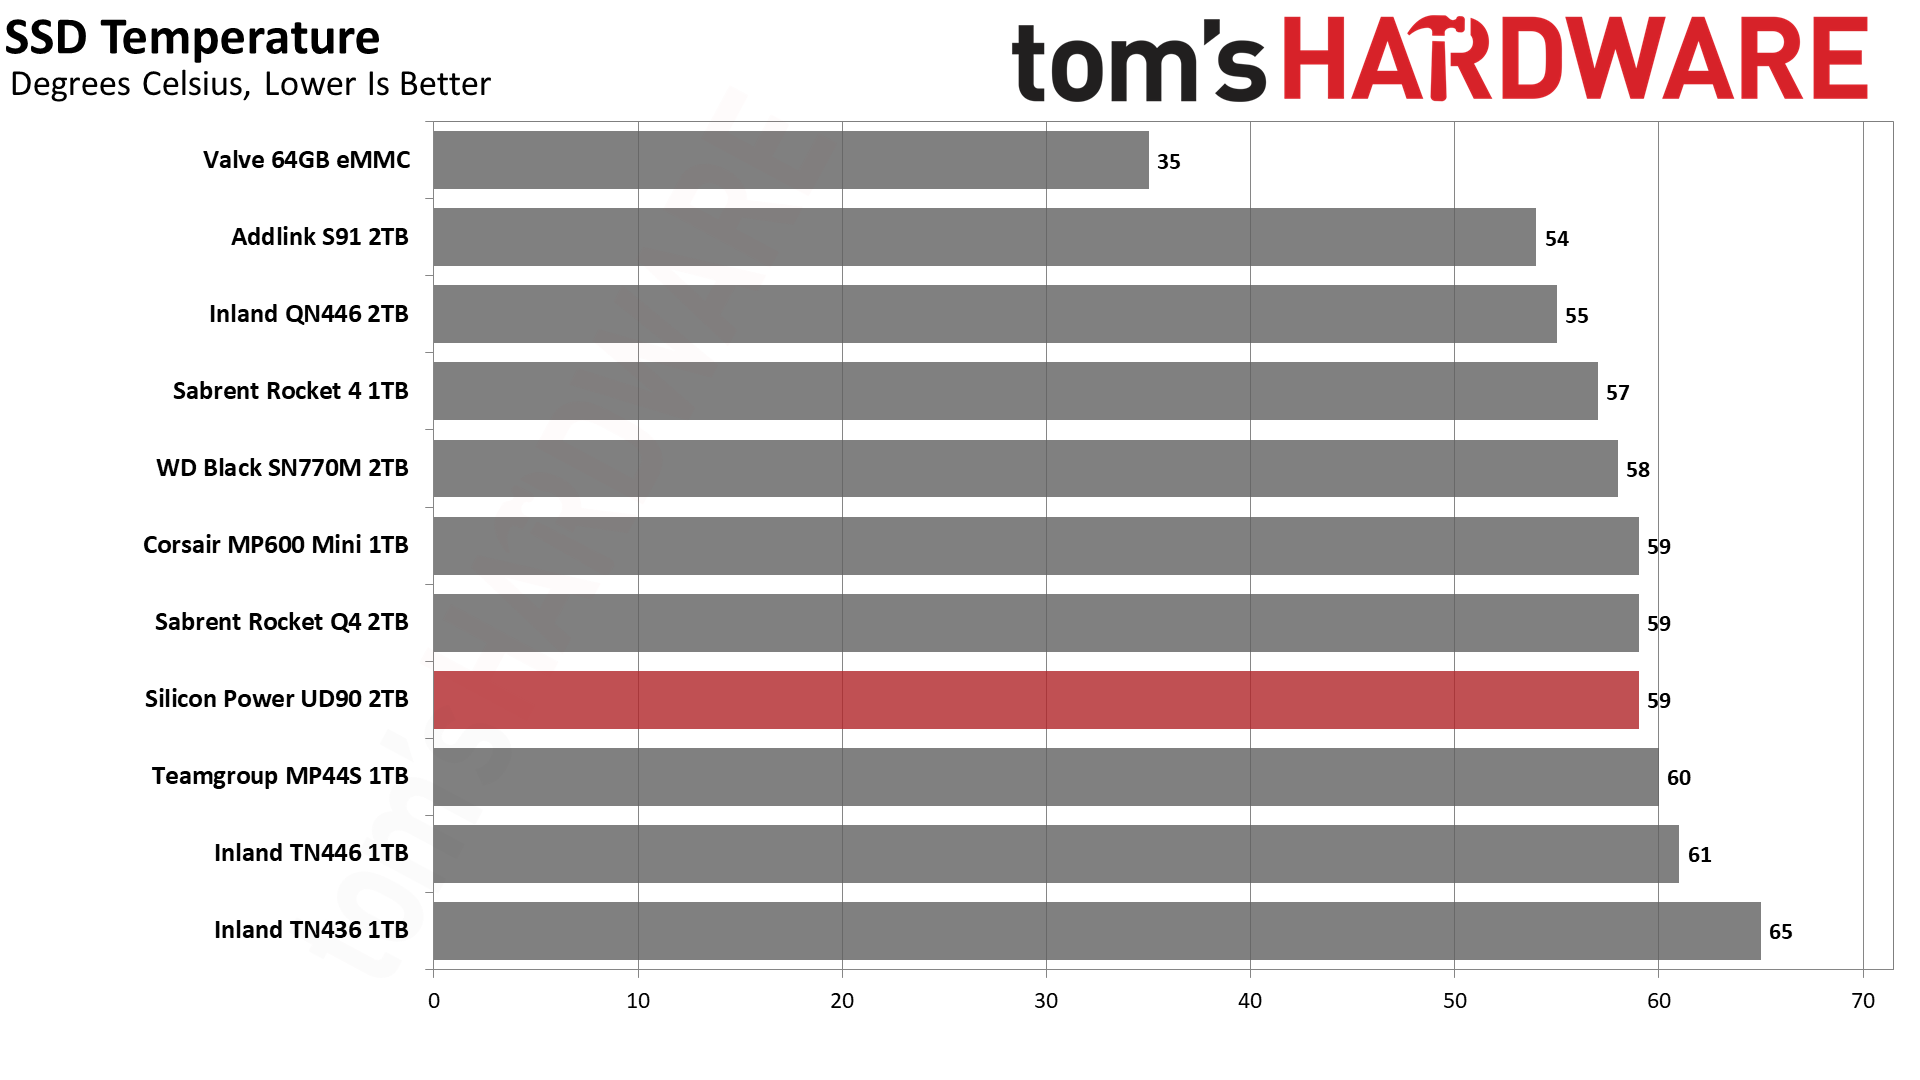
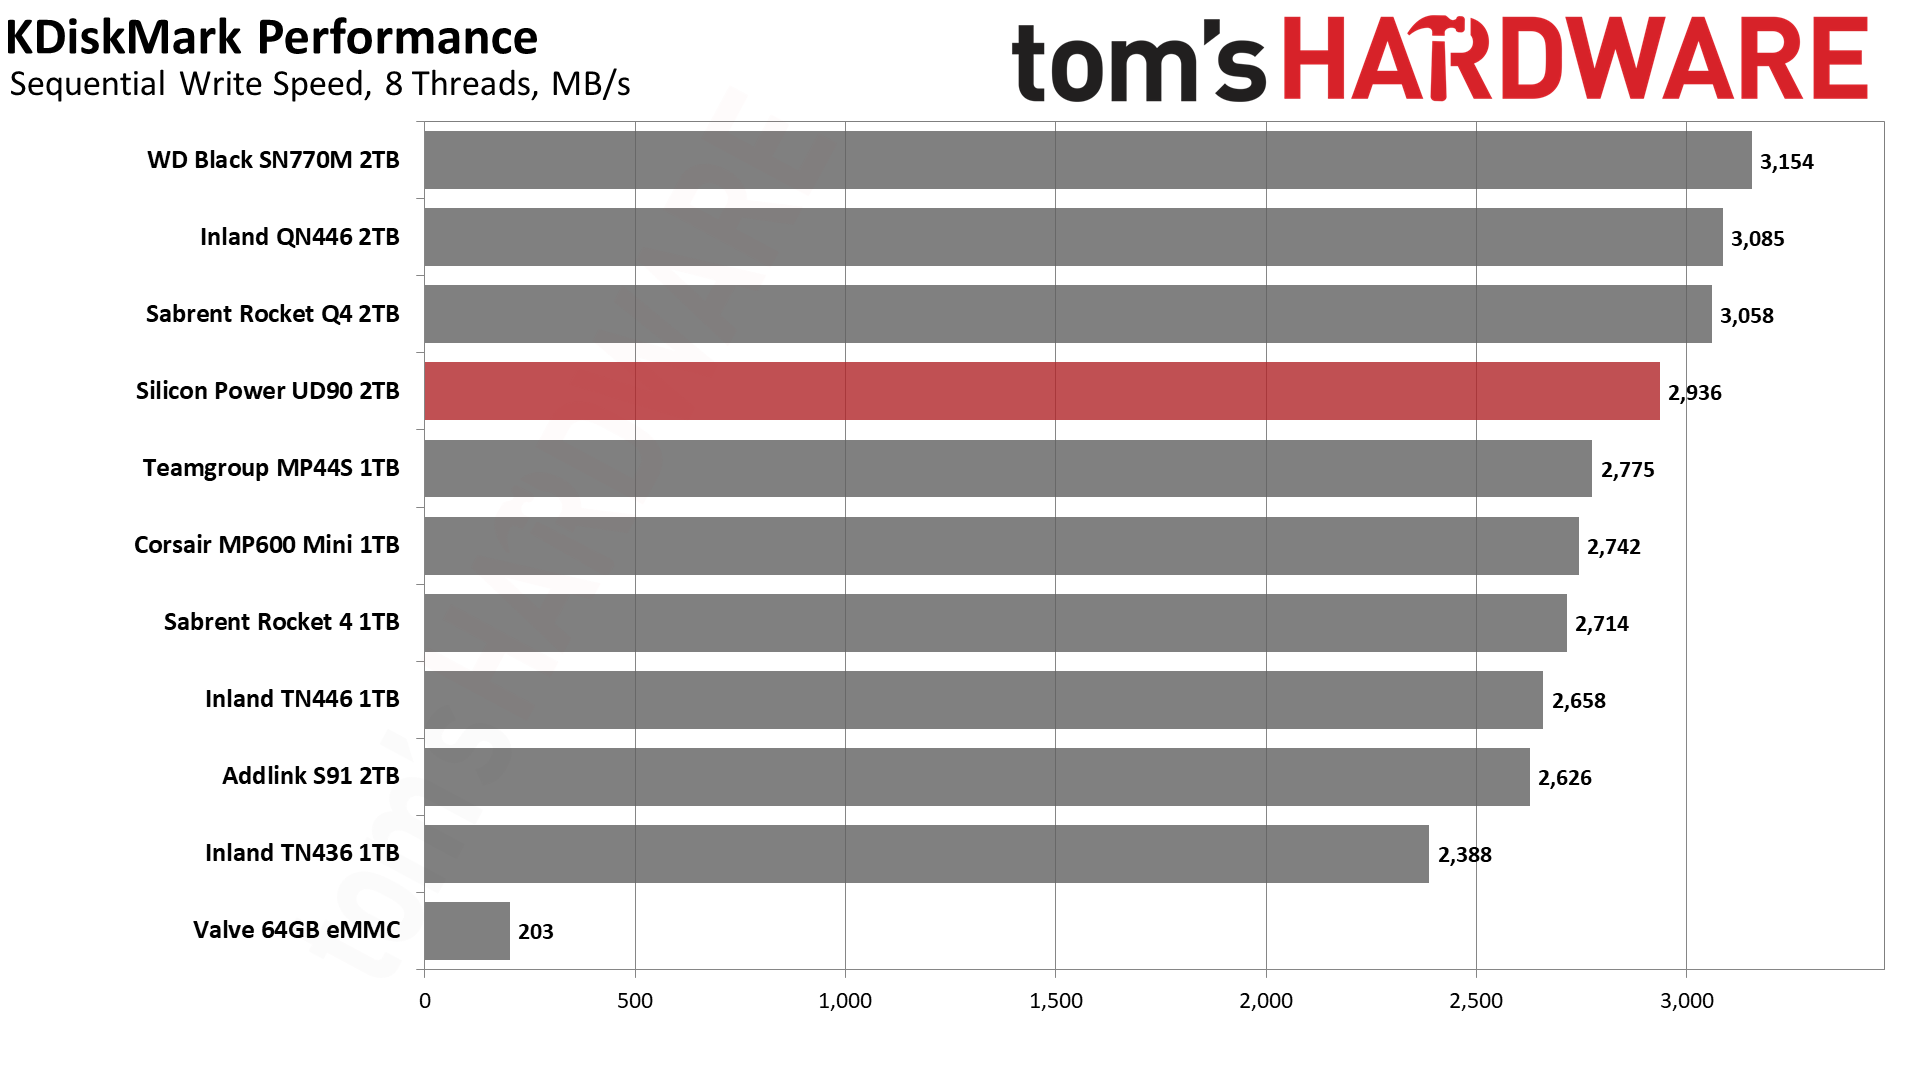
We don’t see the UD90 2230’s magic under Linux with KDiskMark. Does this suggest under-the-hood optimization for Windows-based benchmarks or that filesystem? That would seem unusual, given that this drive will be purchased, at least partly, for use in the Steam Deck. However, the majority of portable gaming systems now sold are Windows-based. Windows and multi-boot are popular on the Deck, too. Not many sites test storage this definitively on both operating systems, so this might otherwise fly under the radar.
The maximum temperature hit pretty close to what we had with PCIe 3.0 mode in our standard desktop testing. These drives will get hotter when exposed to long gaming sessions at maximum system power draw. Higher temperatures can be expected in PCIe 4.0-capable systems, as well.
Get Tom's Hardware's best news and in-depth reviews, straight to your inbox.
PC Trace Testing - 3DMark Gaming Storage Benchmark
Built for gamers, 3DMark’s Storage Benchmark focuses on real-world gaming performance. Each round in this benchmark stresses storage based on gaming activities including loading games, saving progress, installing game files, and recording gameplay video streams.
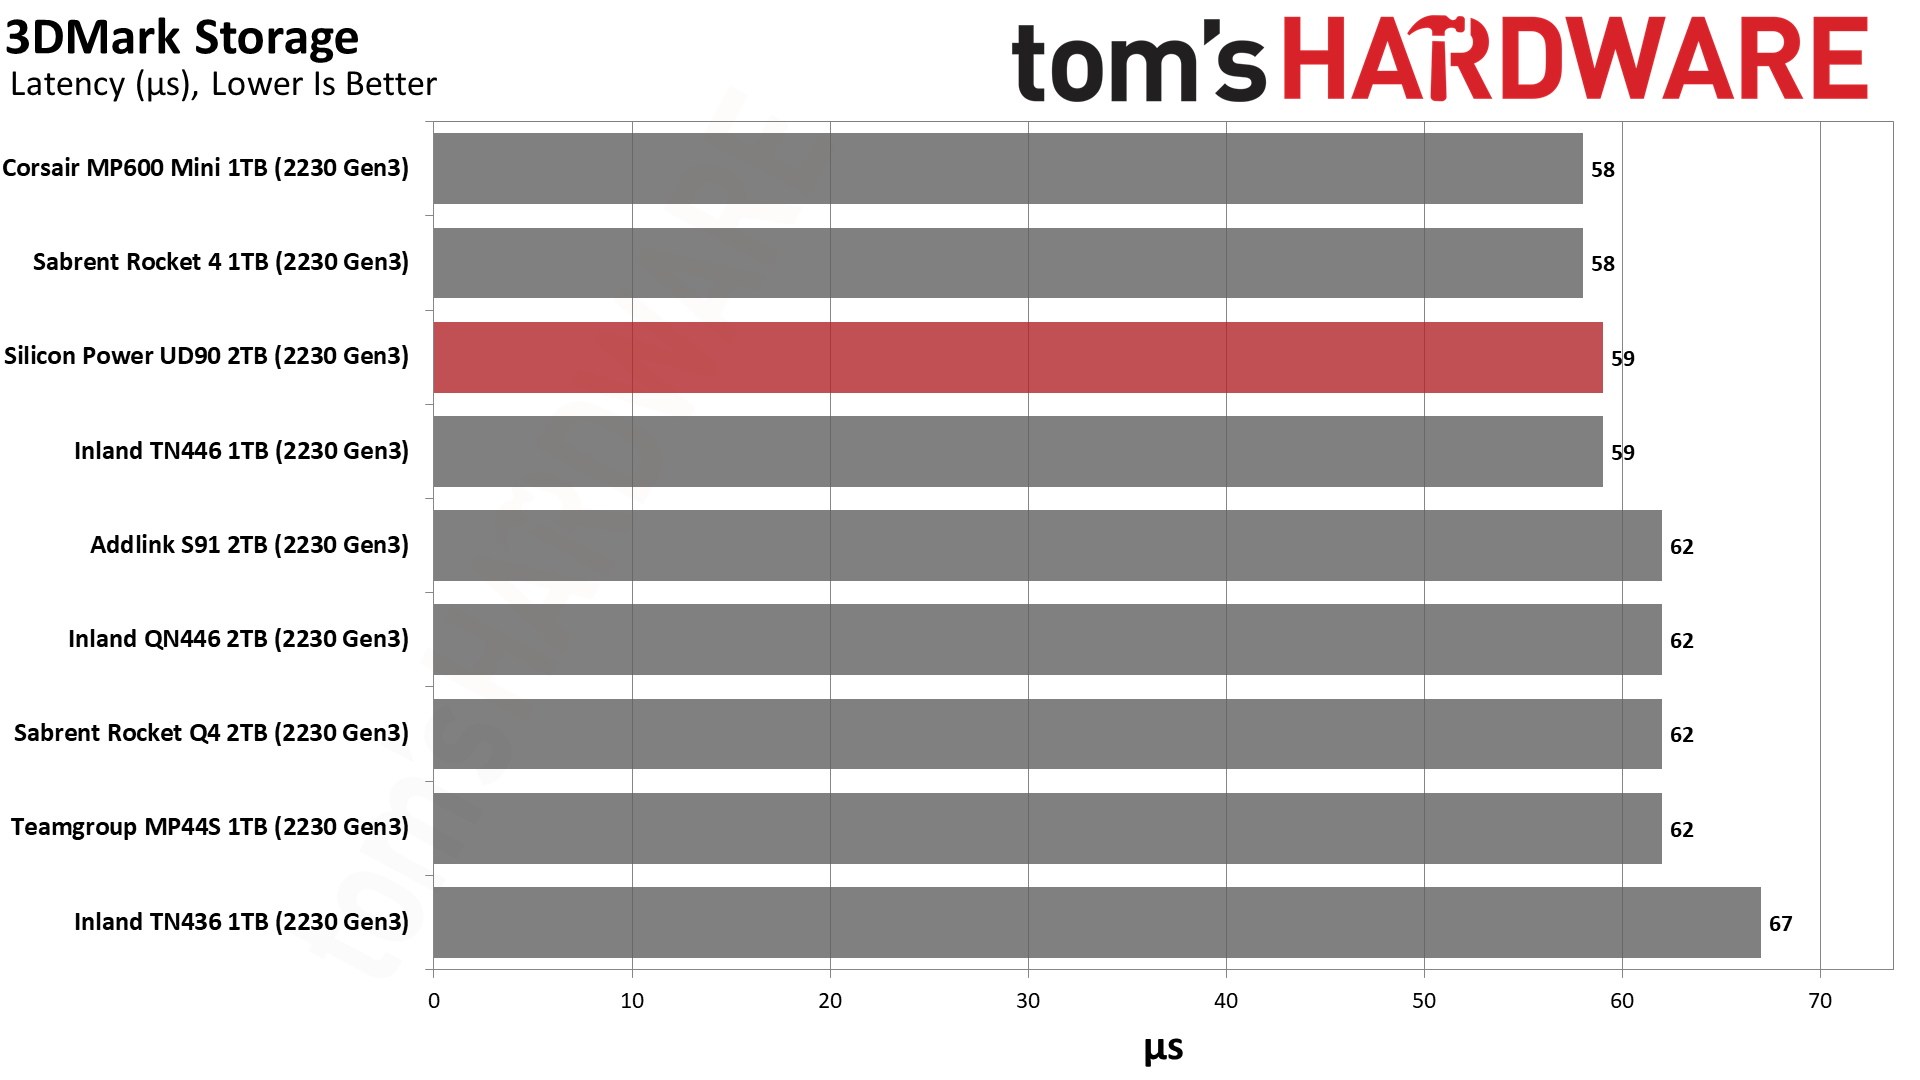
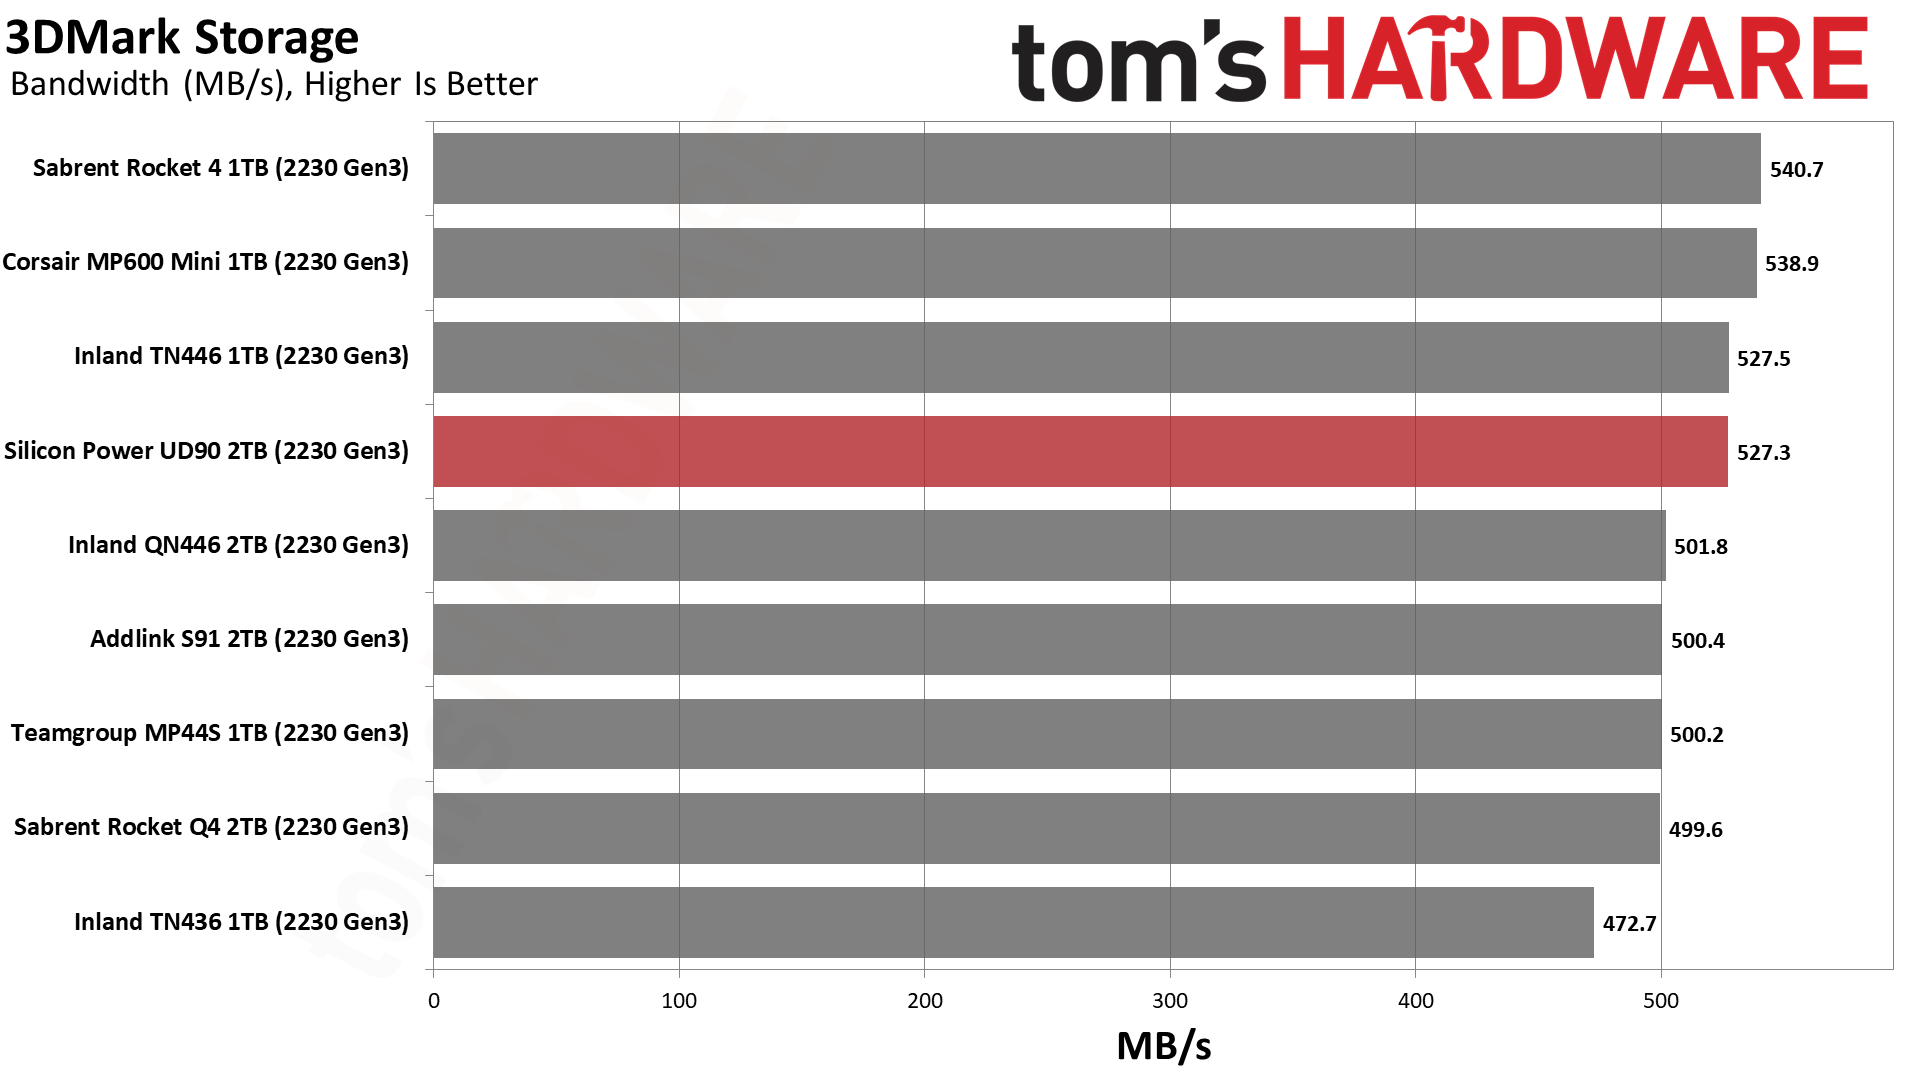
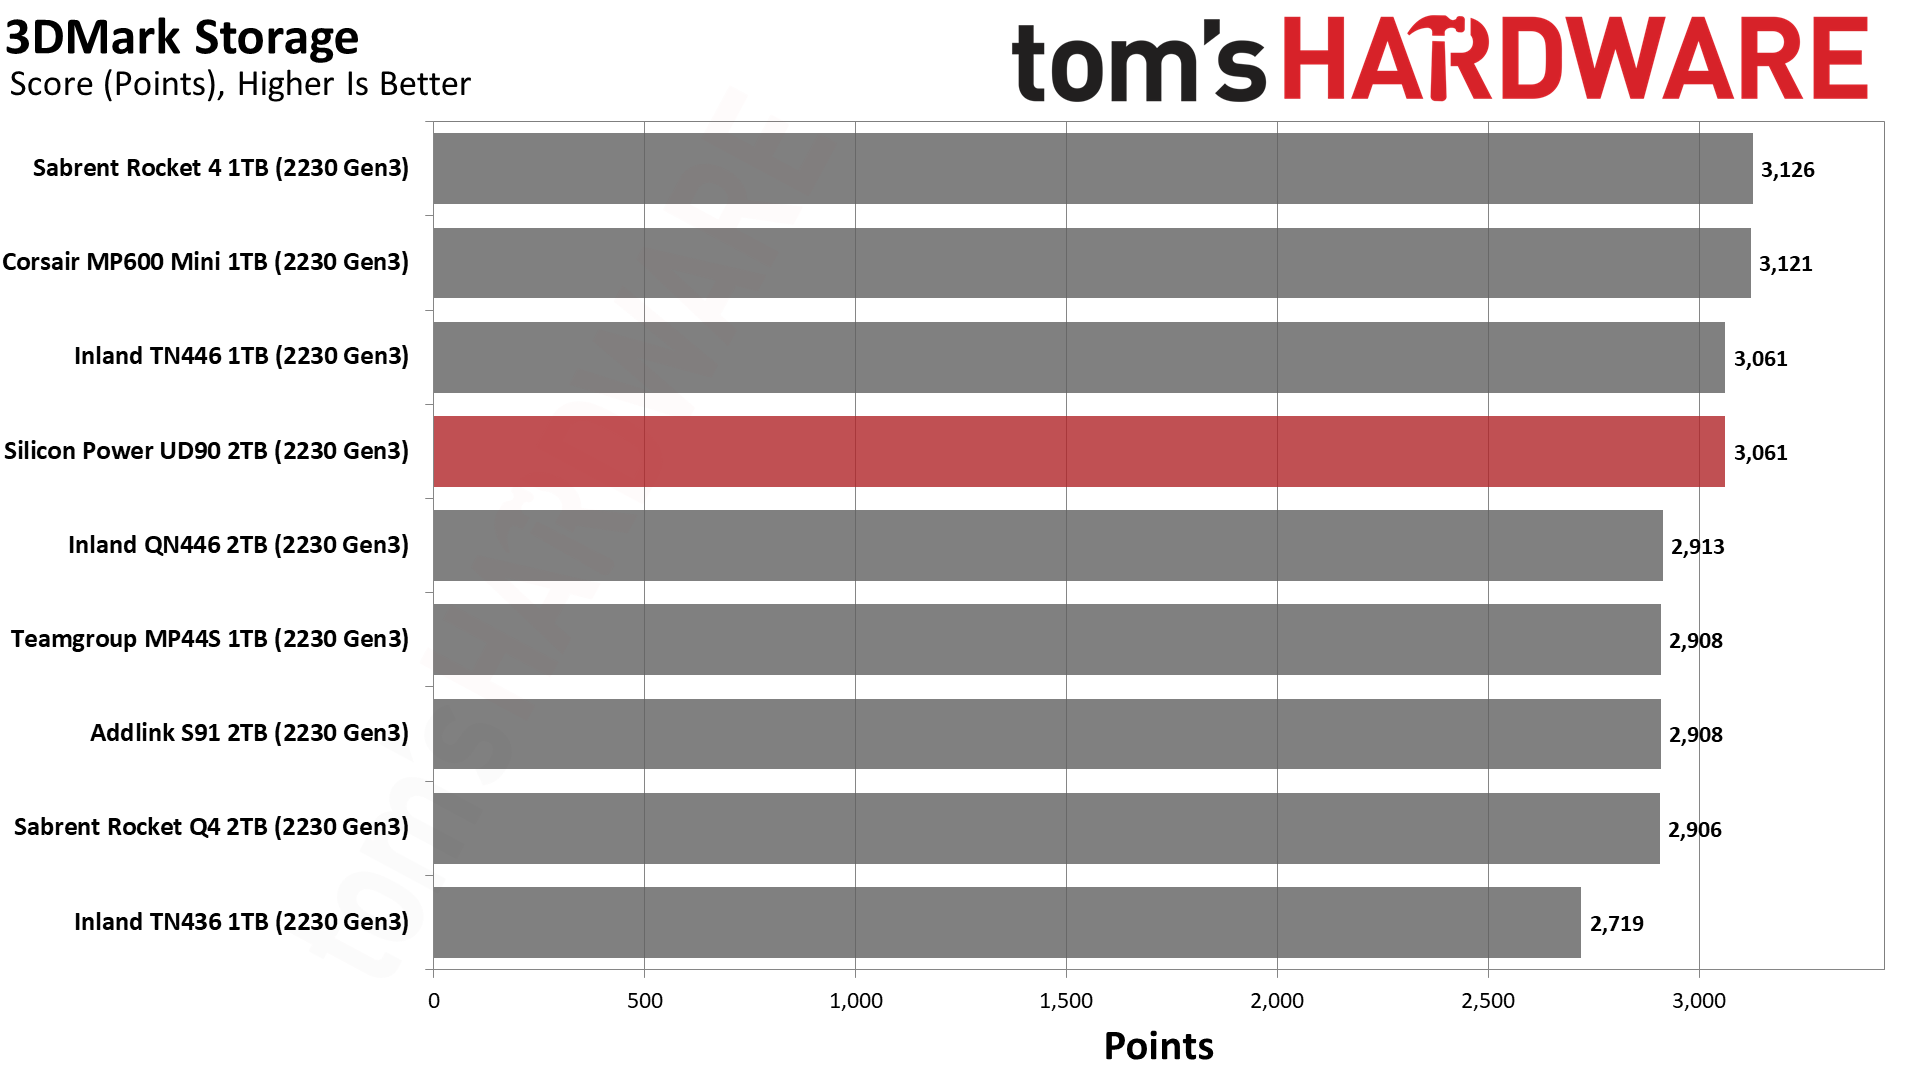
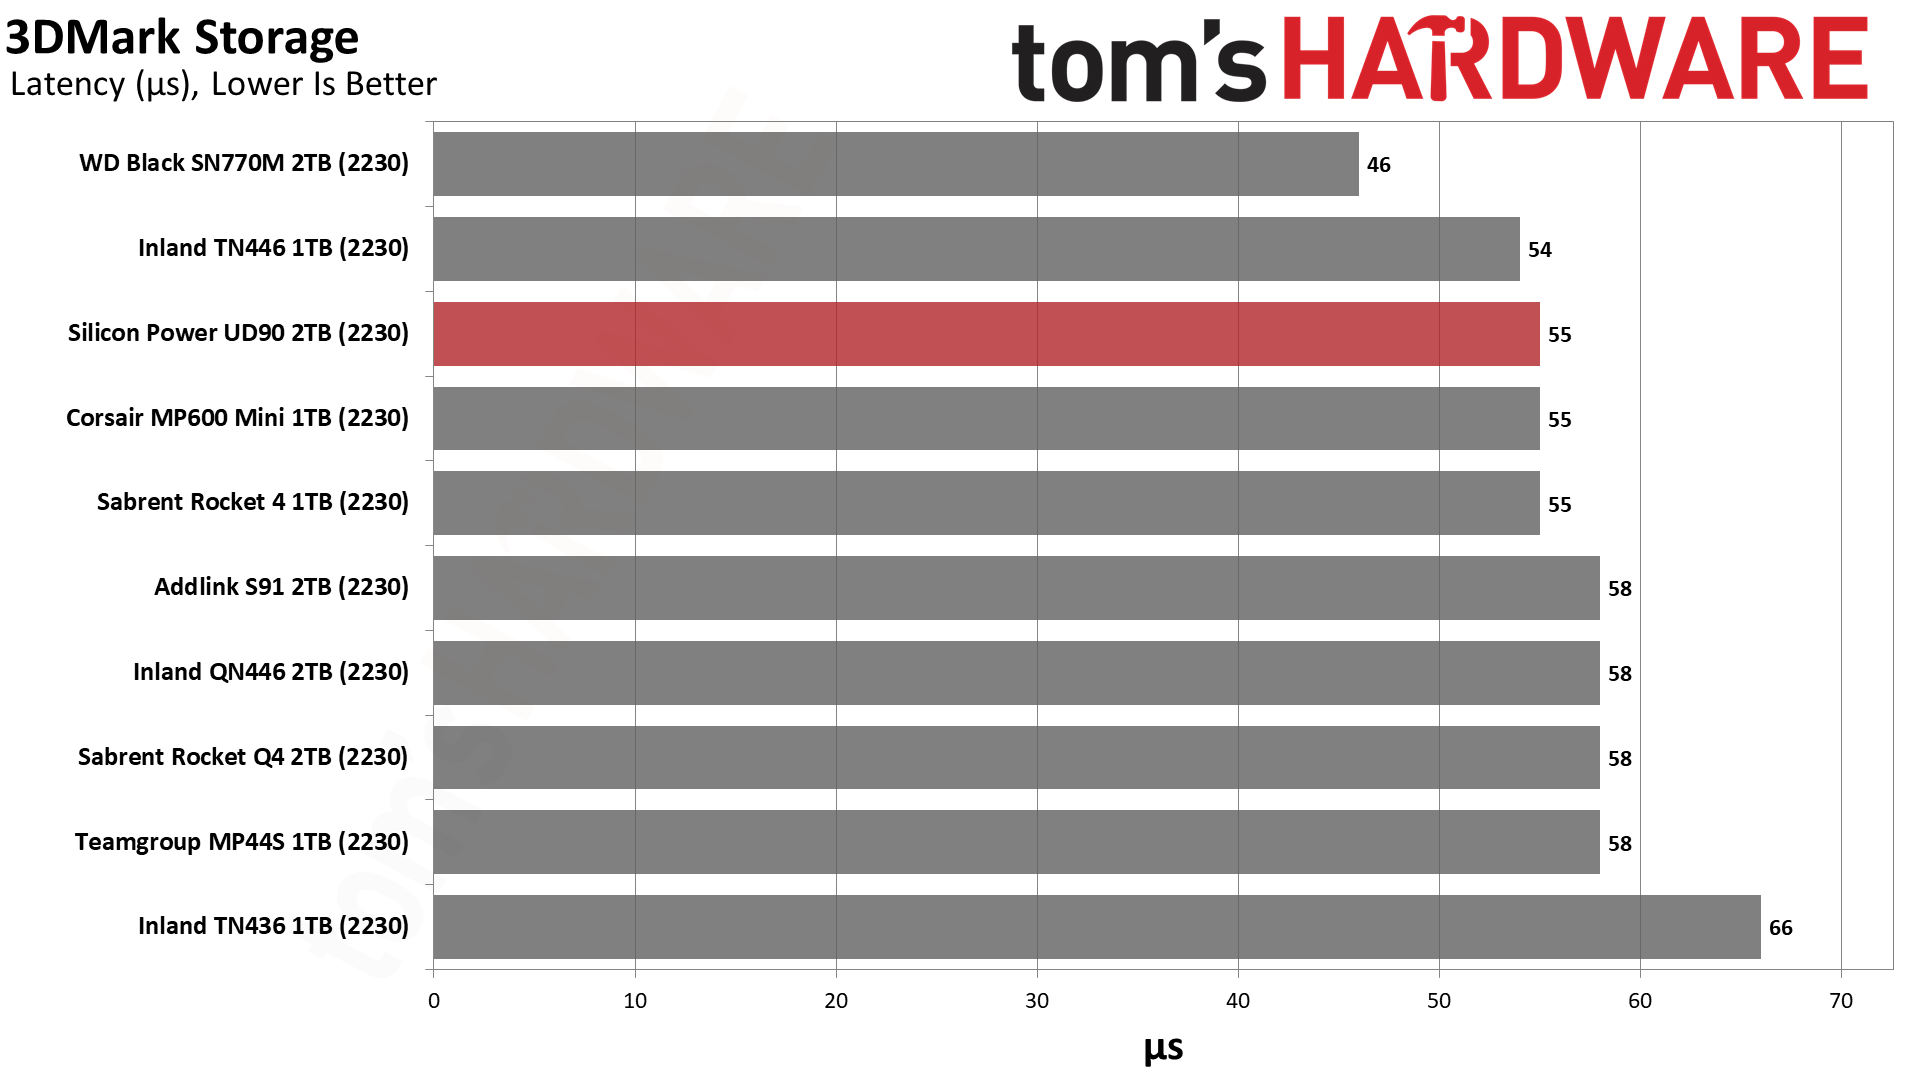
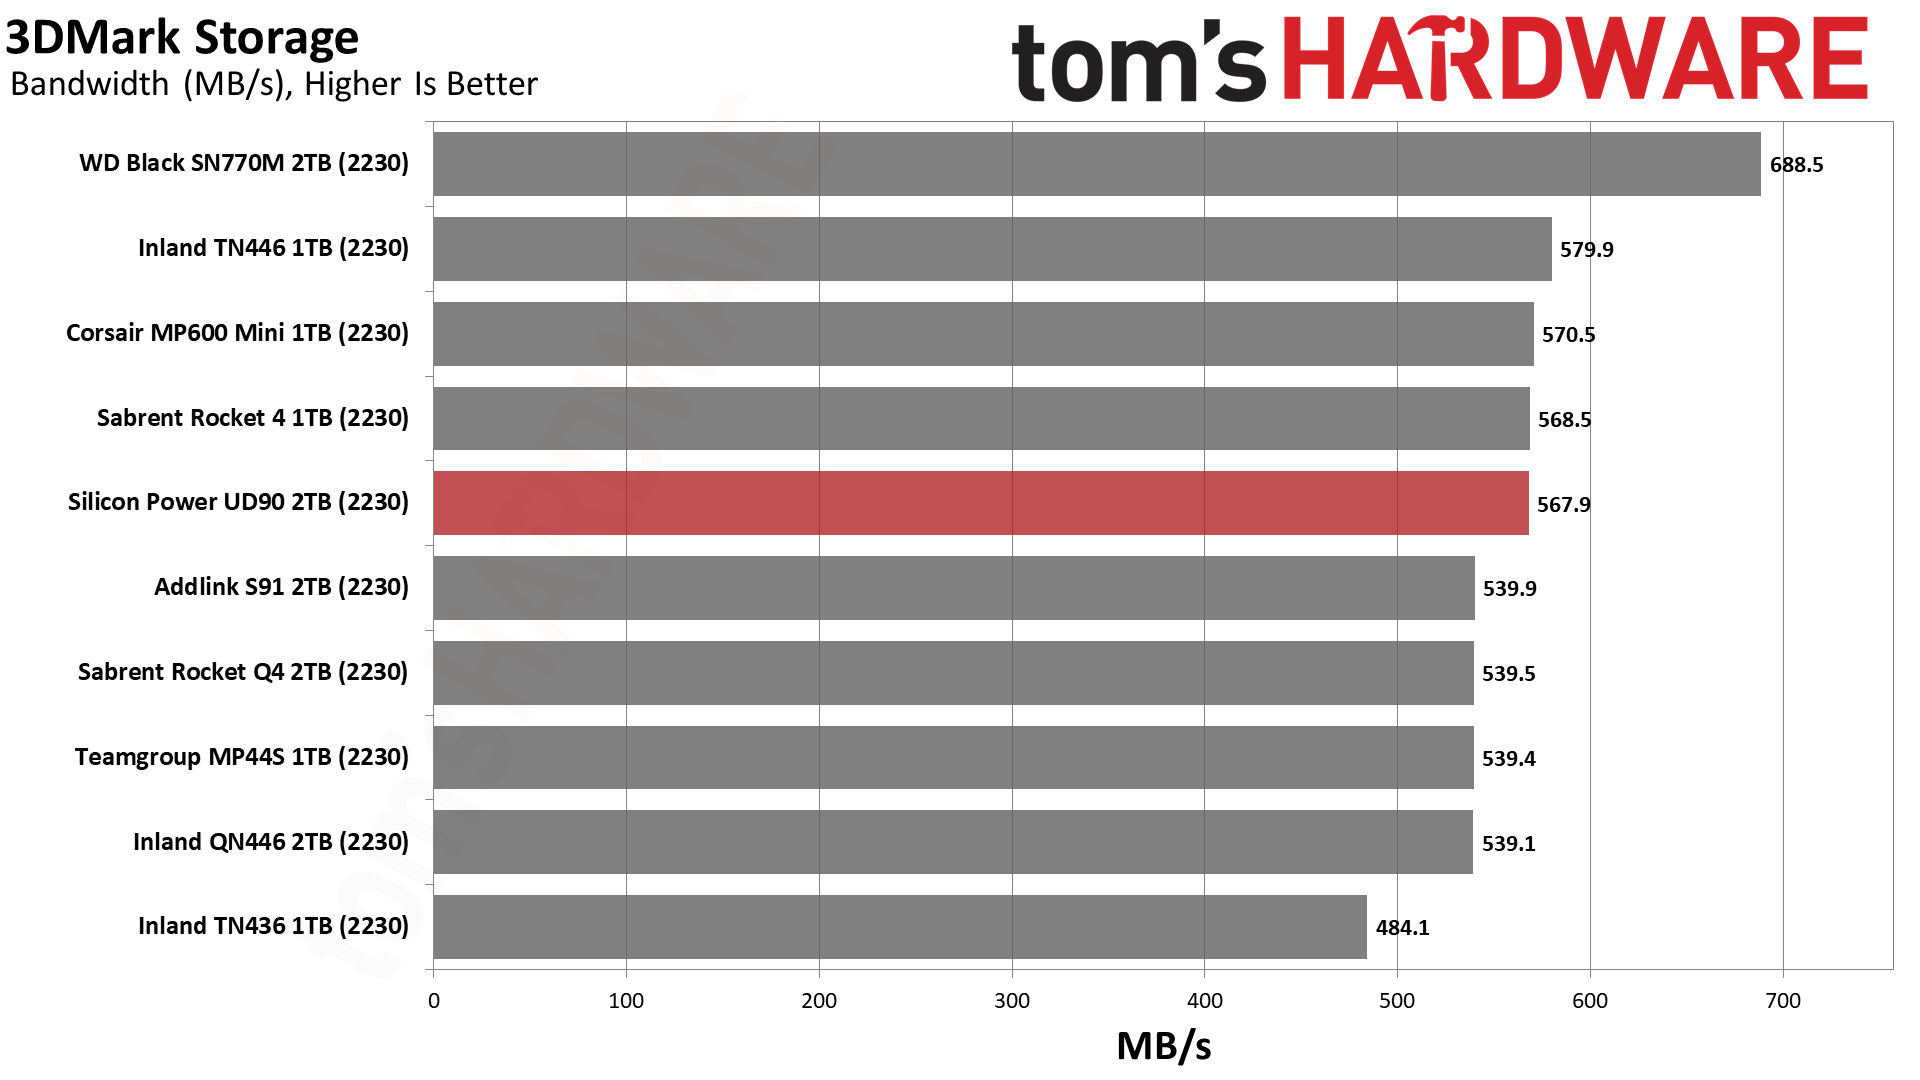
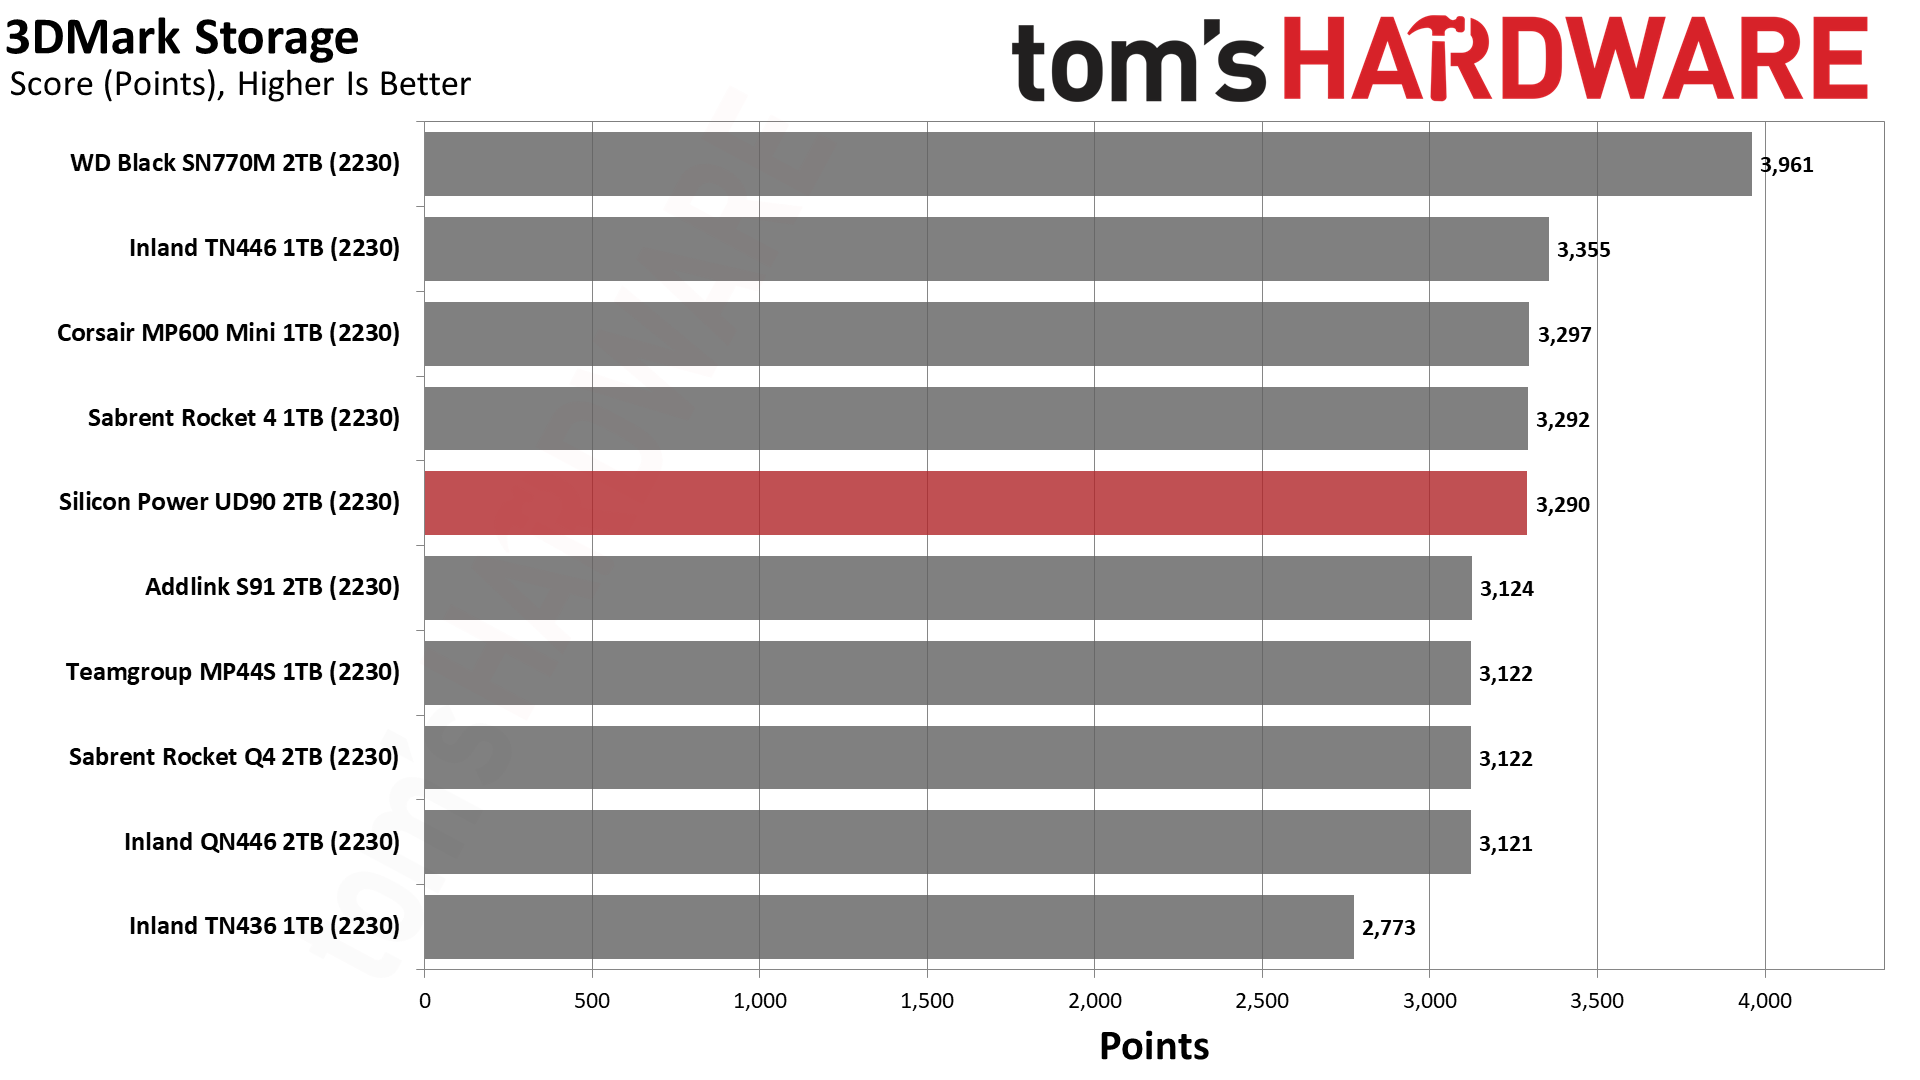
The UD90 2230 performs adequately in 3DMark and, in fact, appears to do better than the other QLC drives tested.
PC Trace Testing – PCMark 10 Storage Benchmark
PCMark 10 is a trace-based benchmark that uses a wide-ranging set of real-world traces from popular applications and everyday tasks to measure the performance of storage devices.
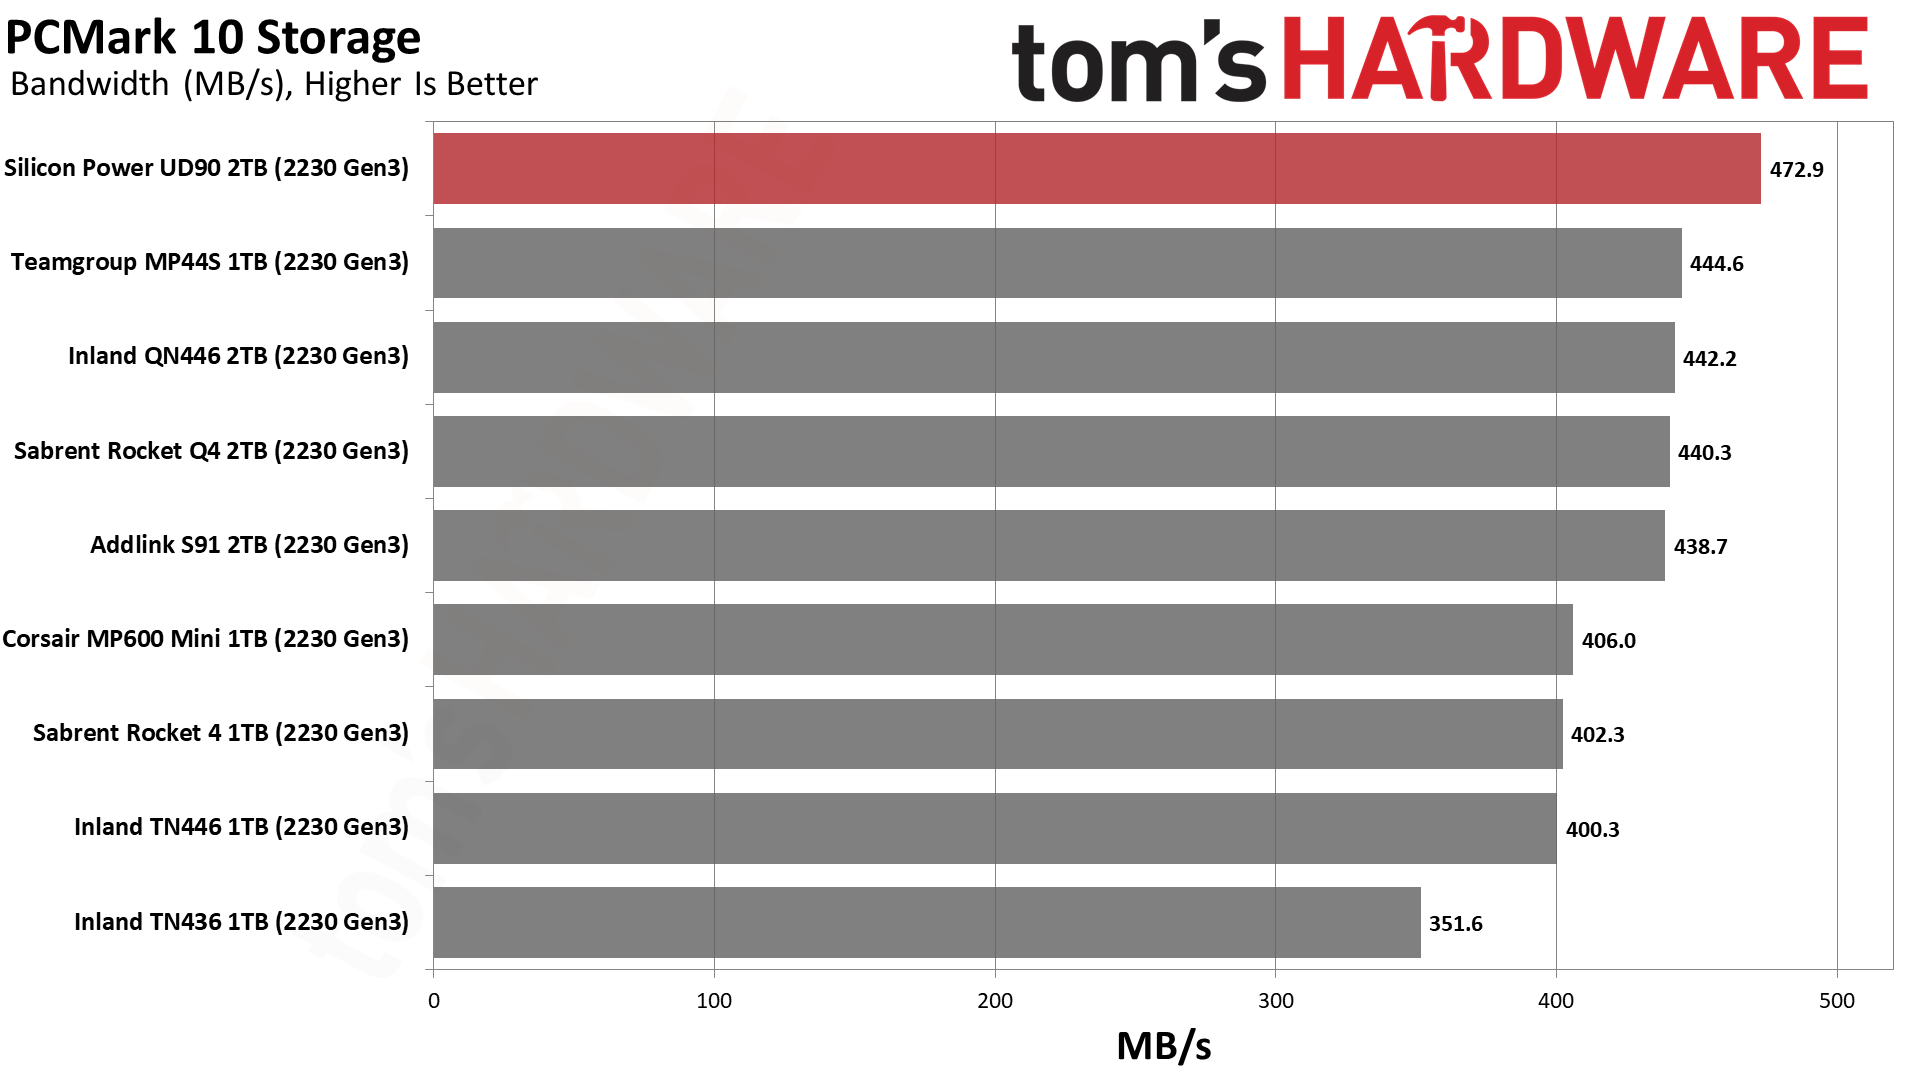
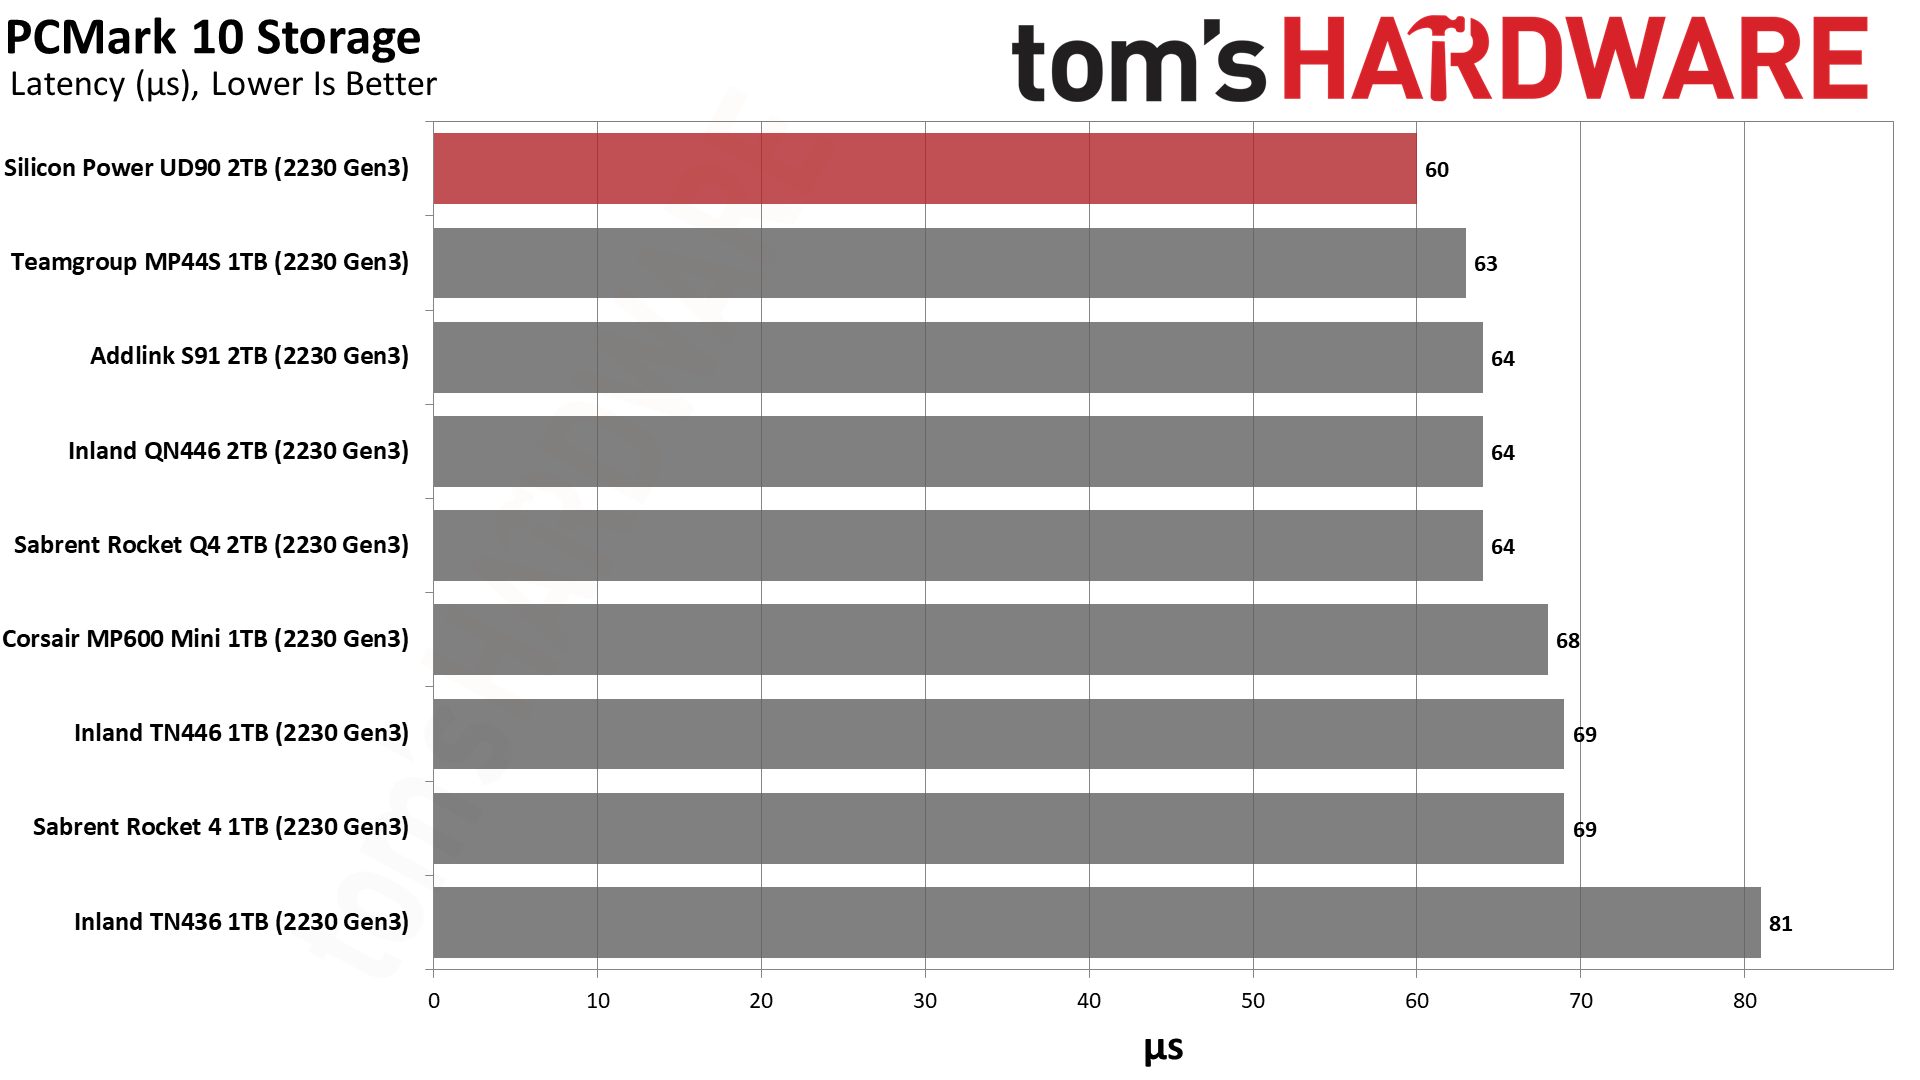
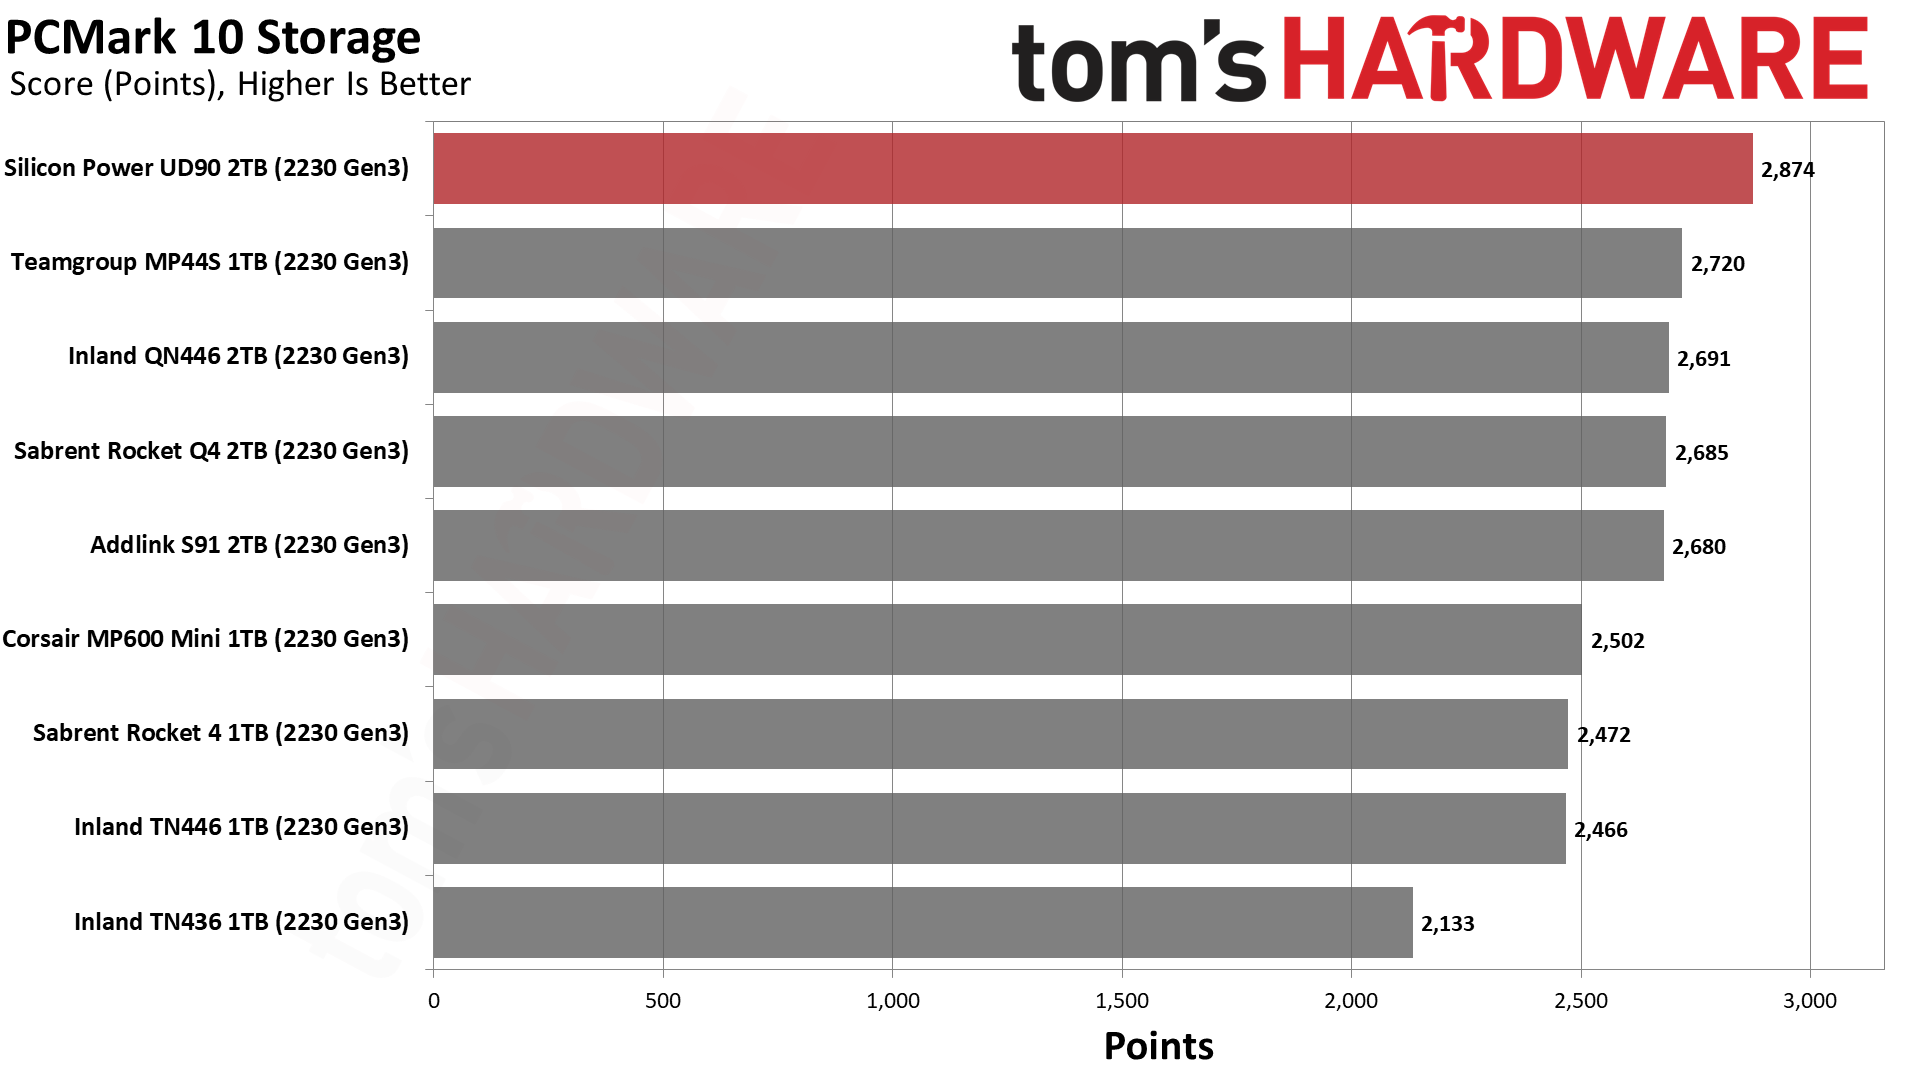
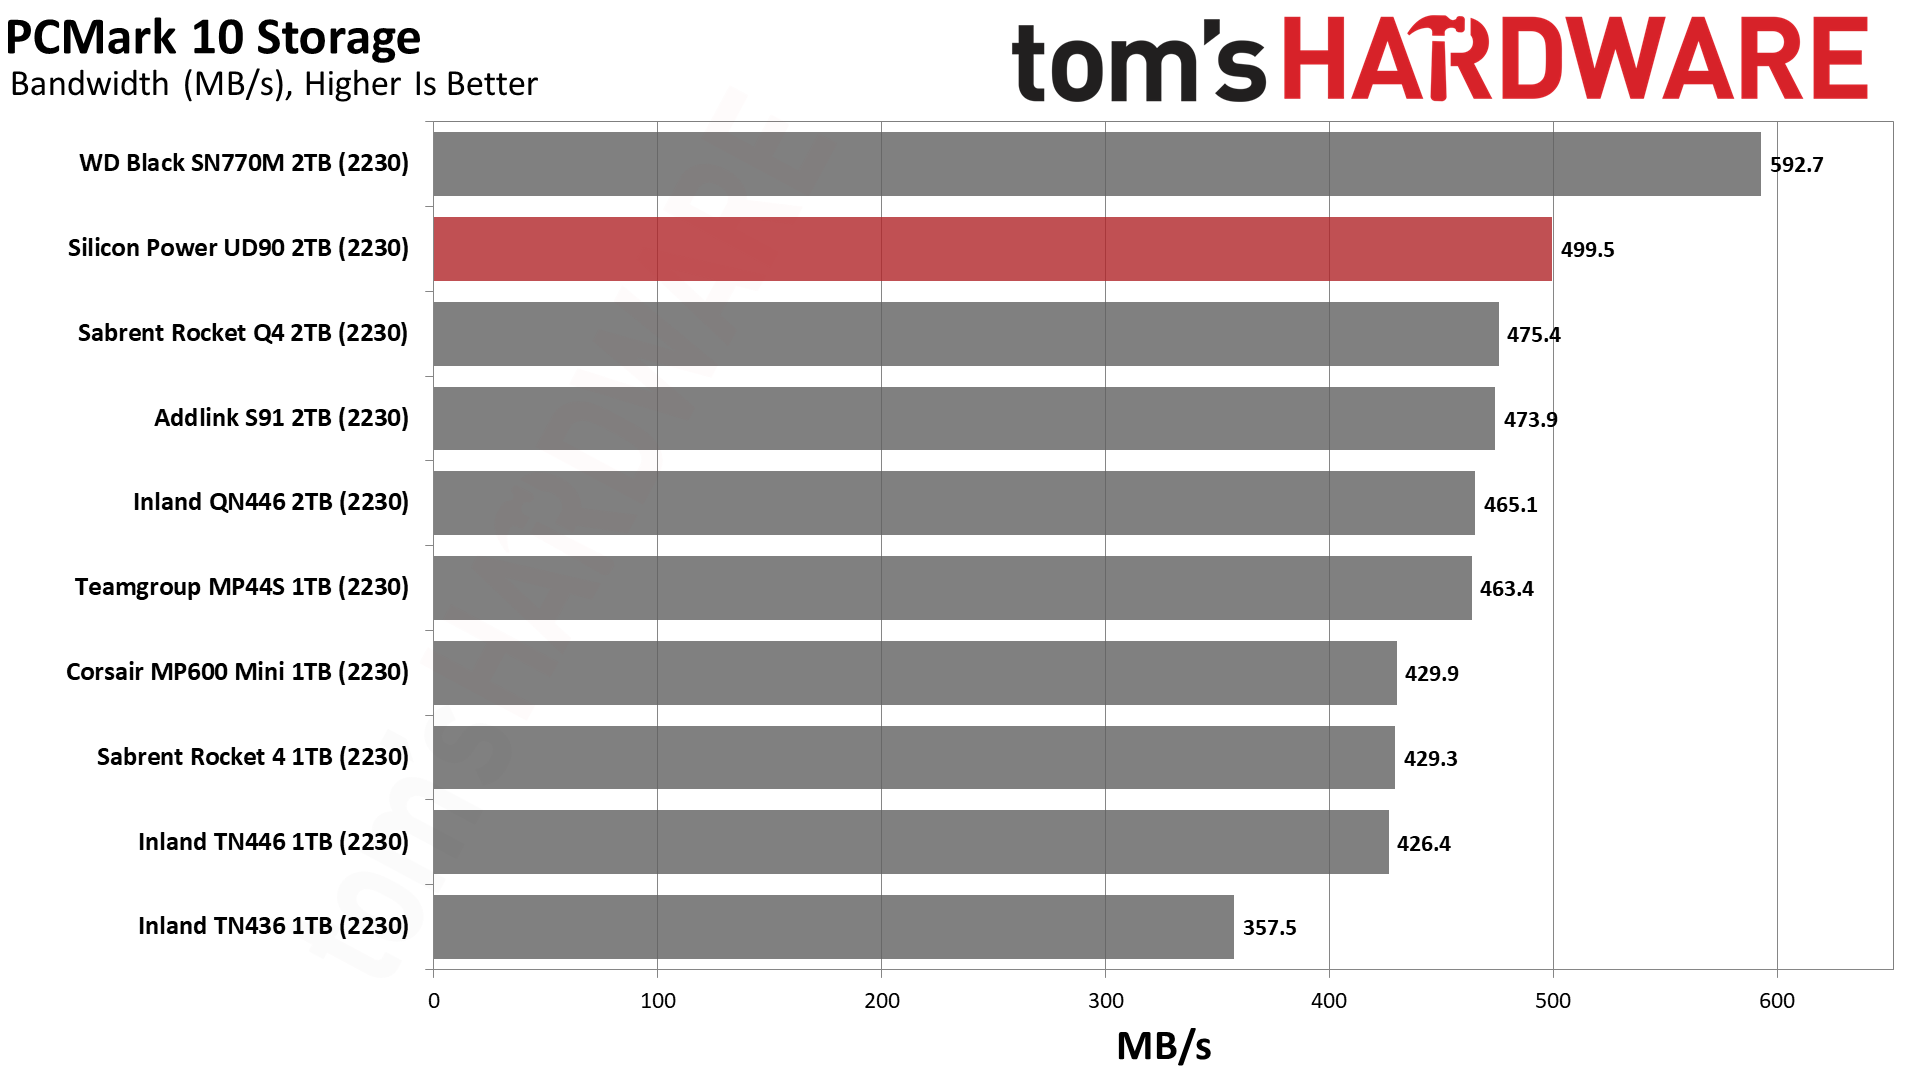
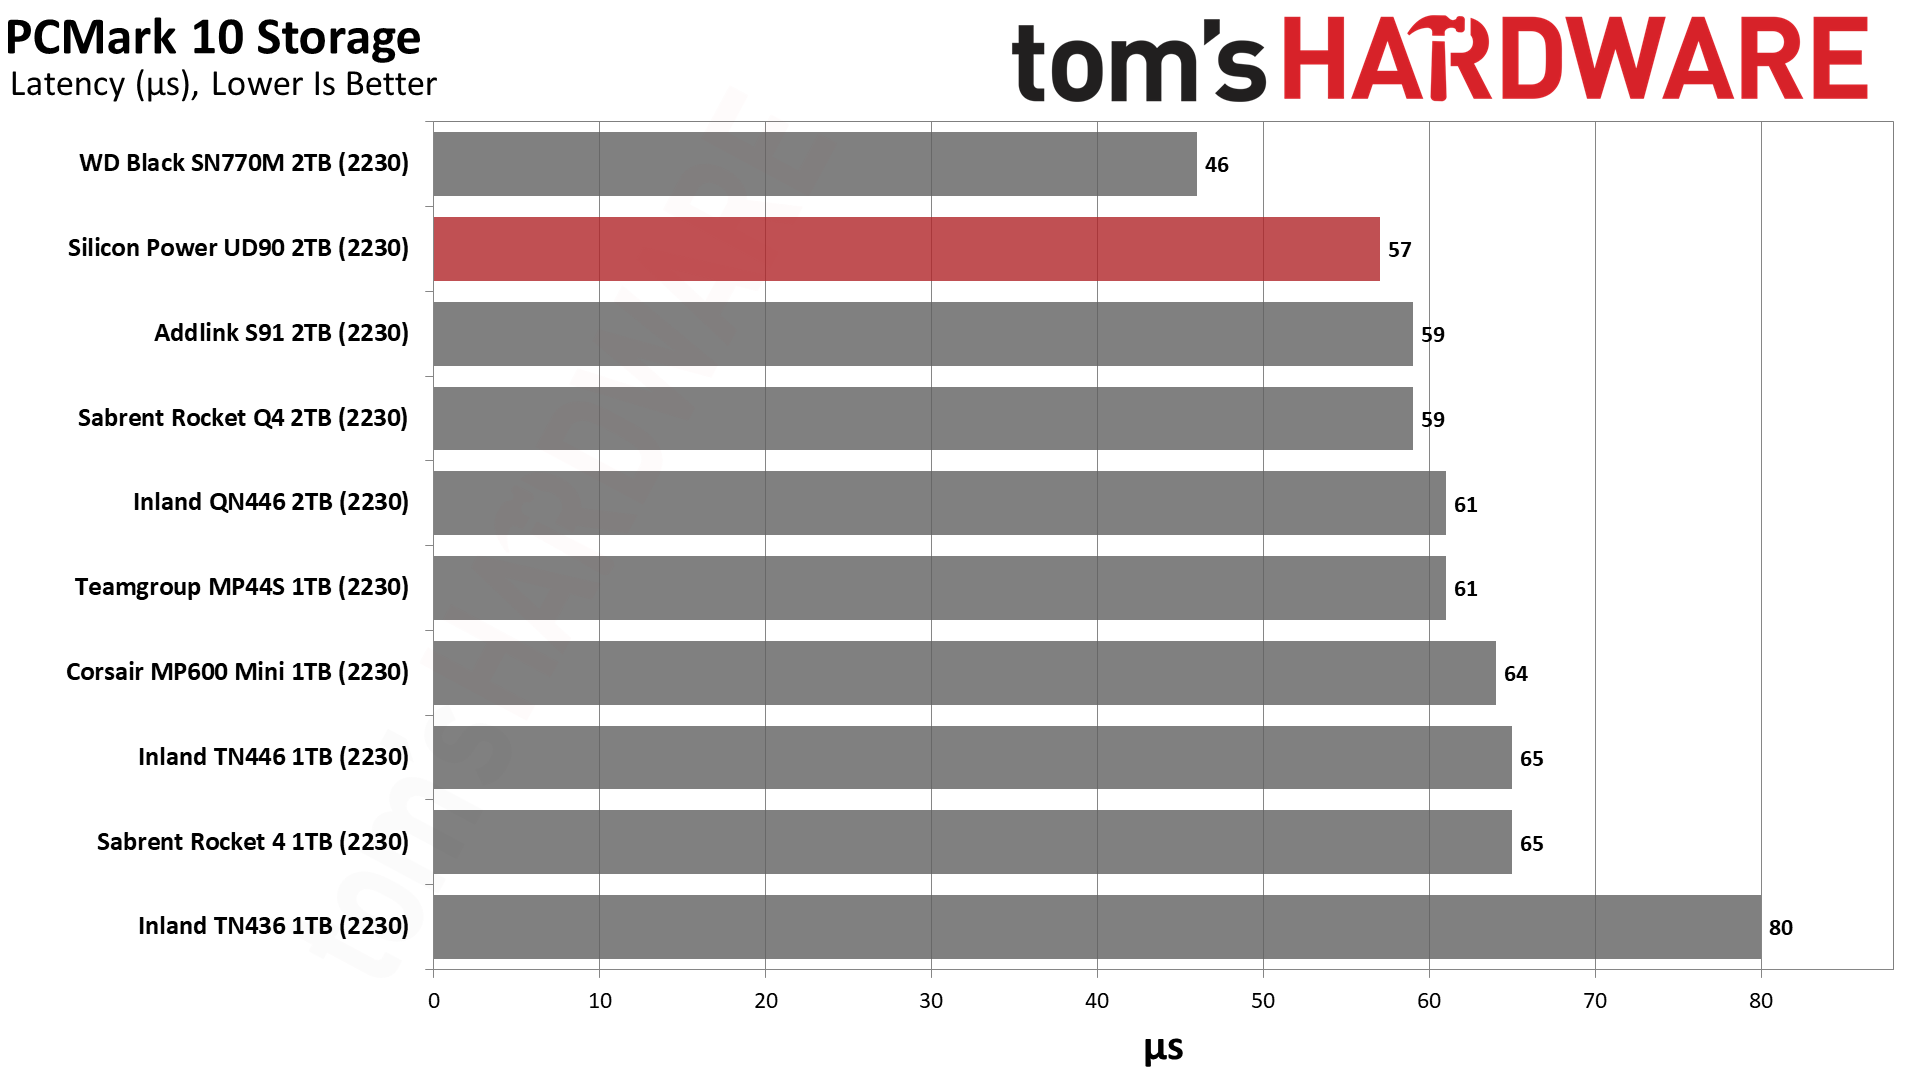
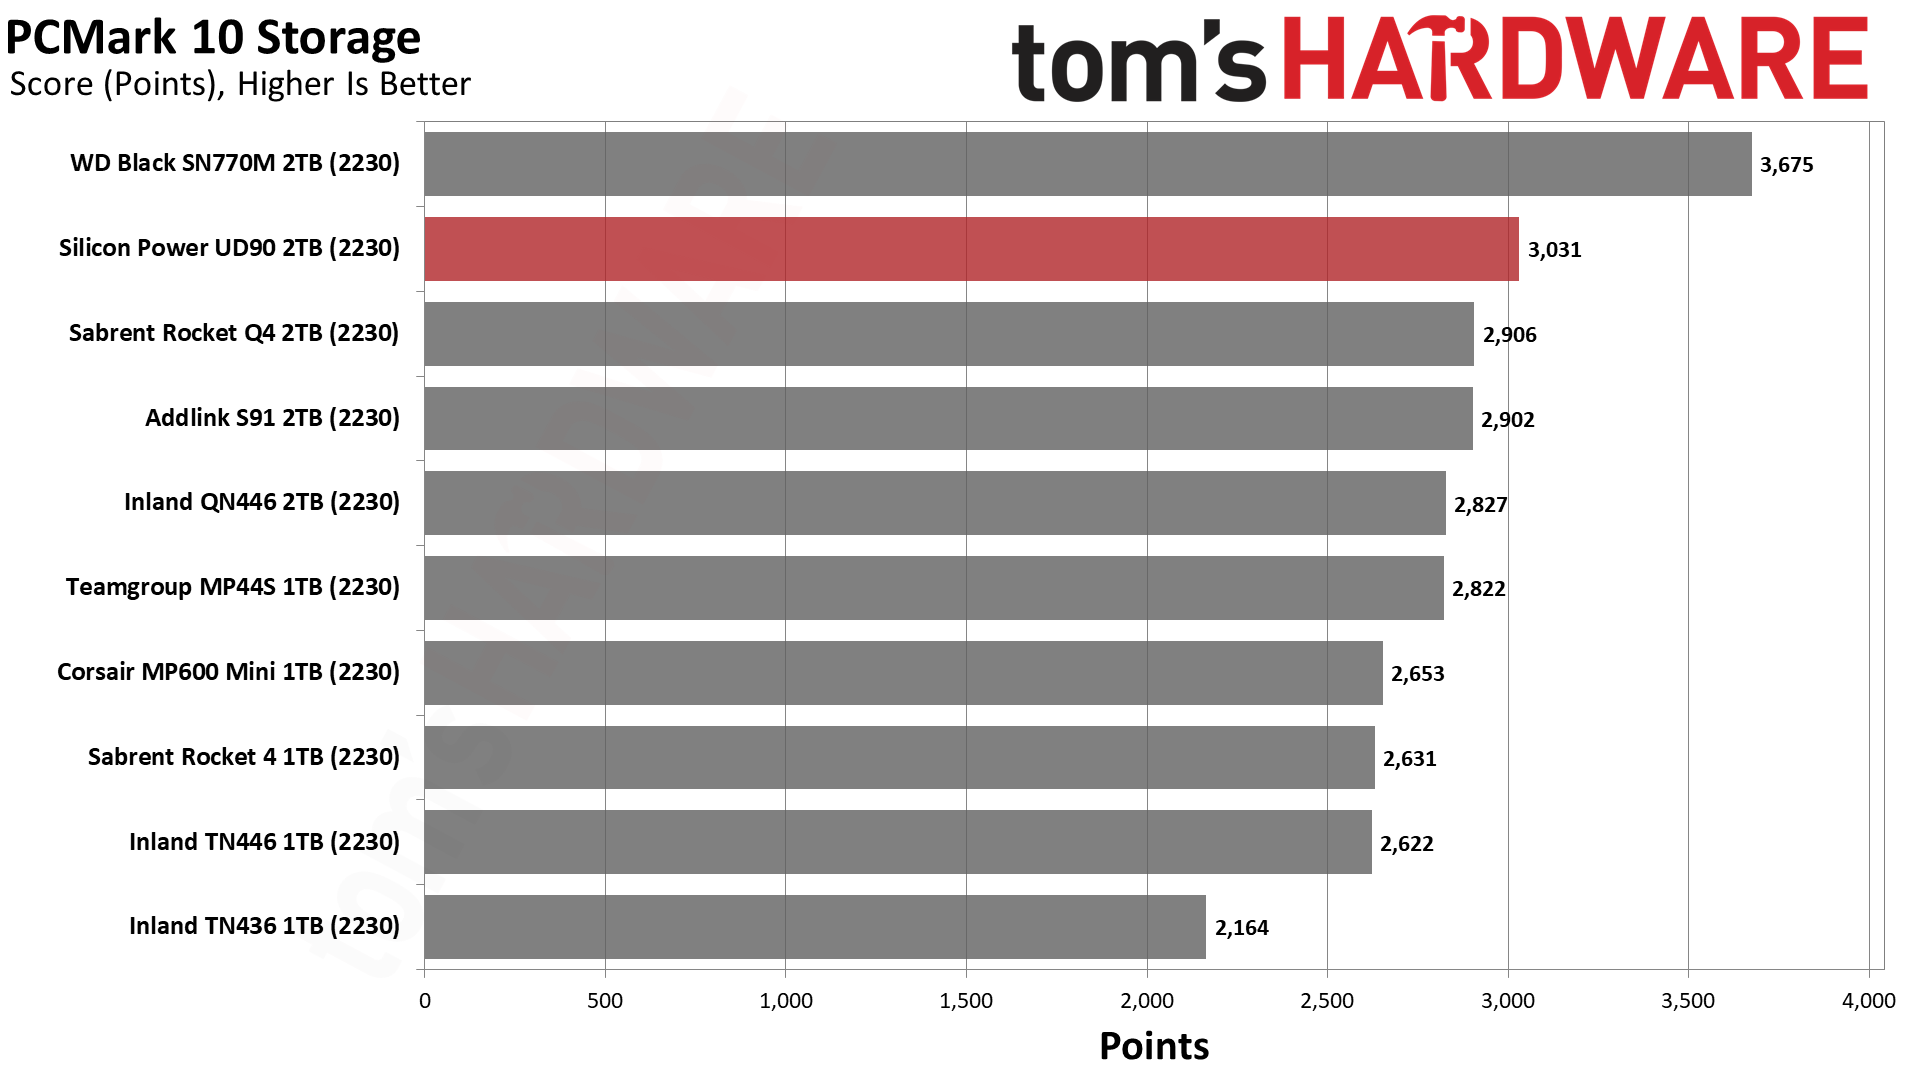
The UD90 2230 performs excellently in PCMark 10, punching above its weight as it leads in several of the most critical benchmark categories.
PC Transfer Rates – DiskBench
We use the DiskBench storage benchmarking tool to test file transfer performance with a custom, 50GB dataset. We copy 31,227 files of various types, such as pictures, PDFs, and videos to a new folder and then follow-up with a reading test of a newly-written 6.5GB zip file.
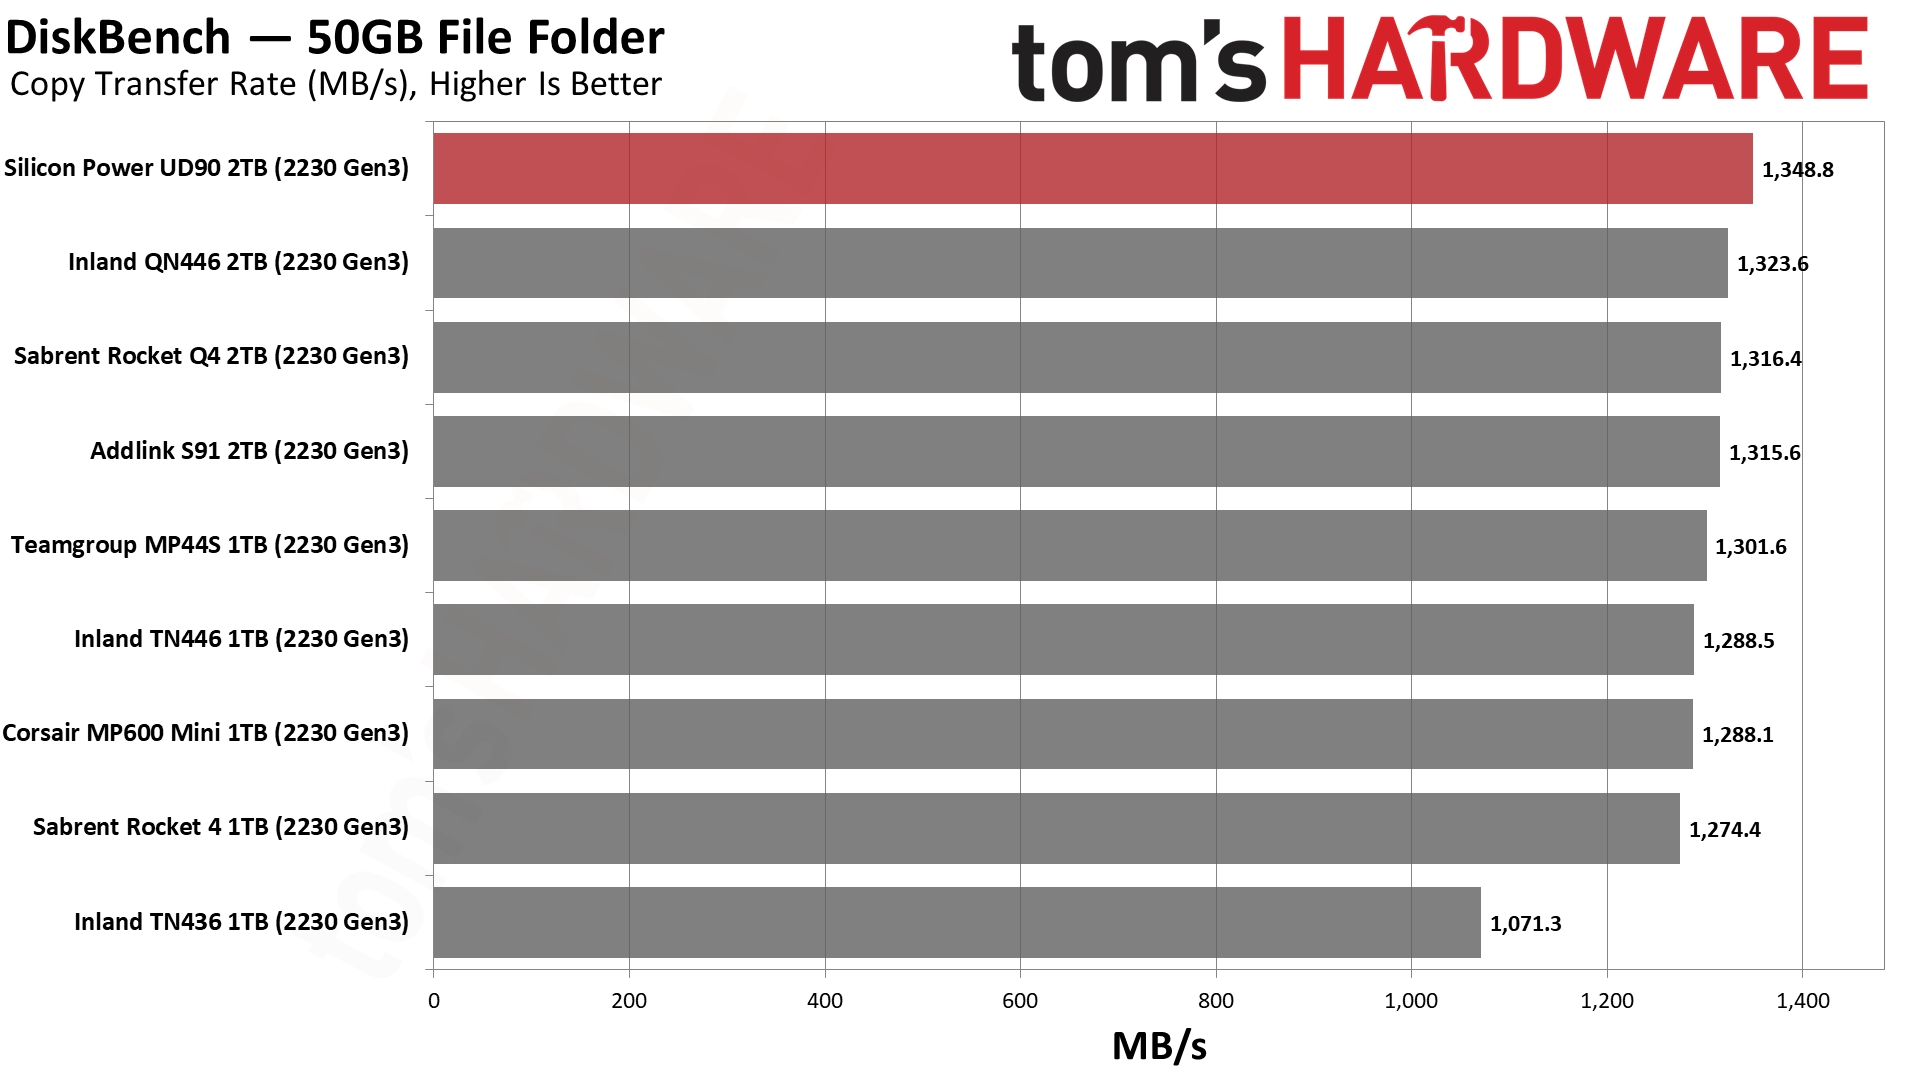
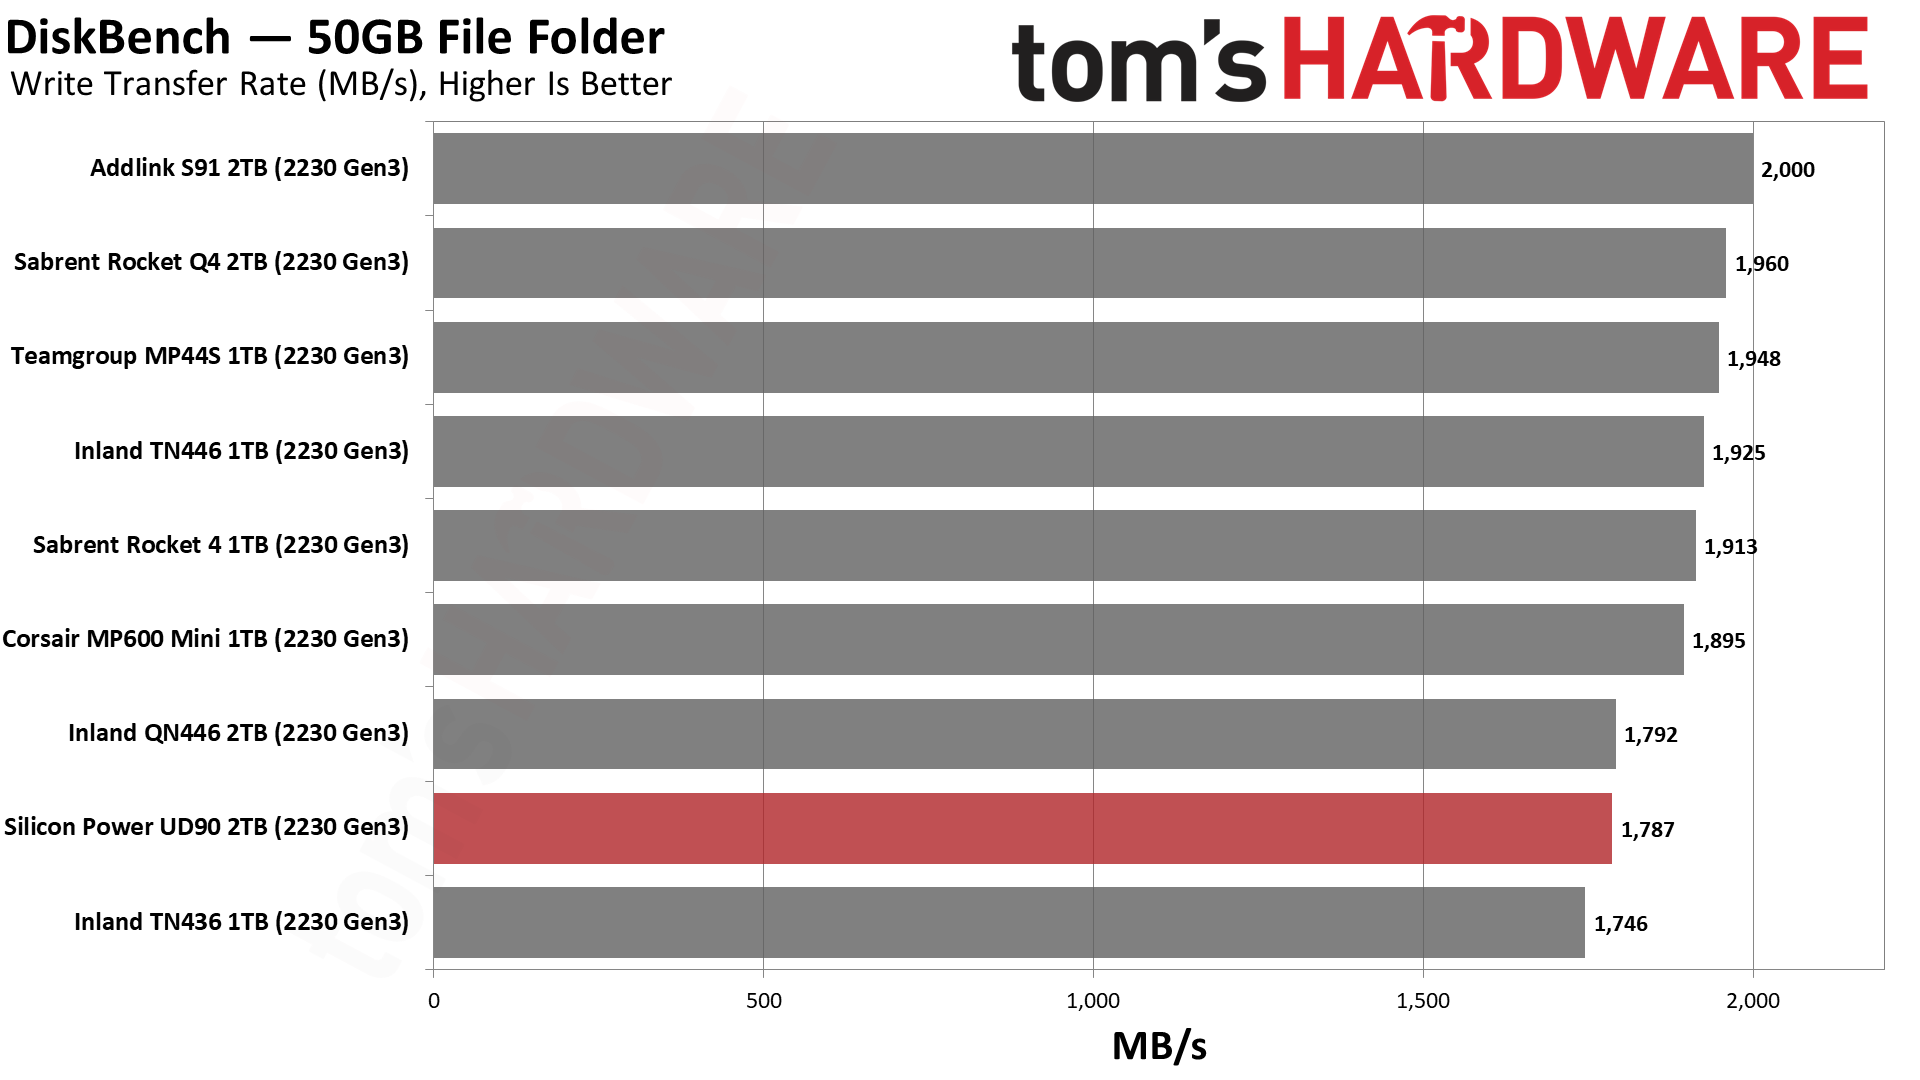
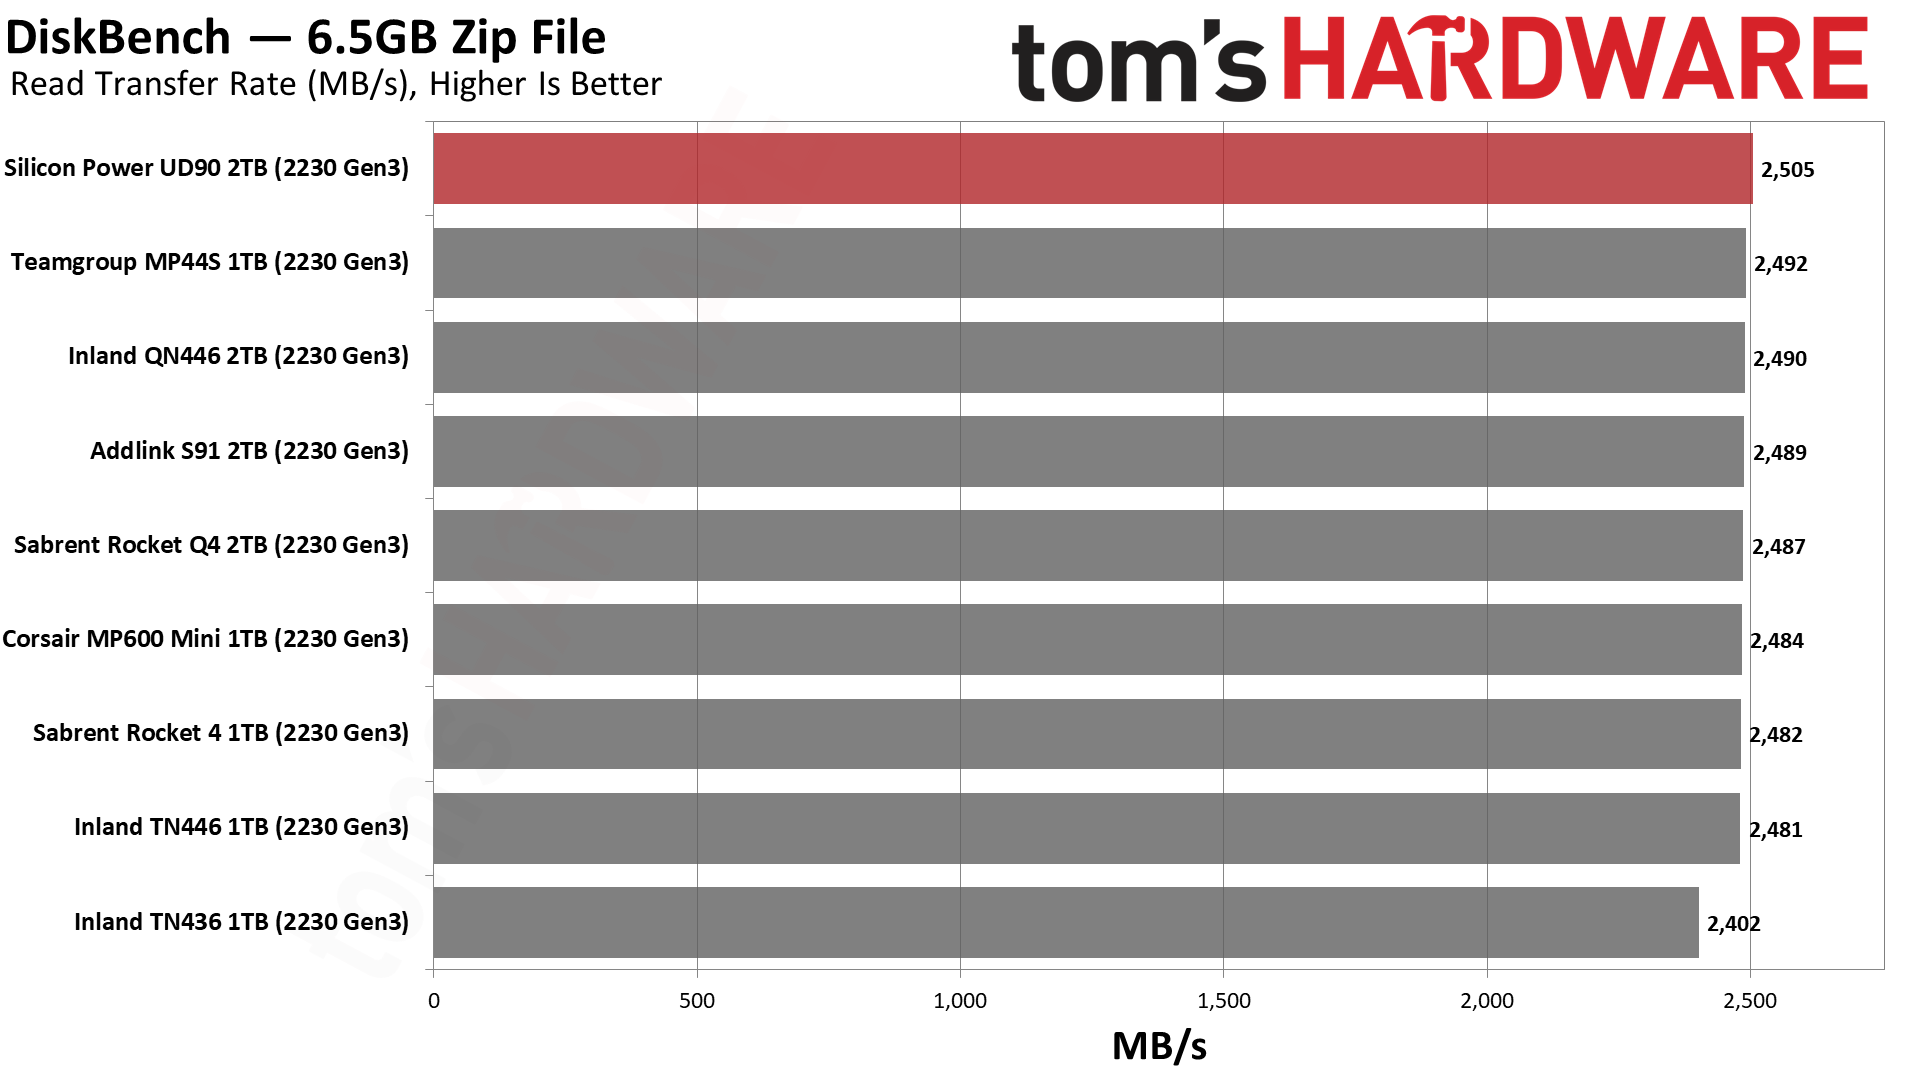
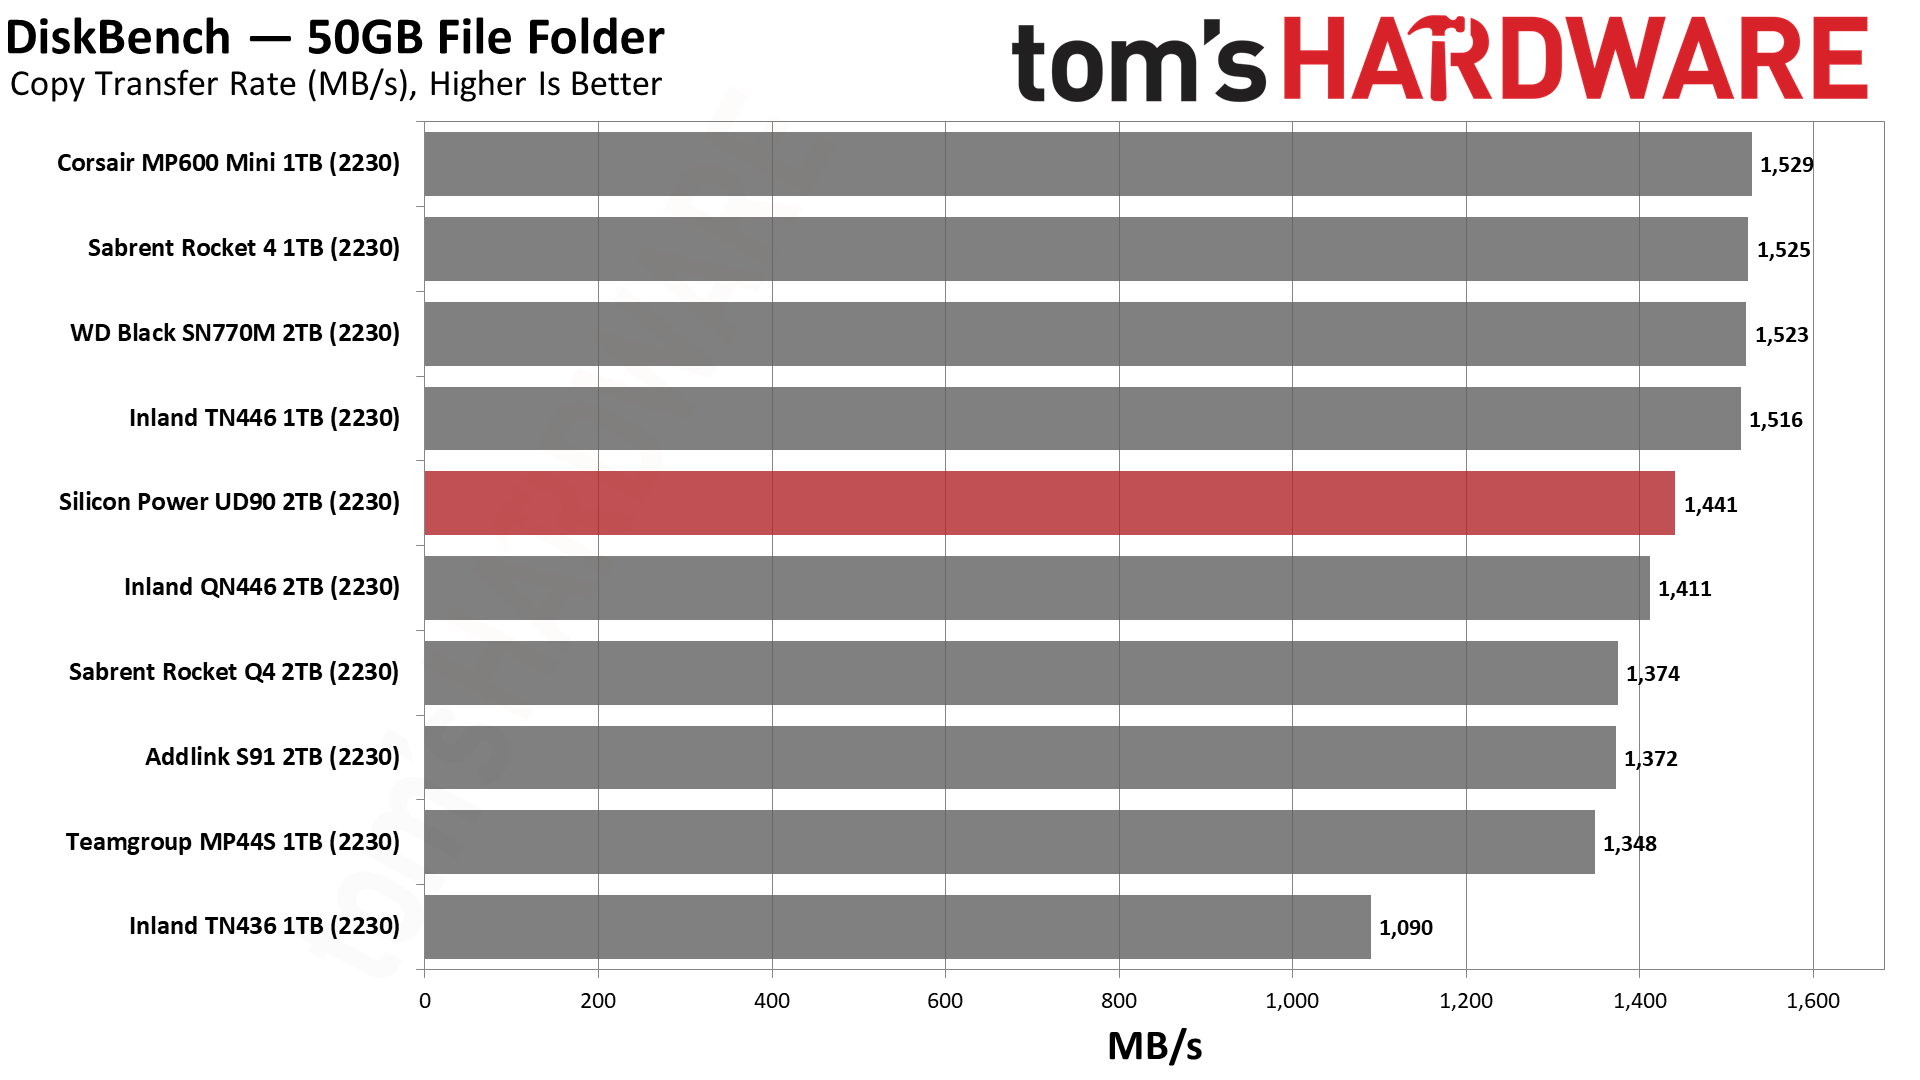
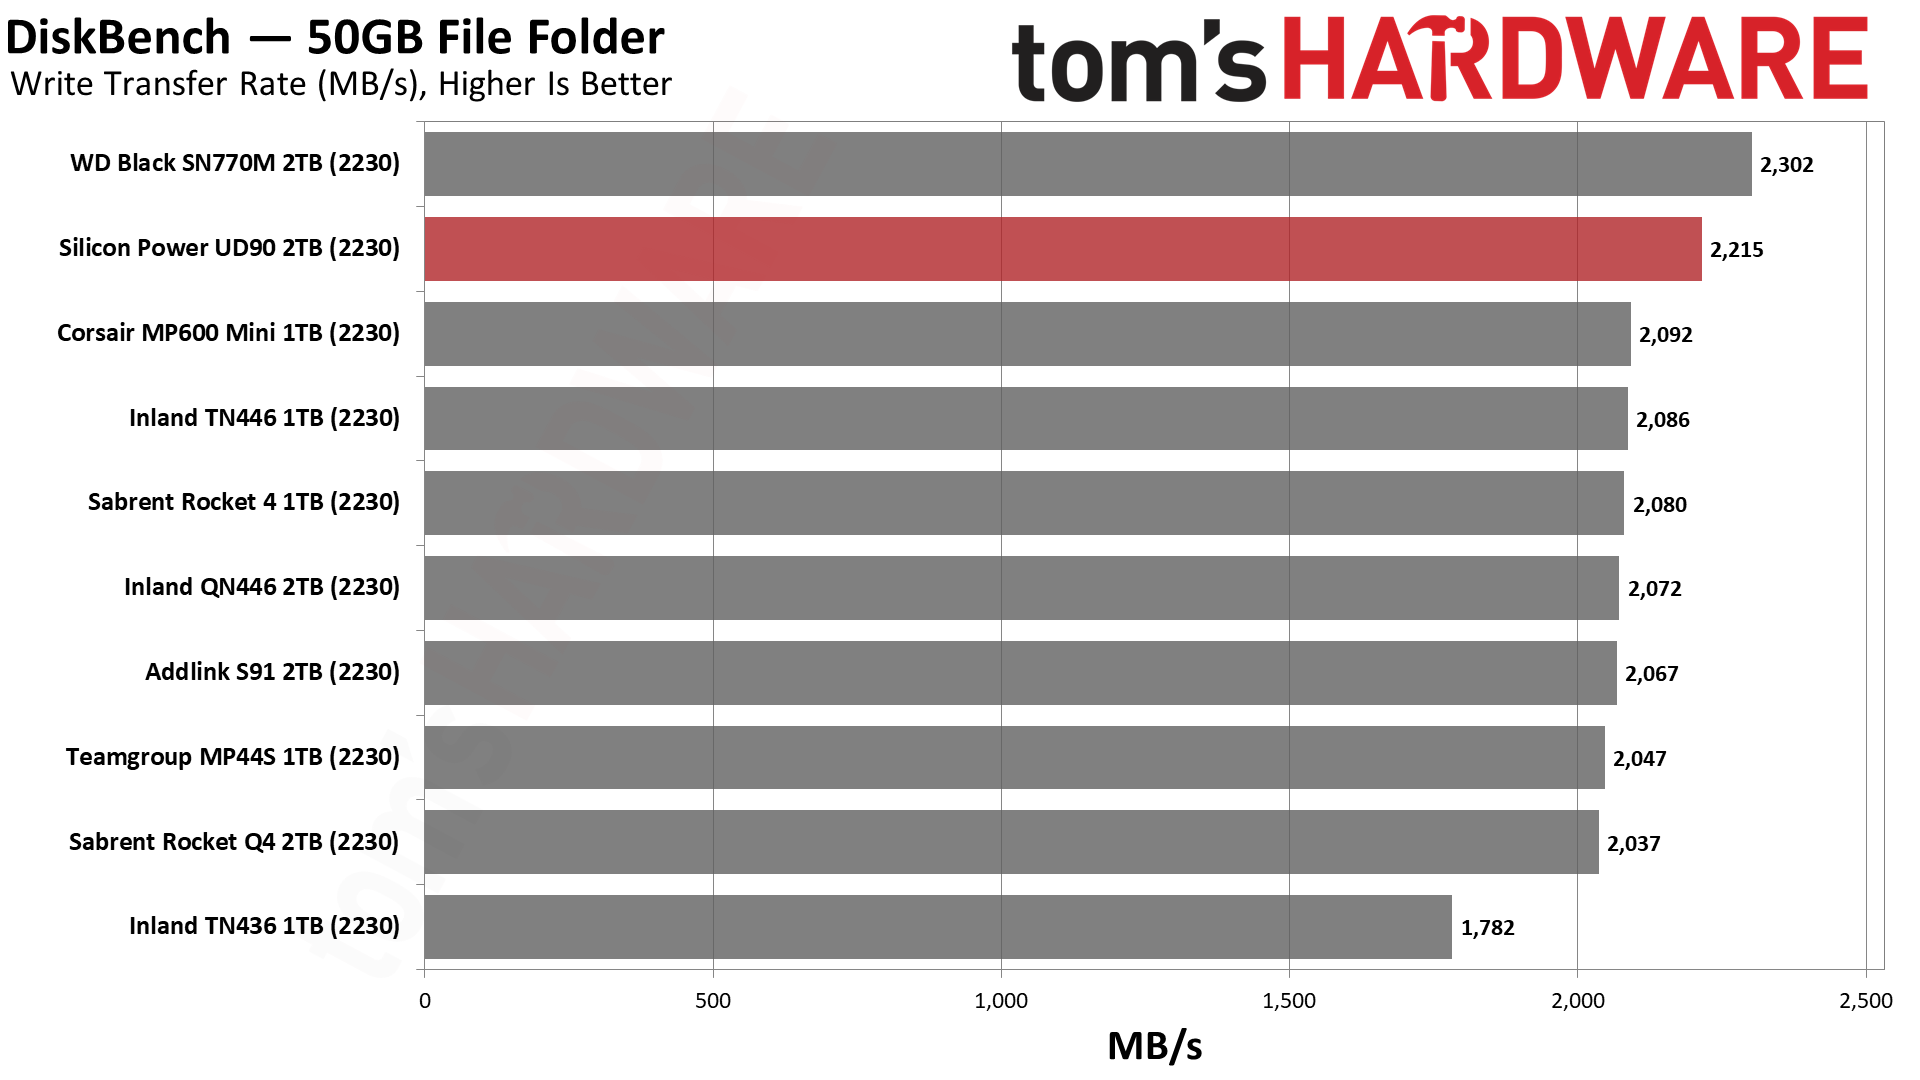
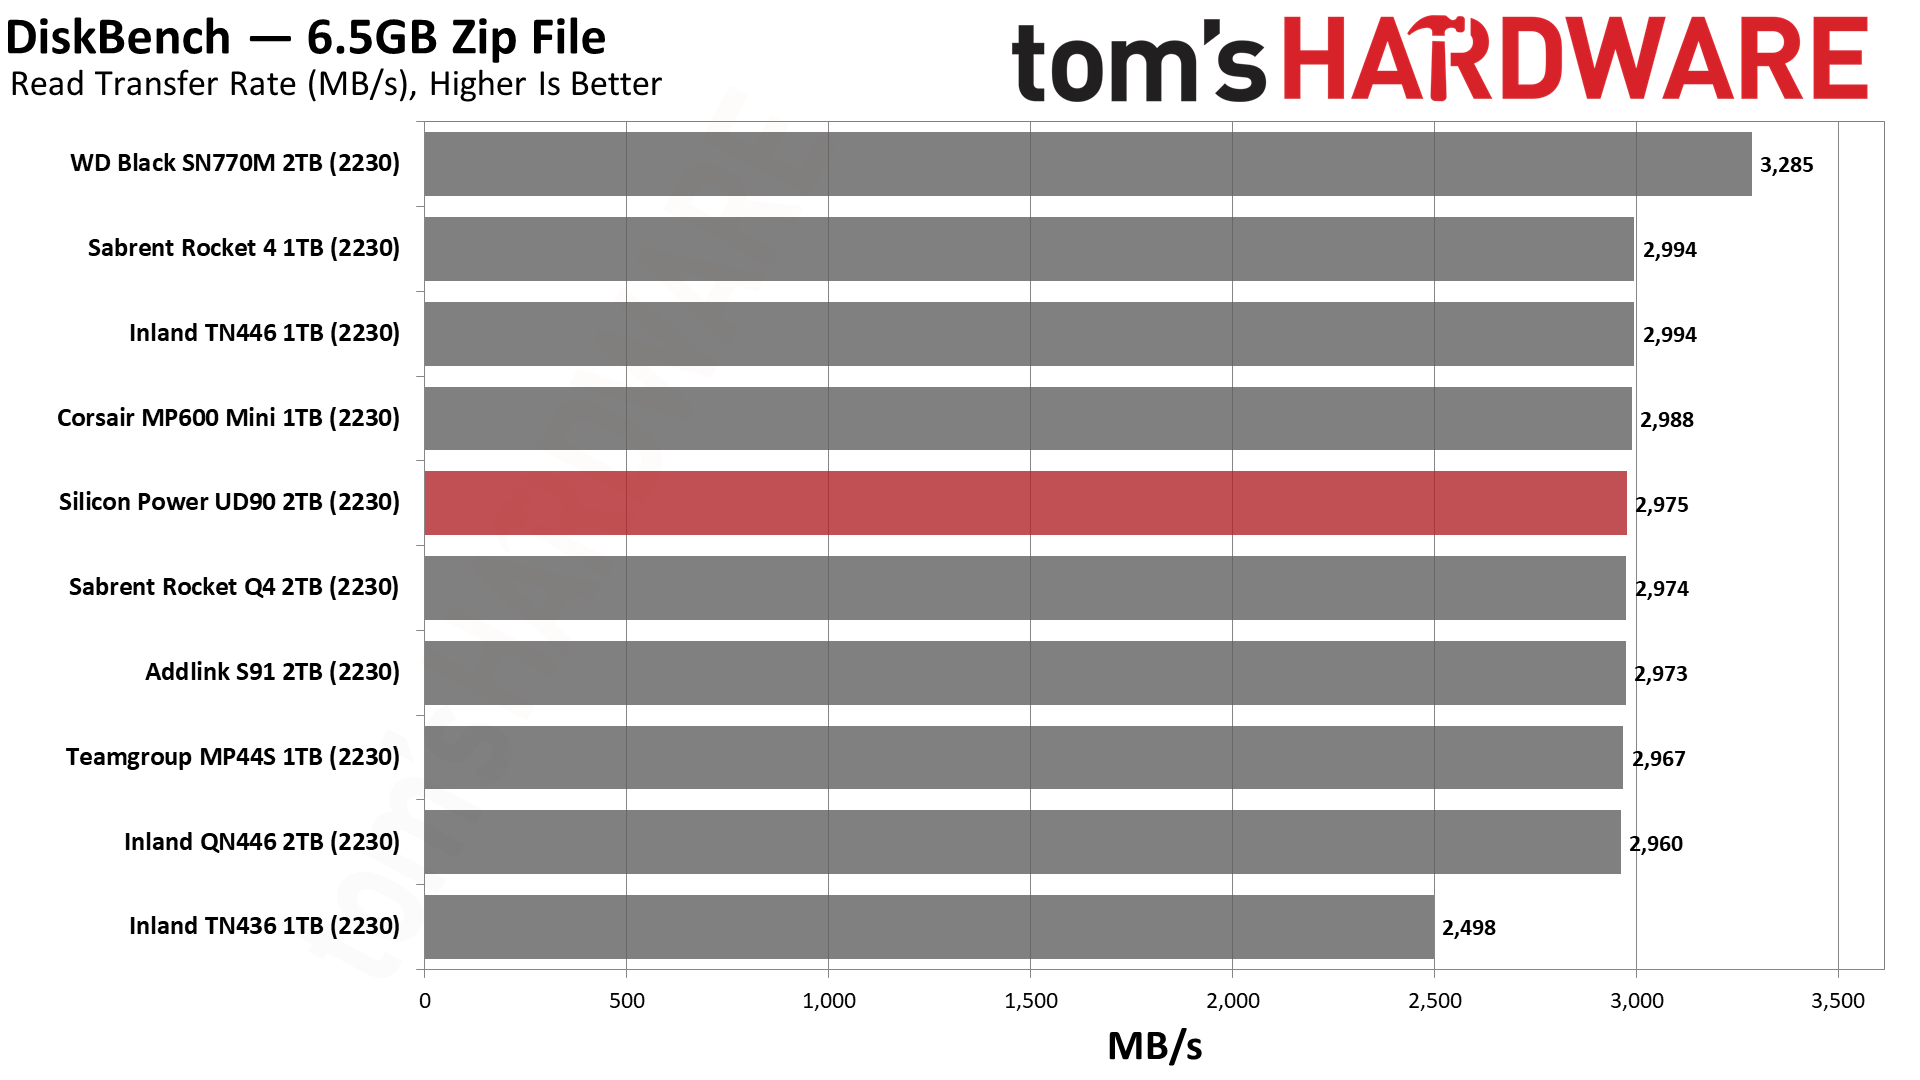
Copy performance in DiskBench brings the drive back down to earth. It’s closer to the QLC drives, like the QN446, in PCIe 4.0 mode. In PCIe 3.0 mode, it ballparks with the other 2230 SSDs. It still manages to eke out first place in that scenario, though.
PC Synthetic Testing - ATTO / CrystalDiskMark
ATTO and CrystalDiskMark (CDM) are free and easy-to-use storage benchmarking tools that SSD vendors commonly use to assign performance specifications to their products. Both of these tools give us insight into how each device handles different file sizes.
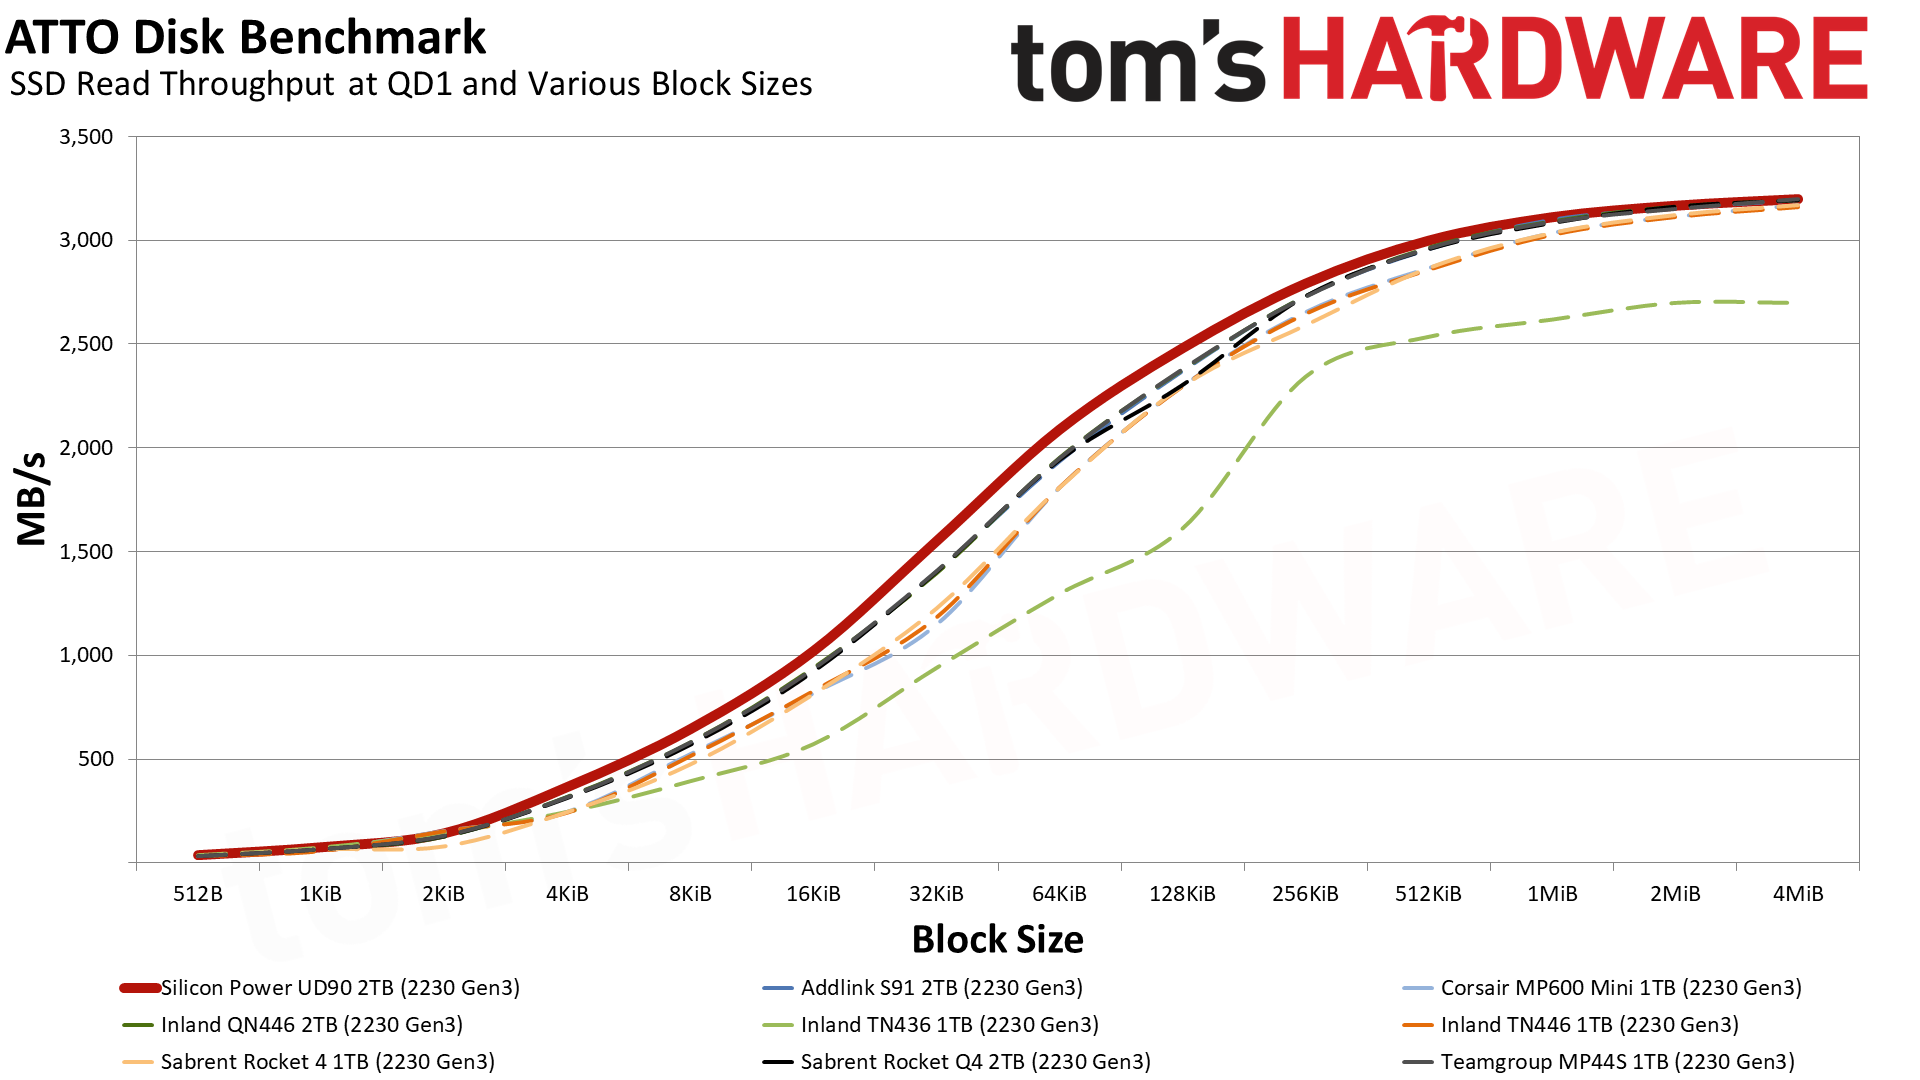
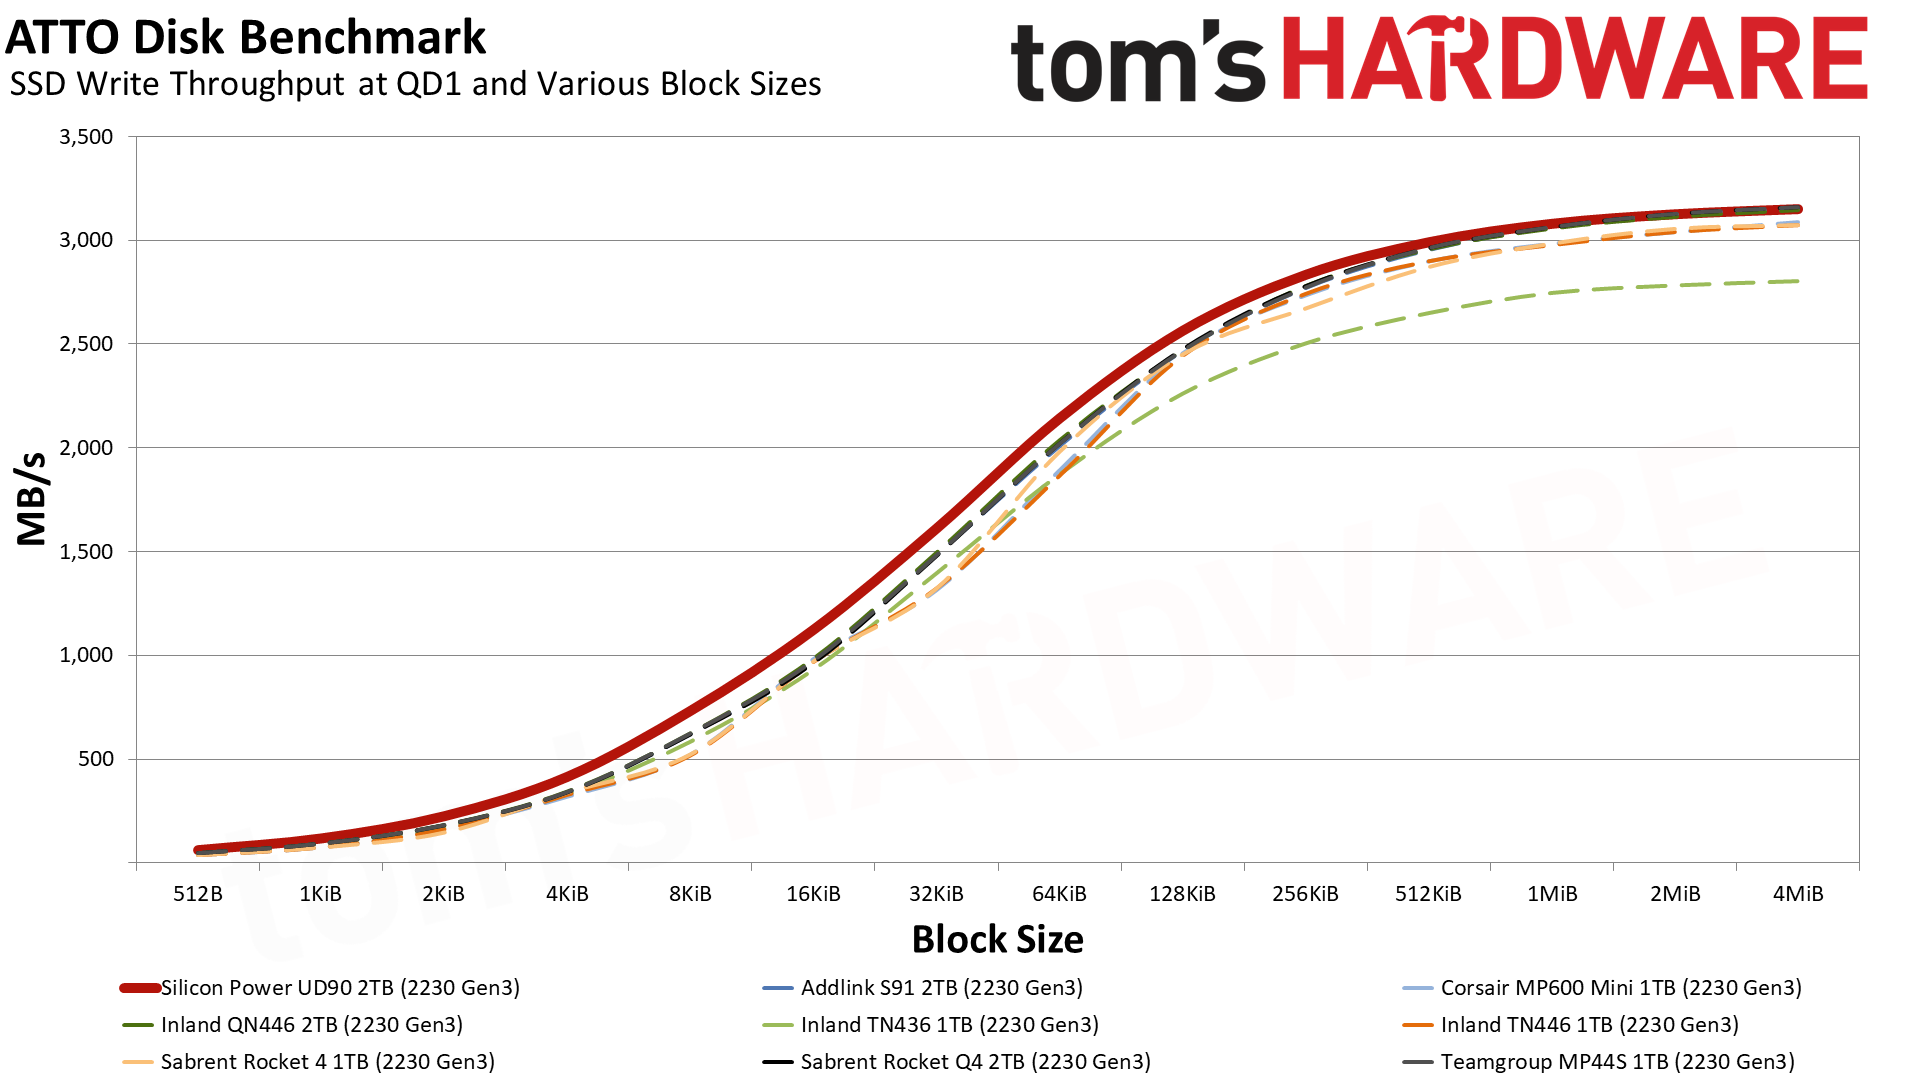
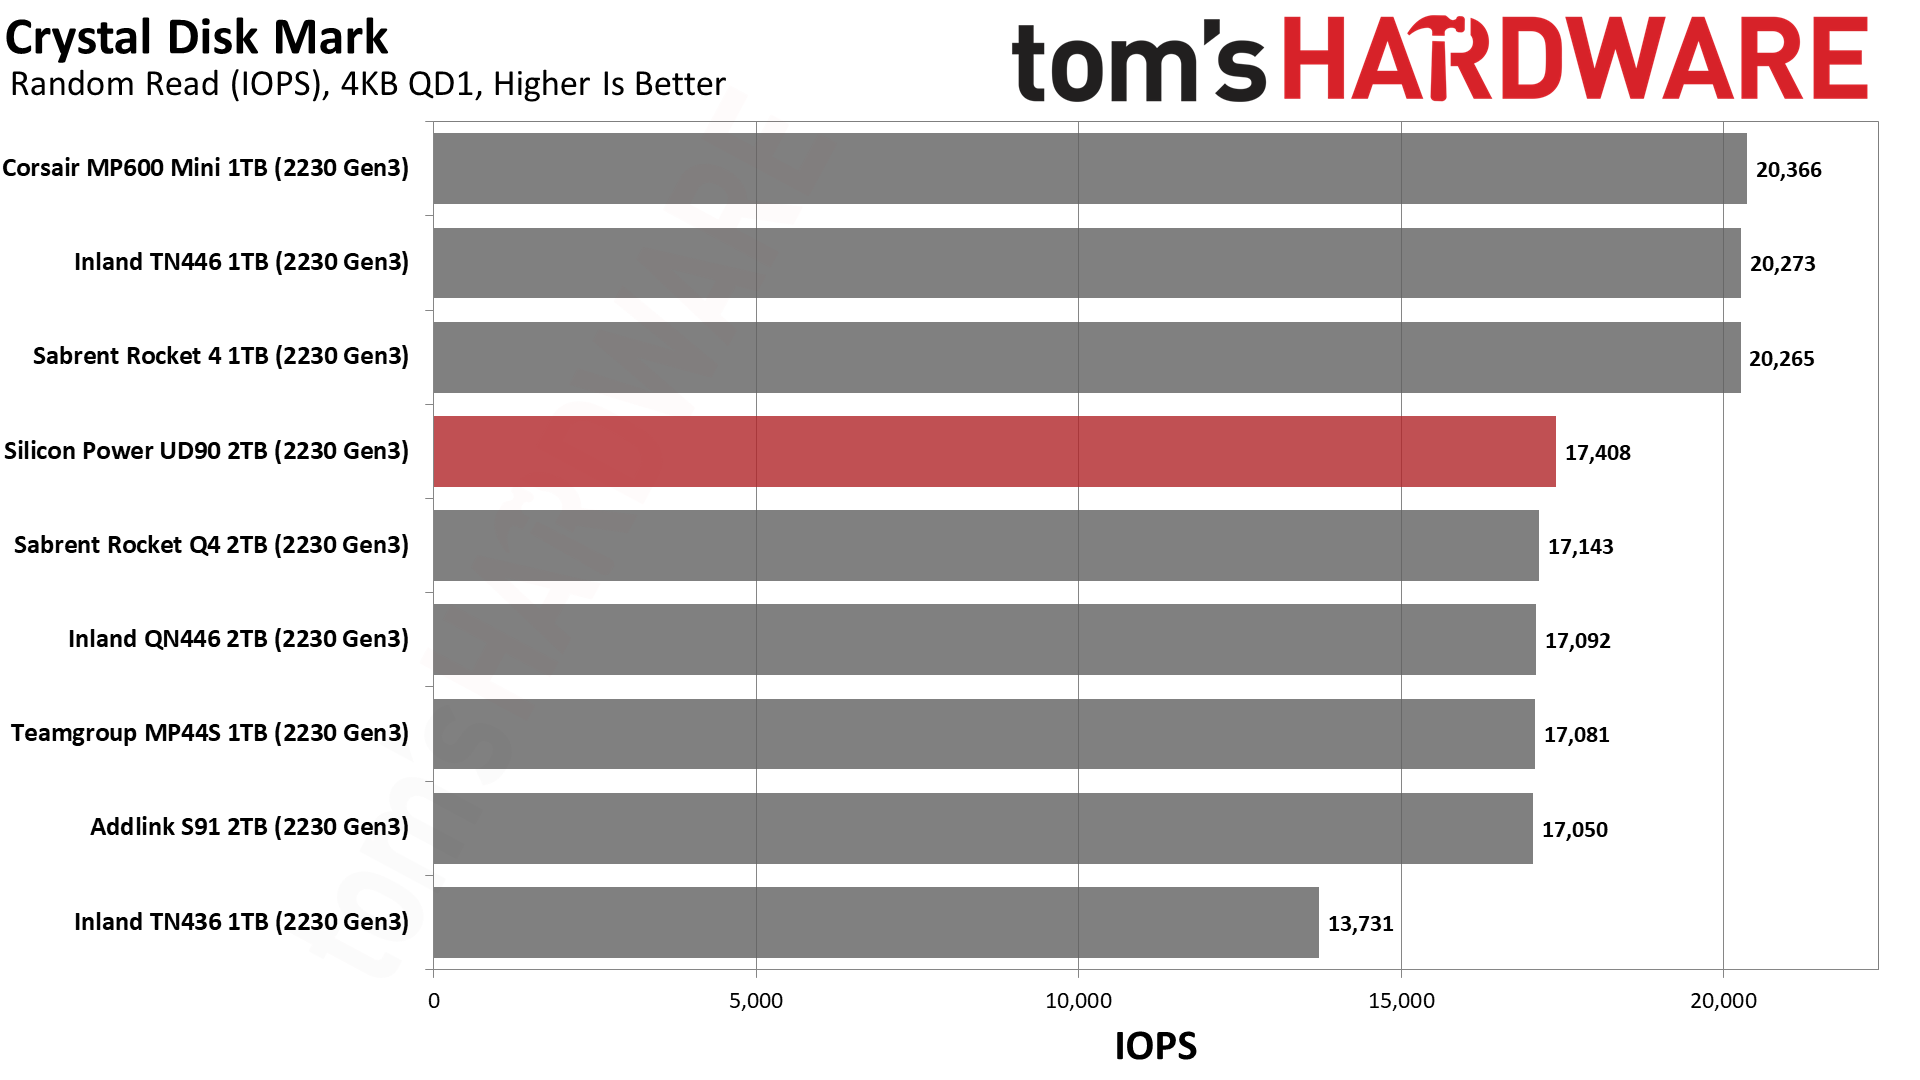
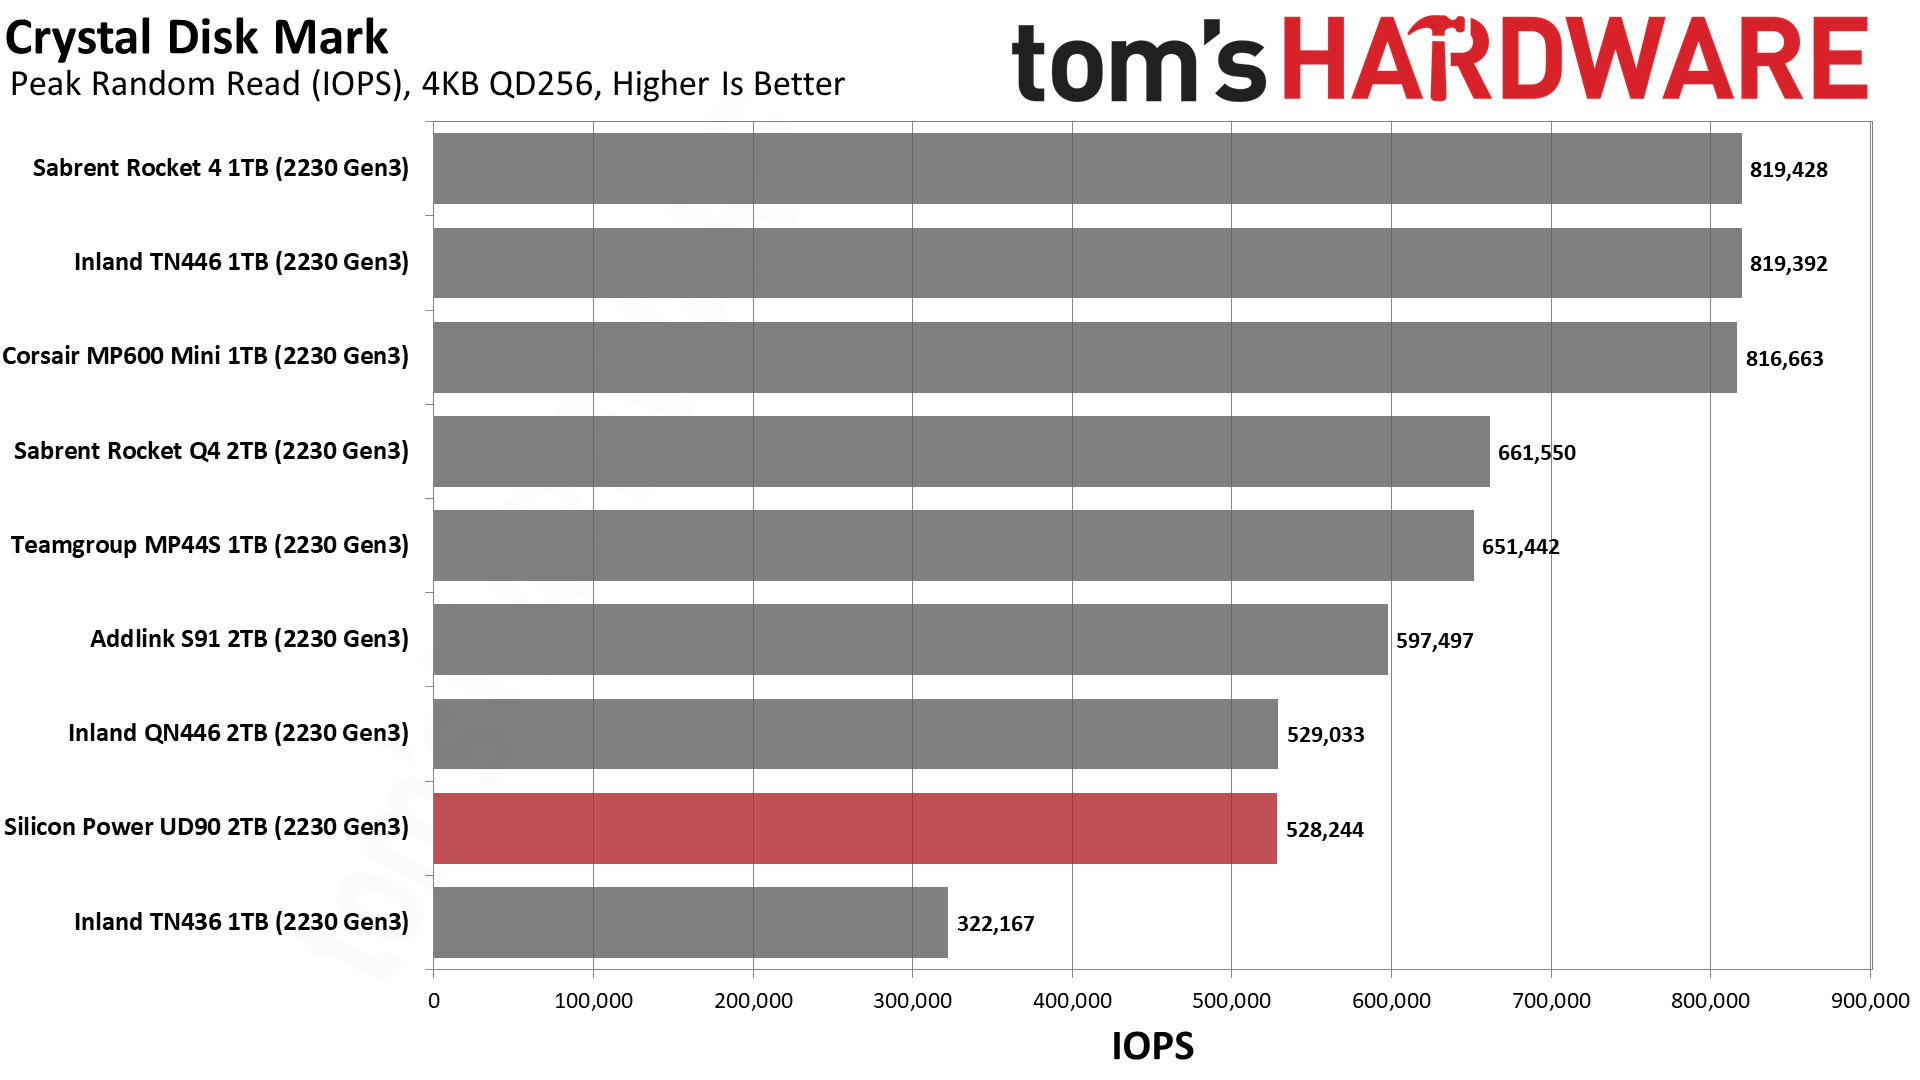
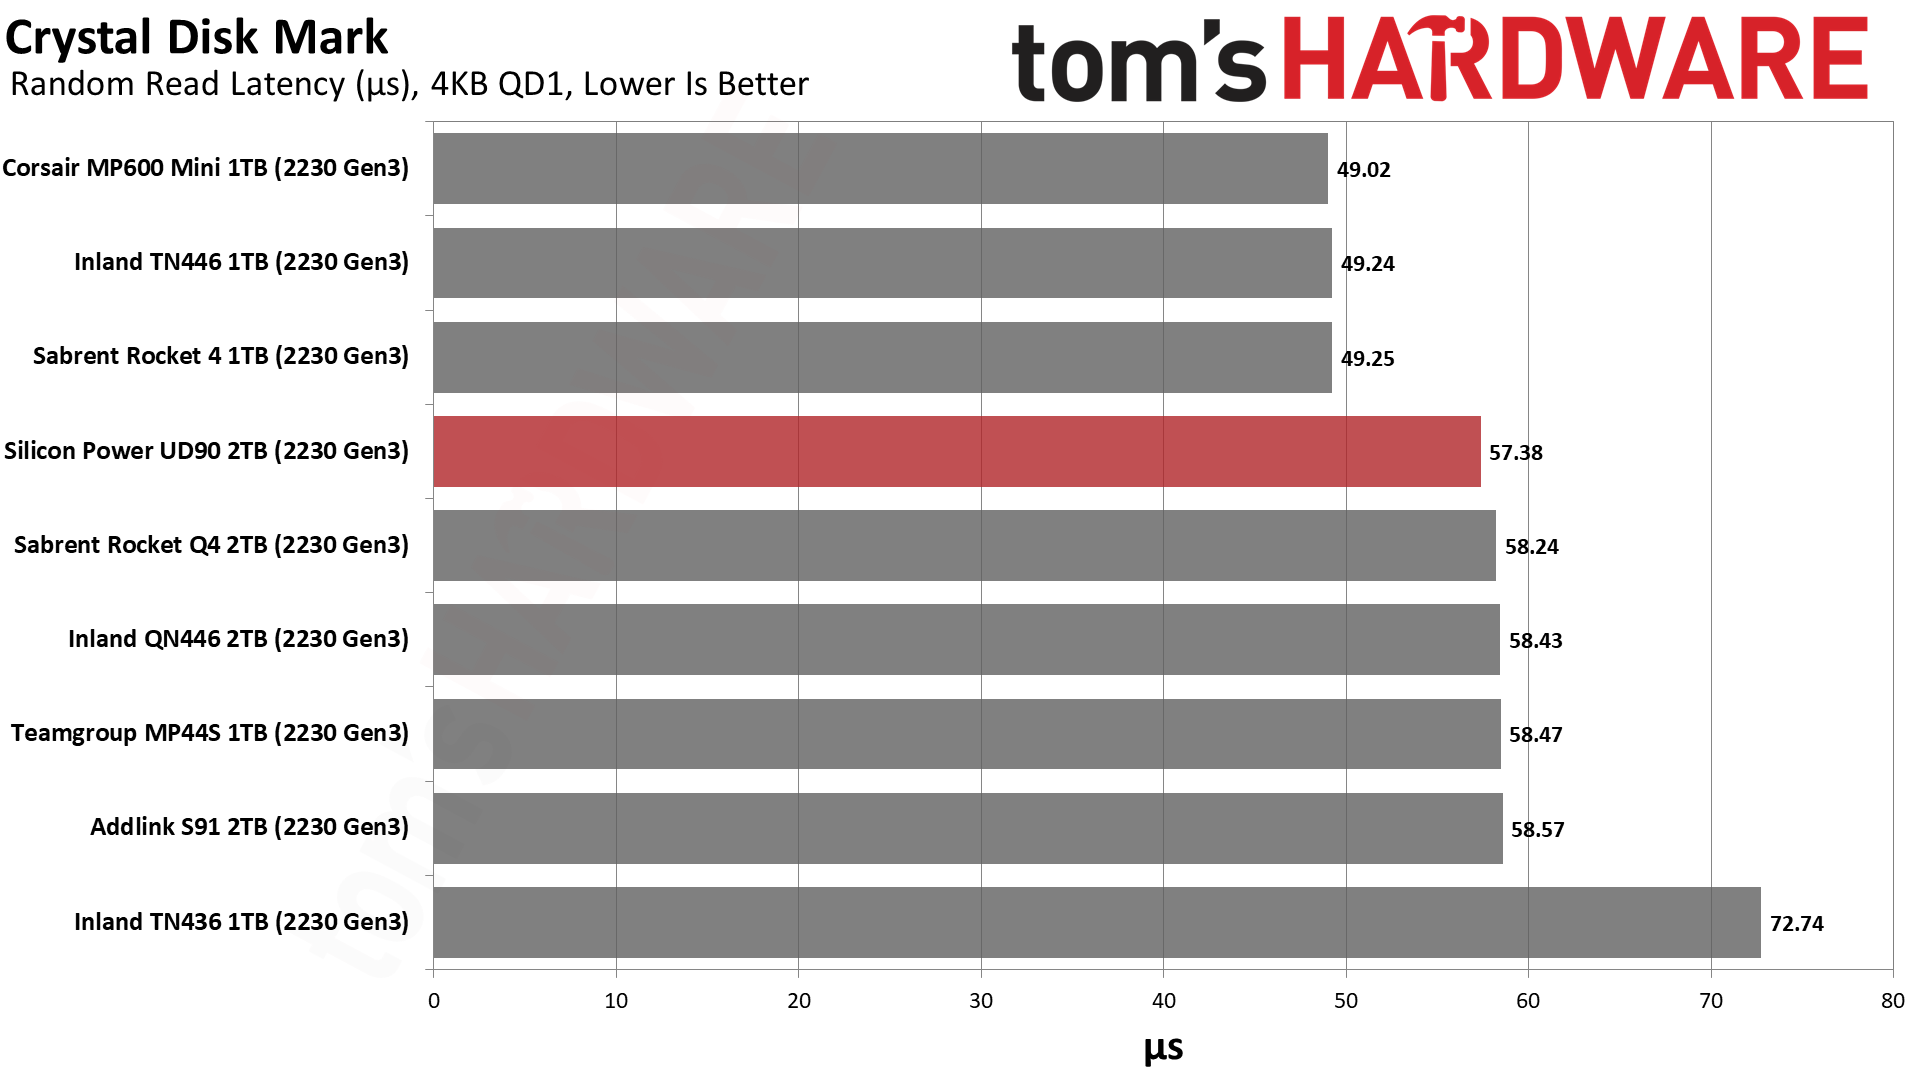
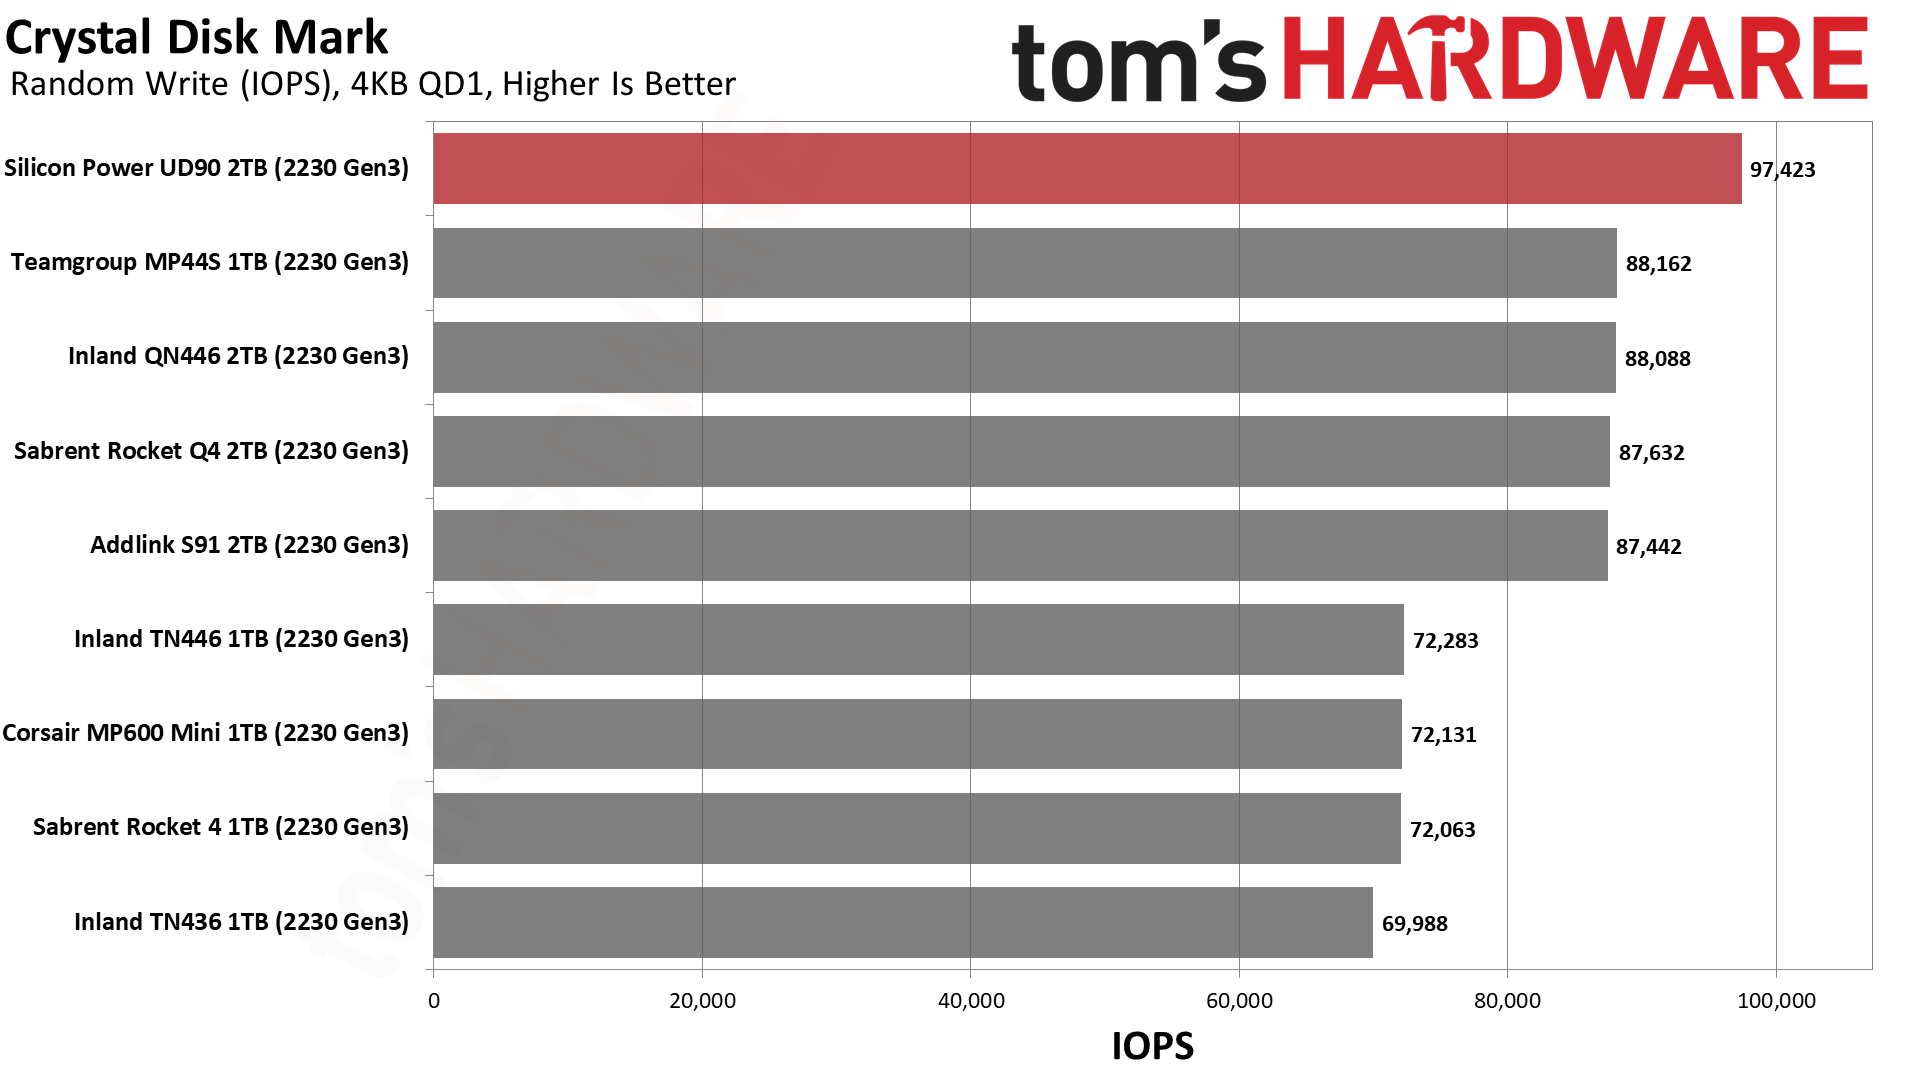
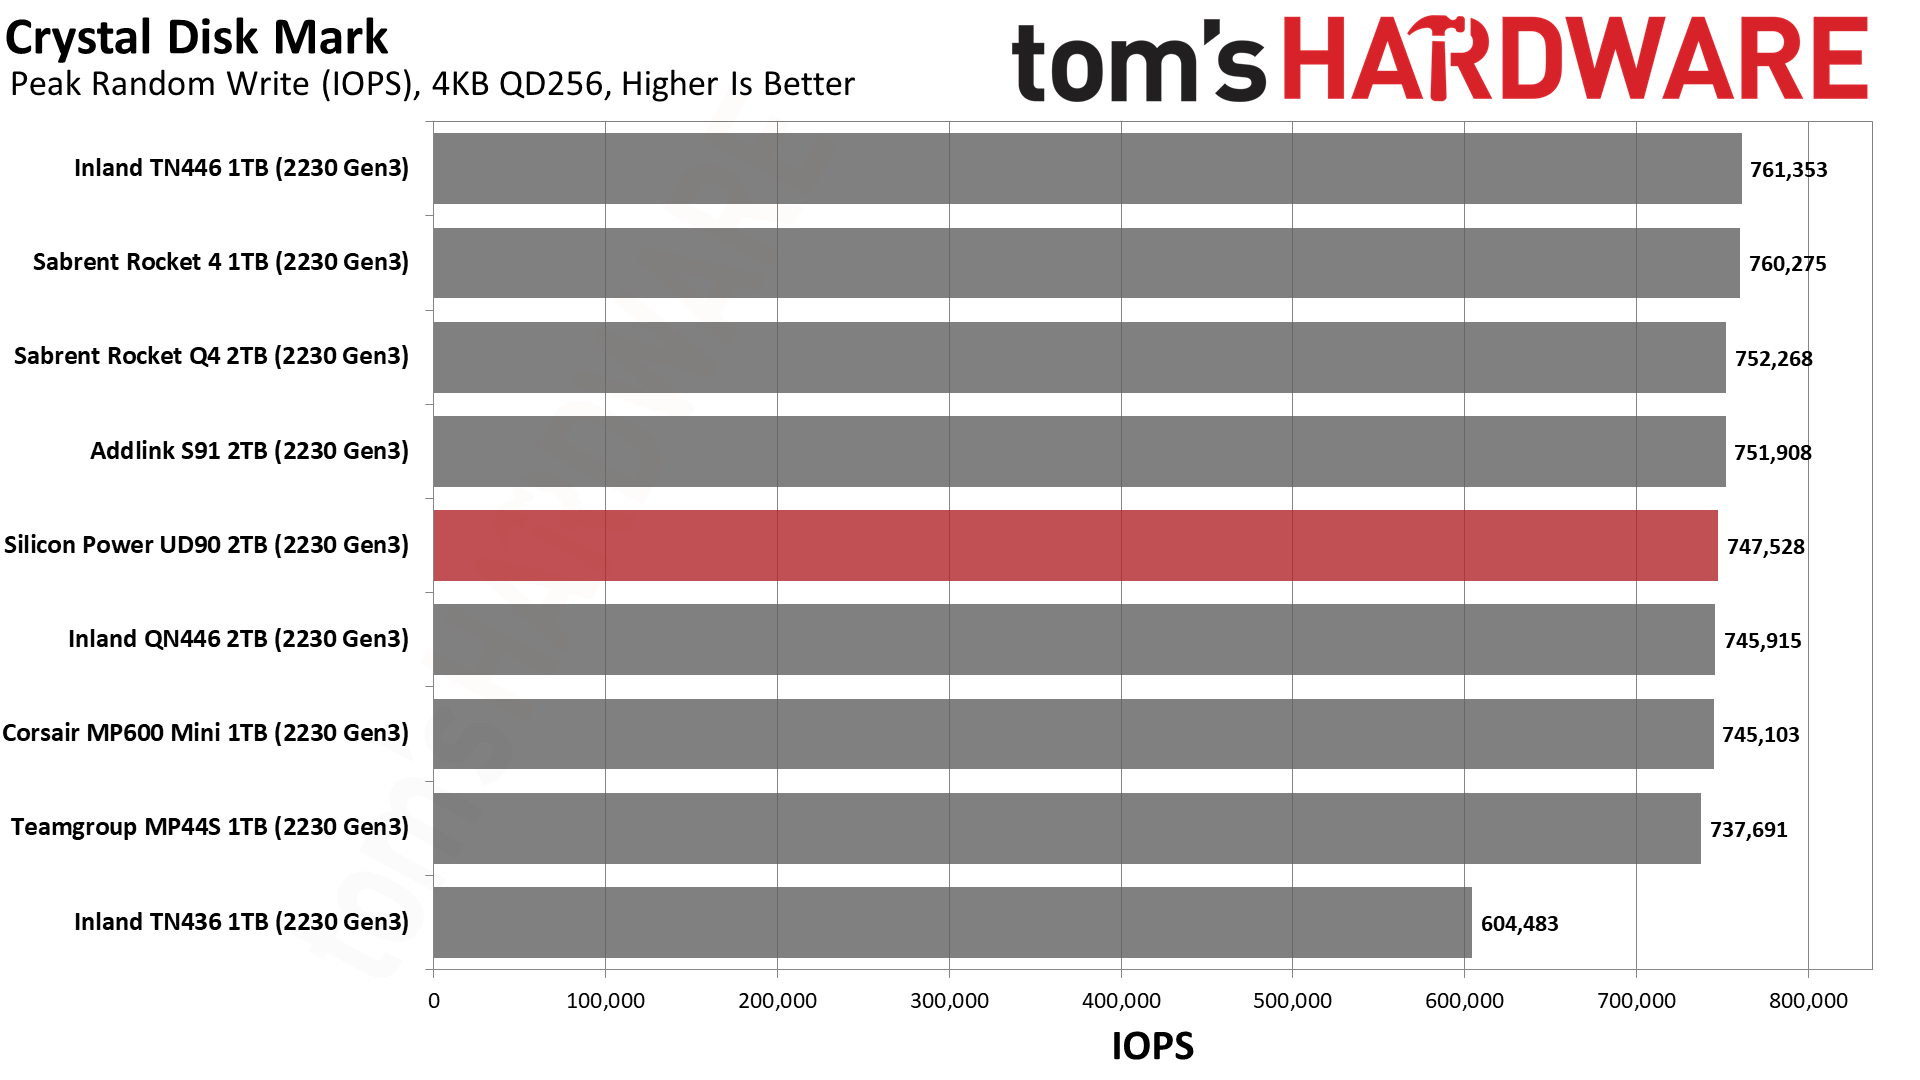
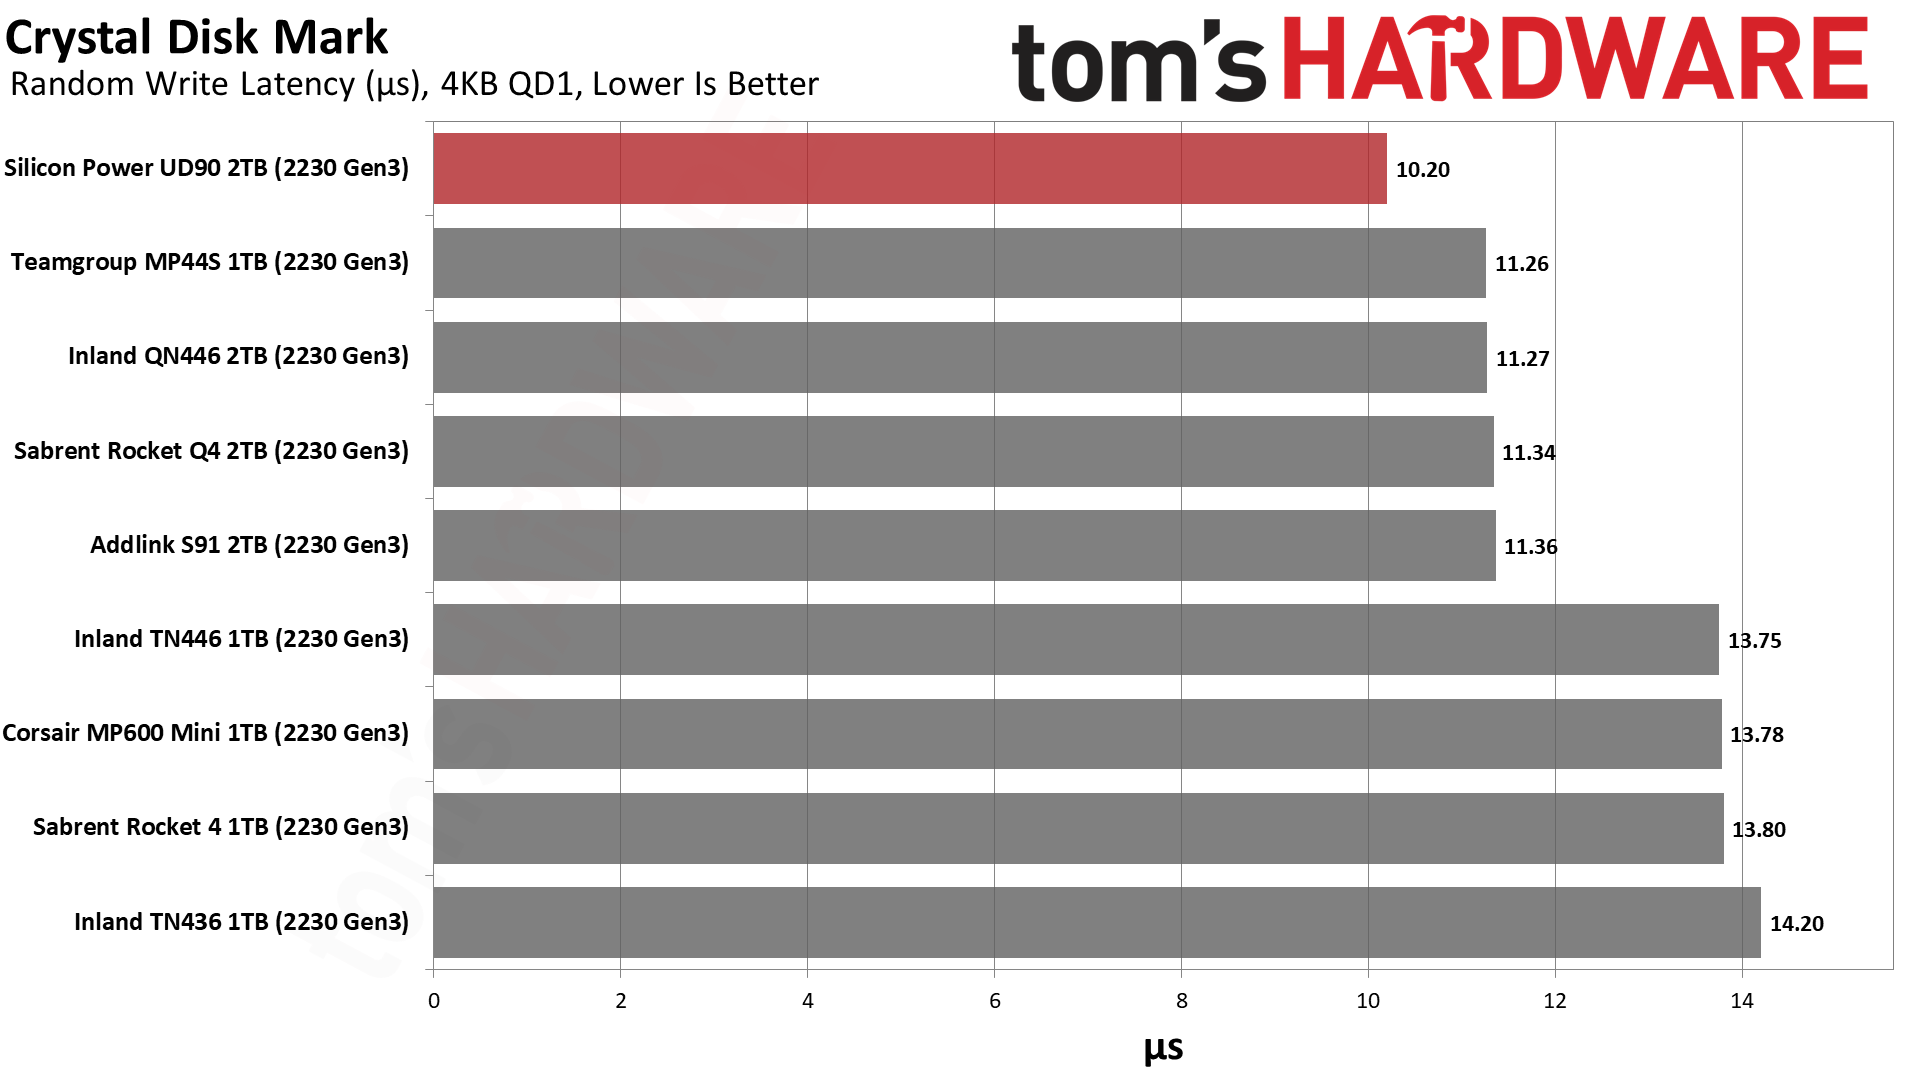
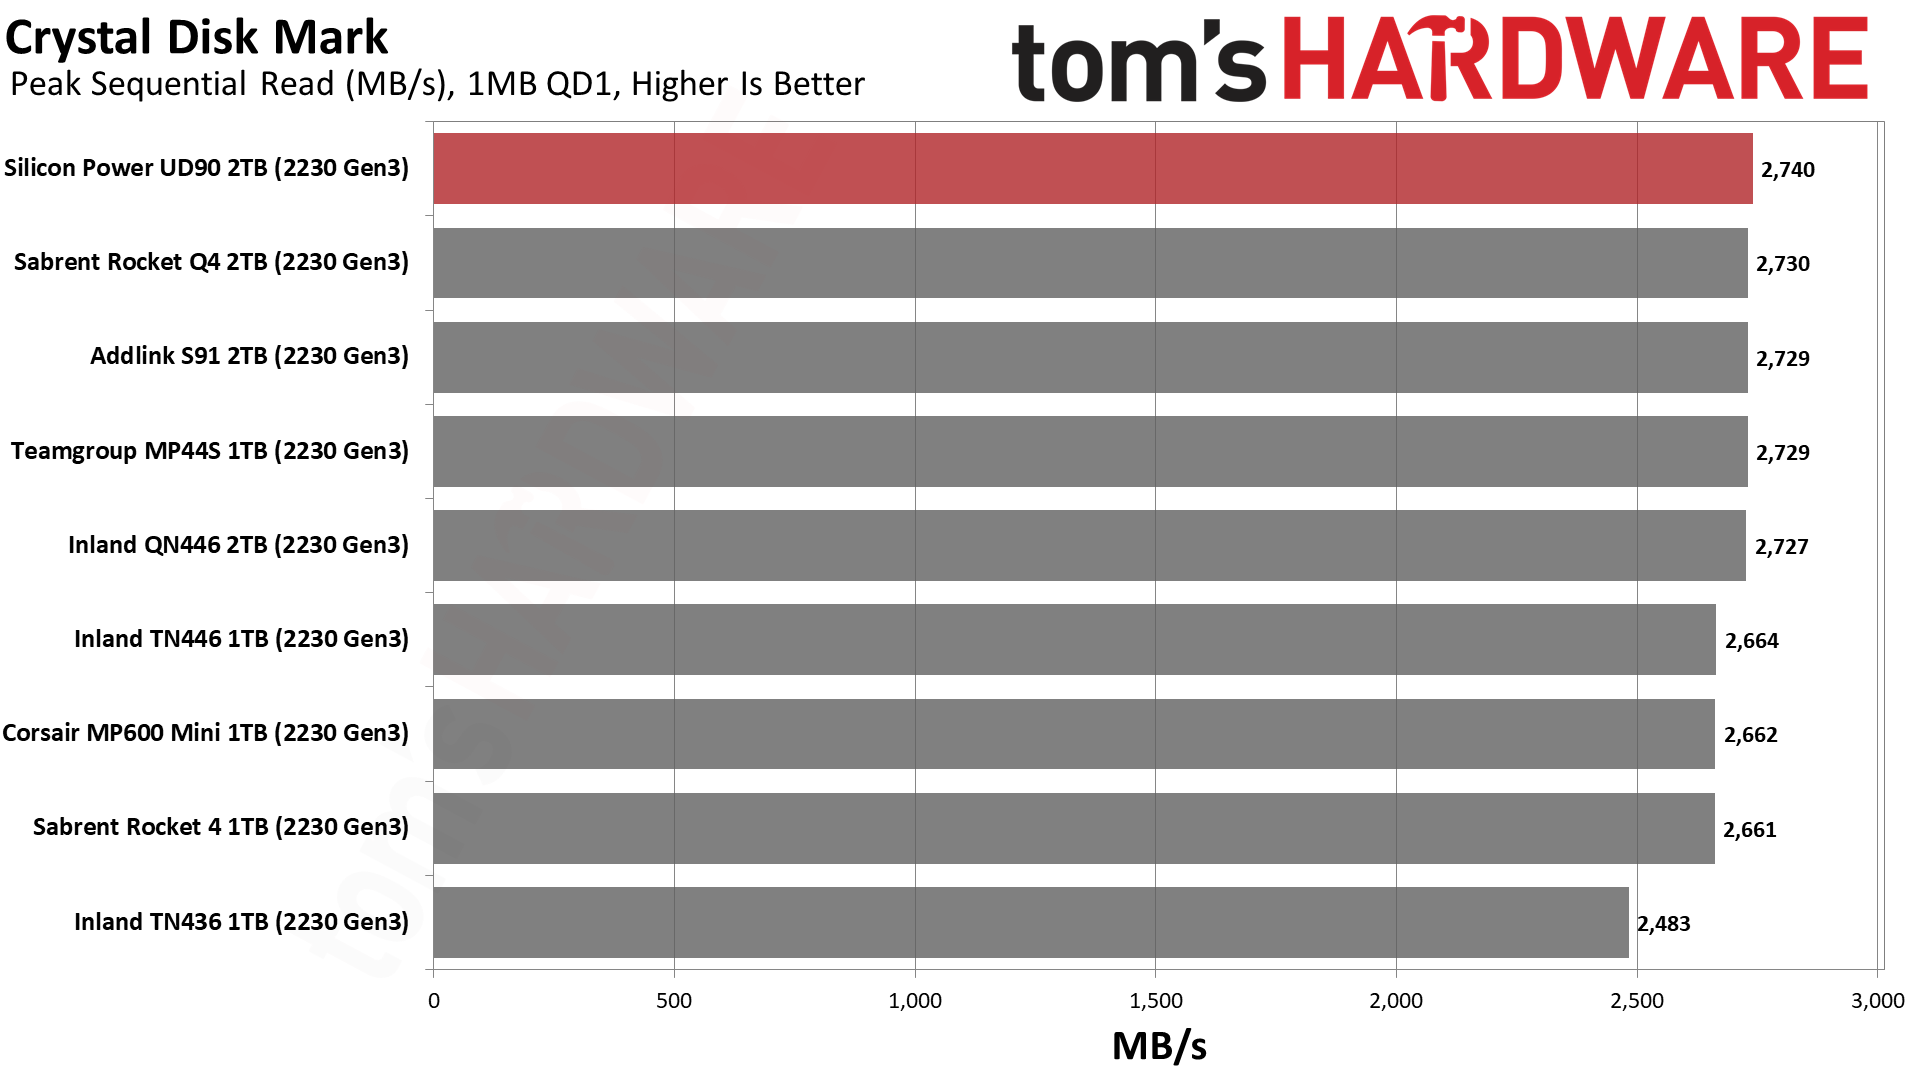
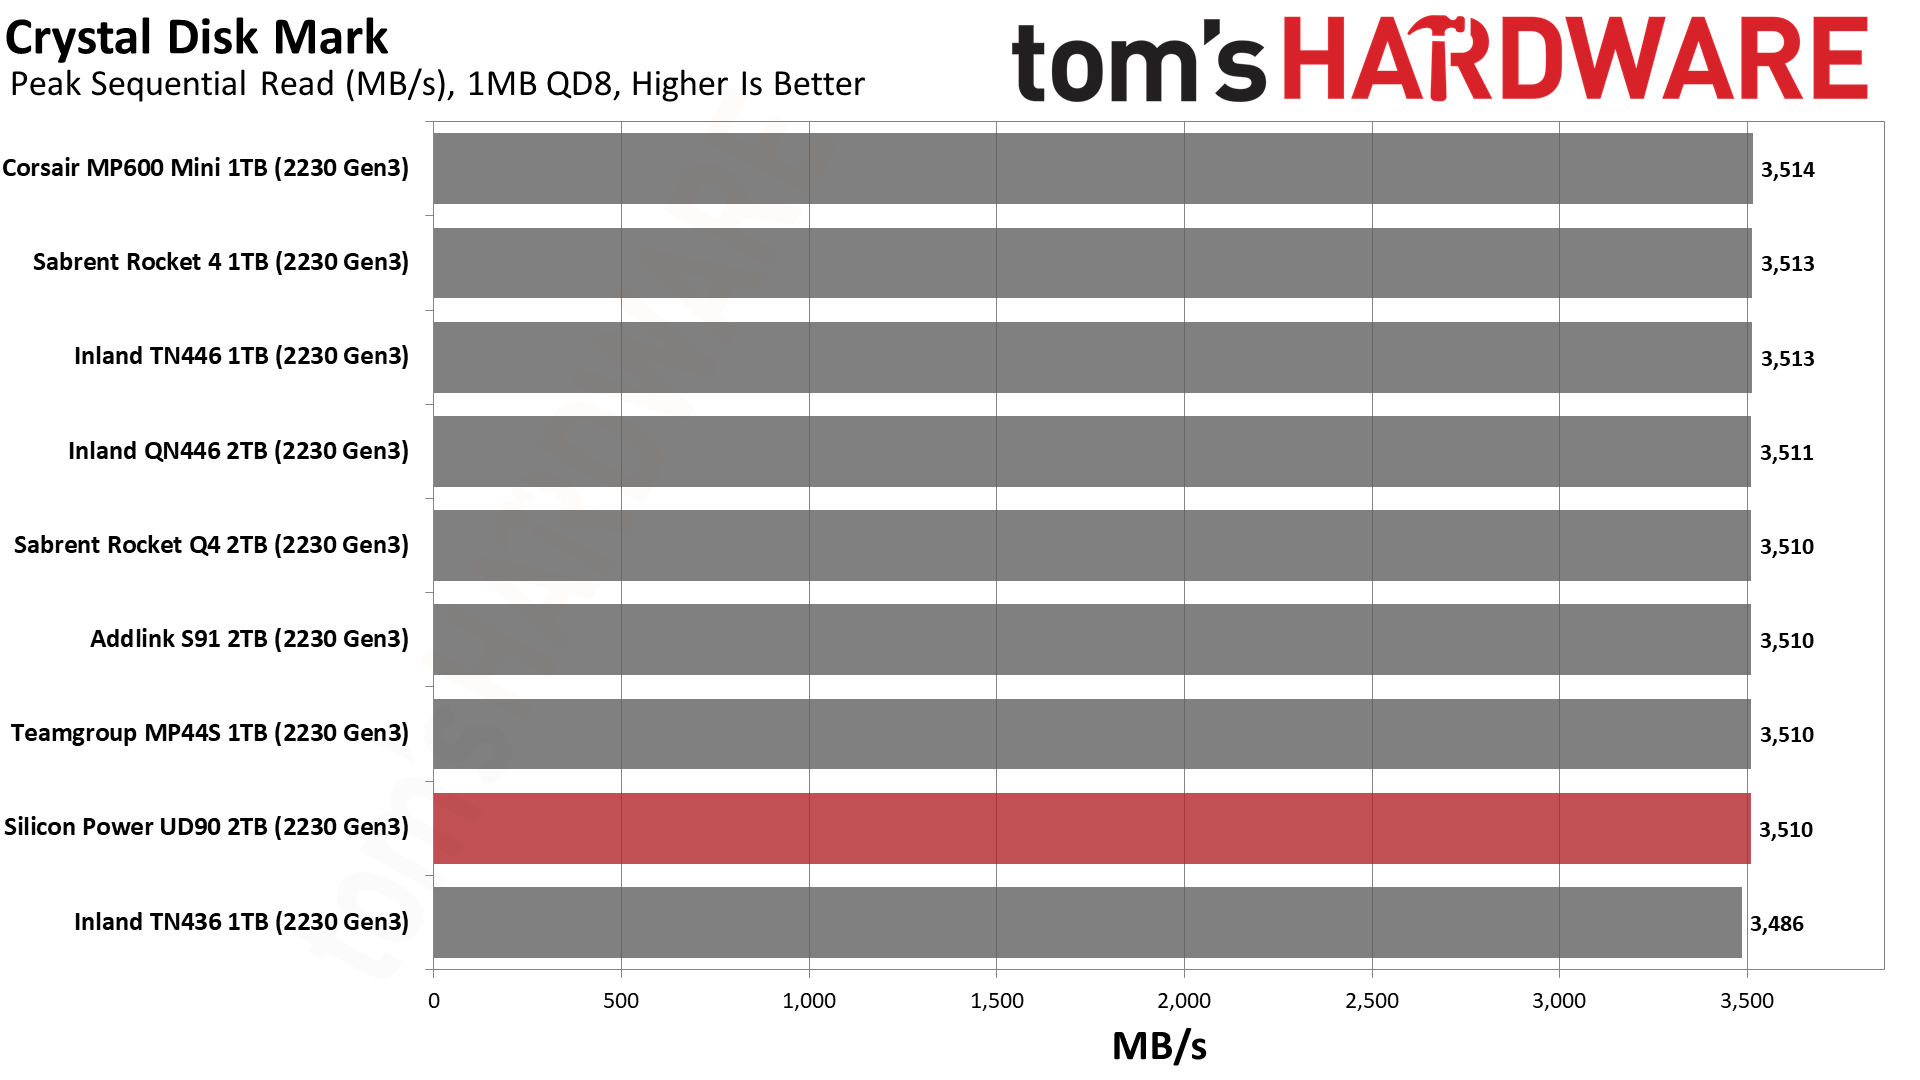
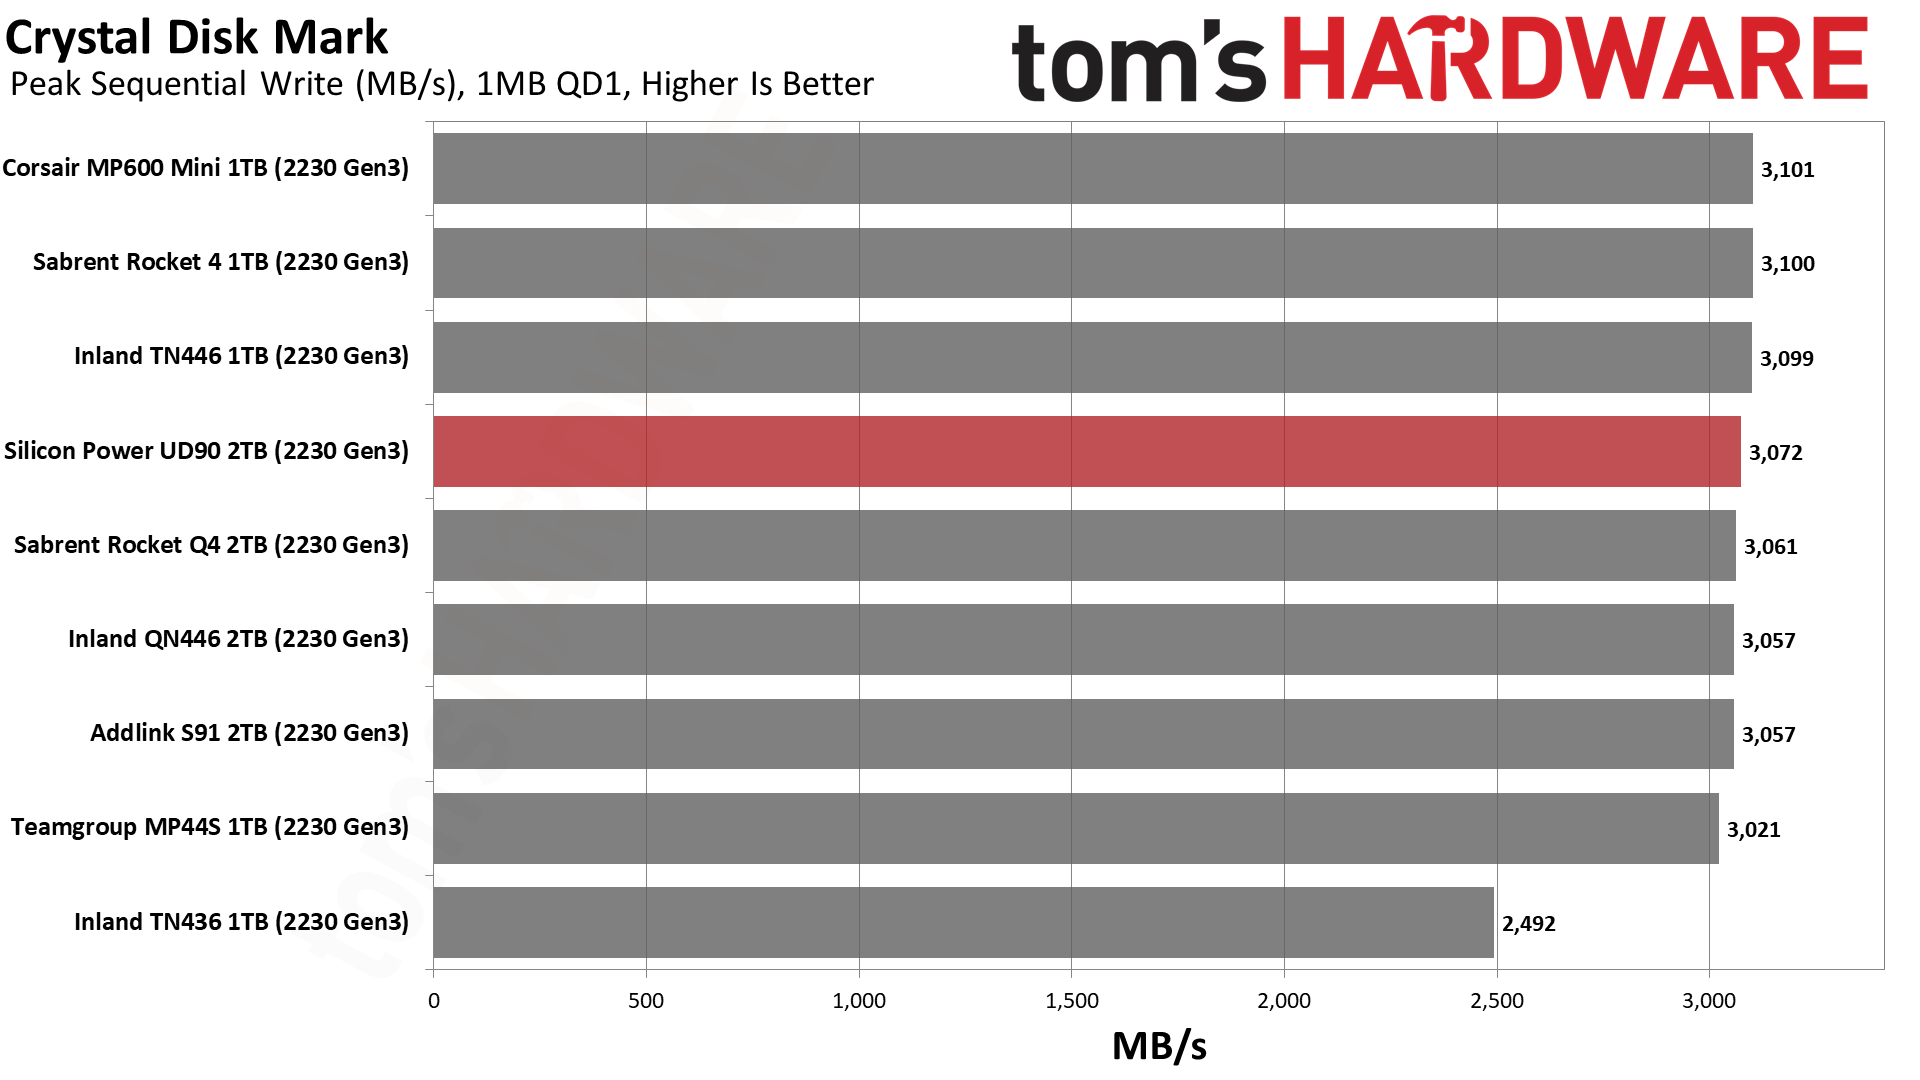
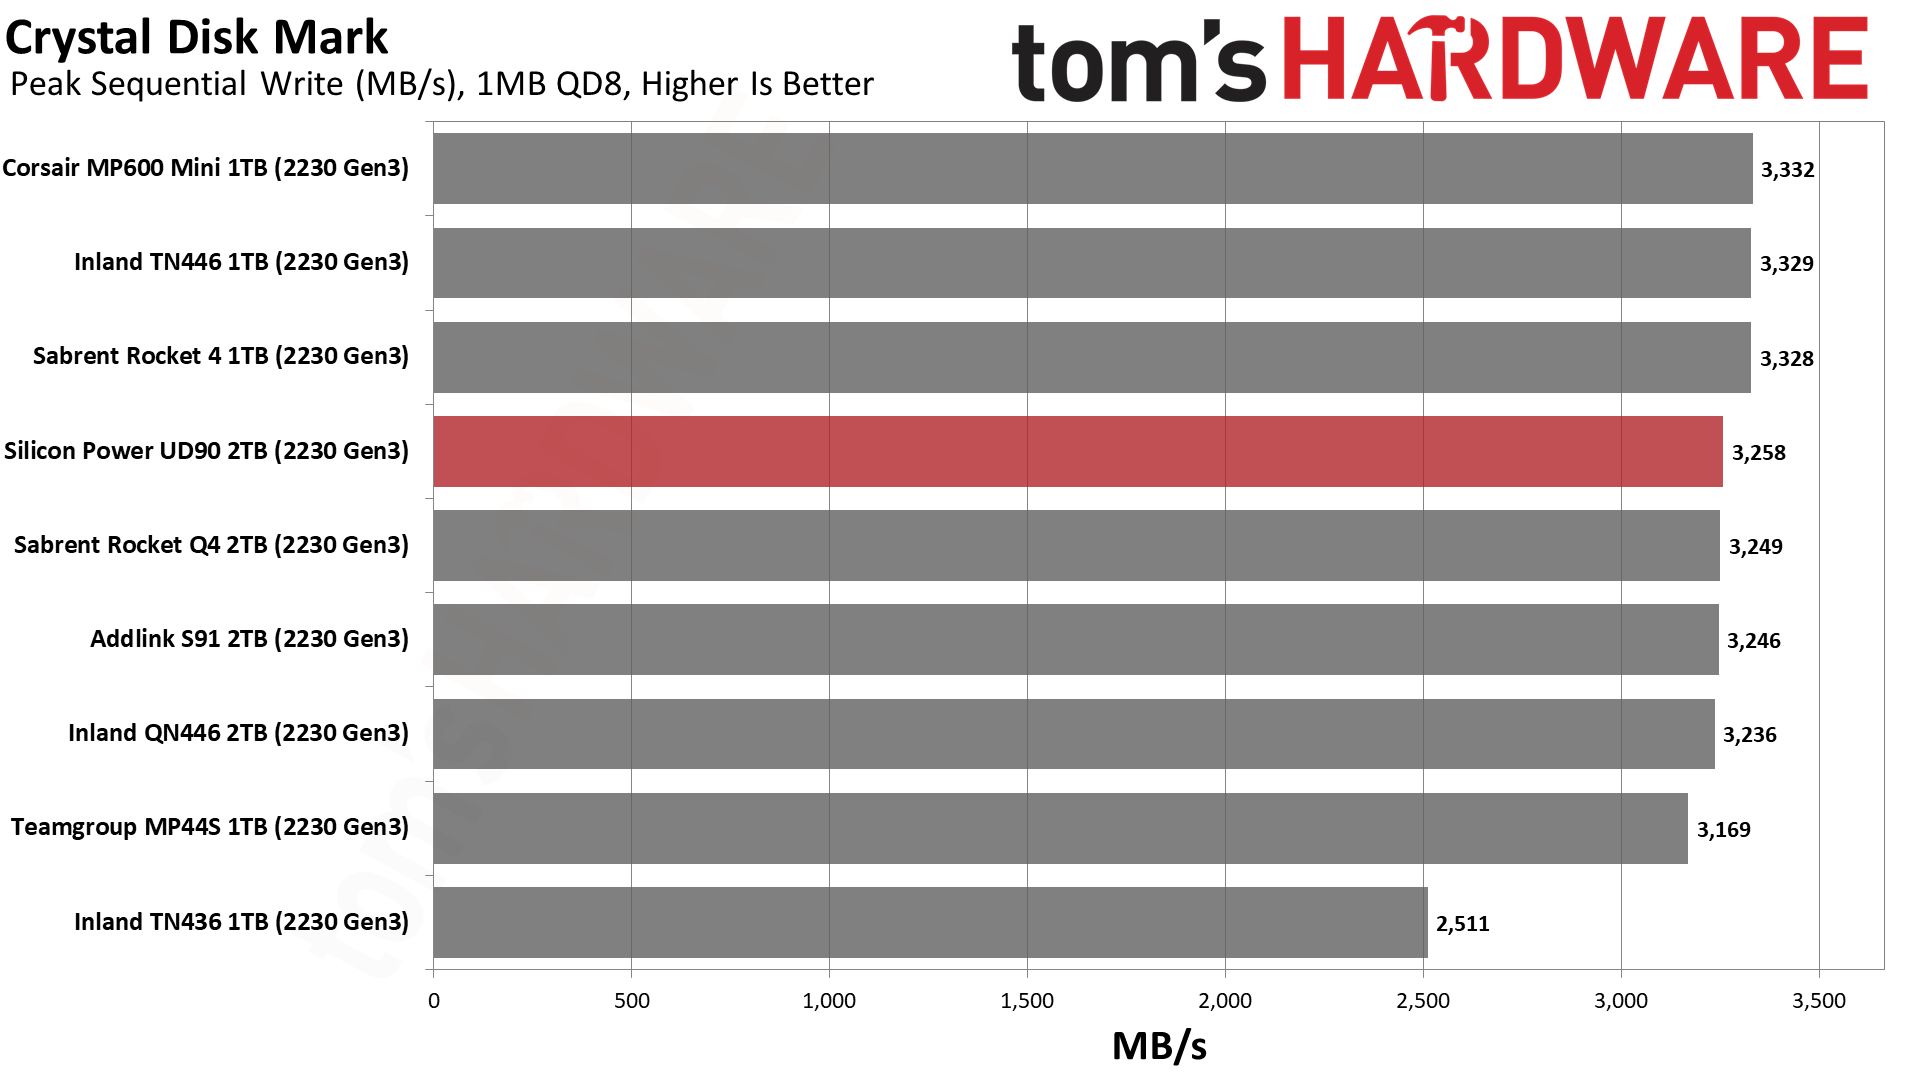
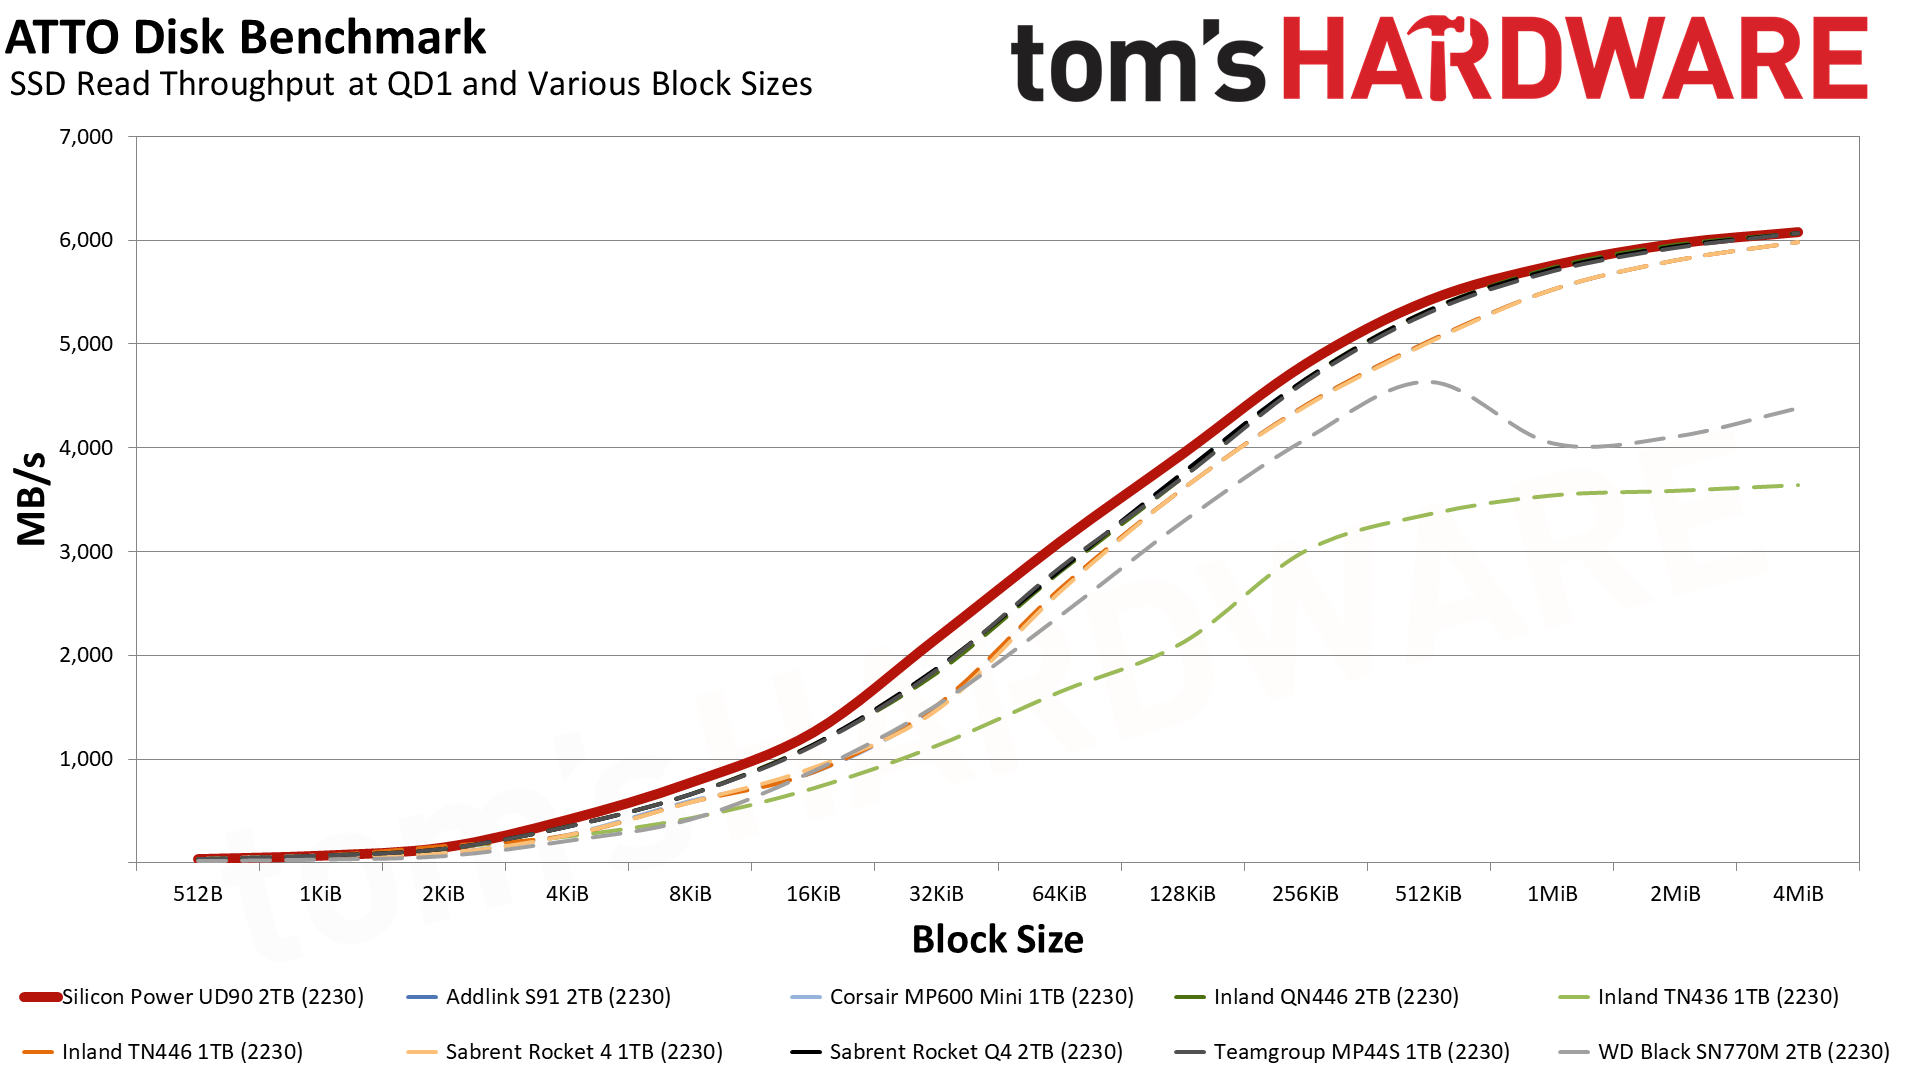
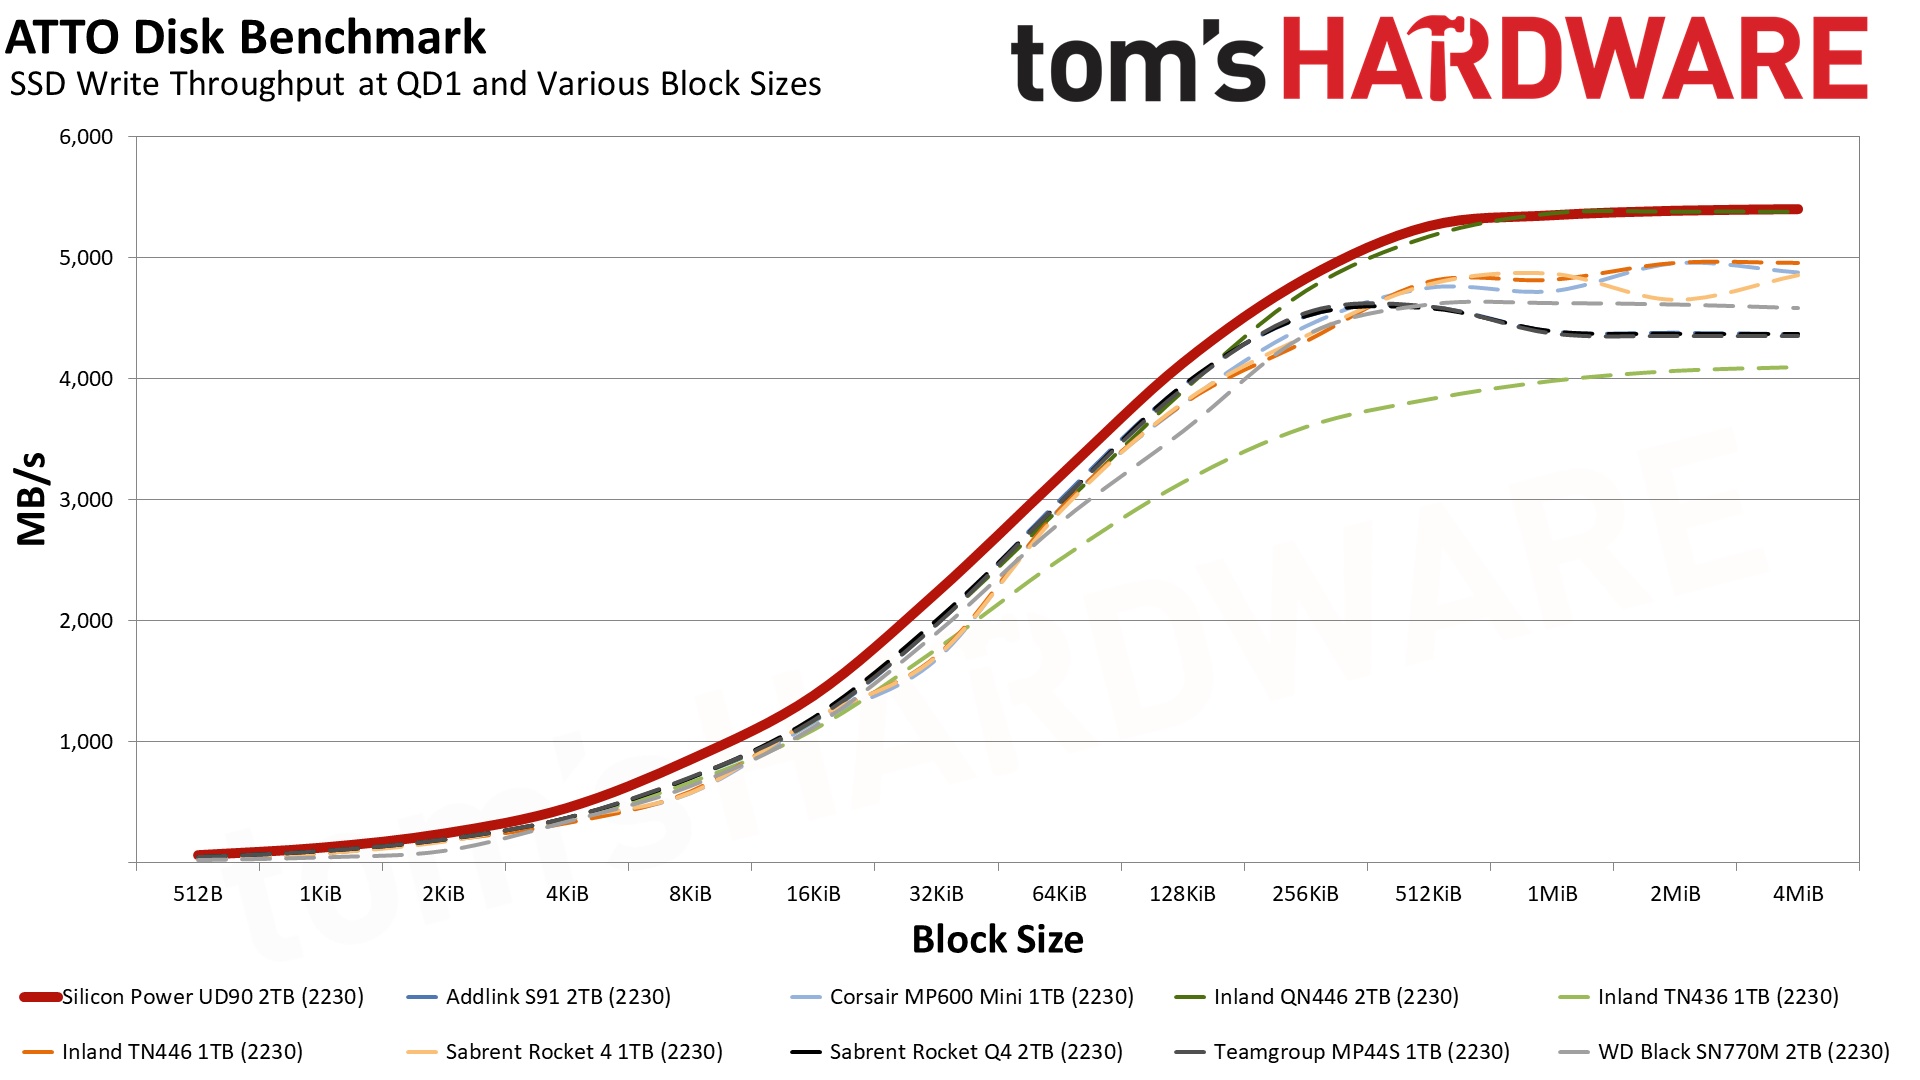
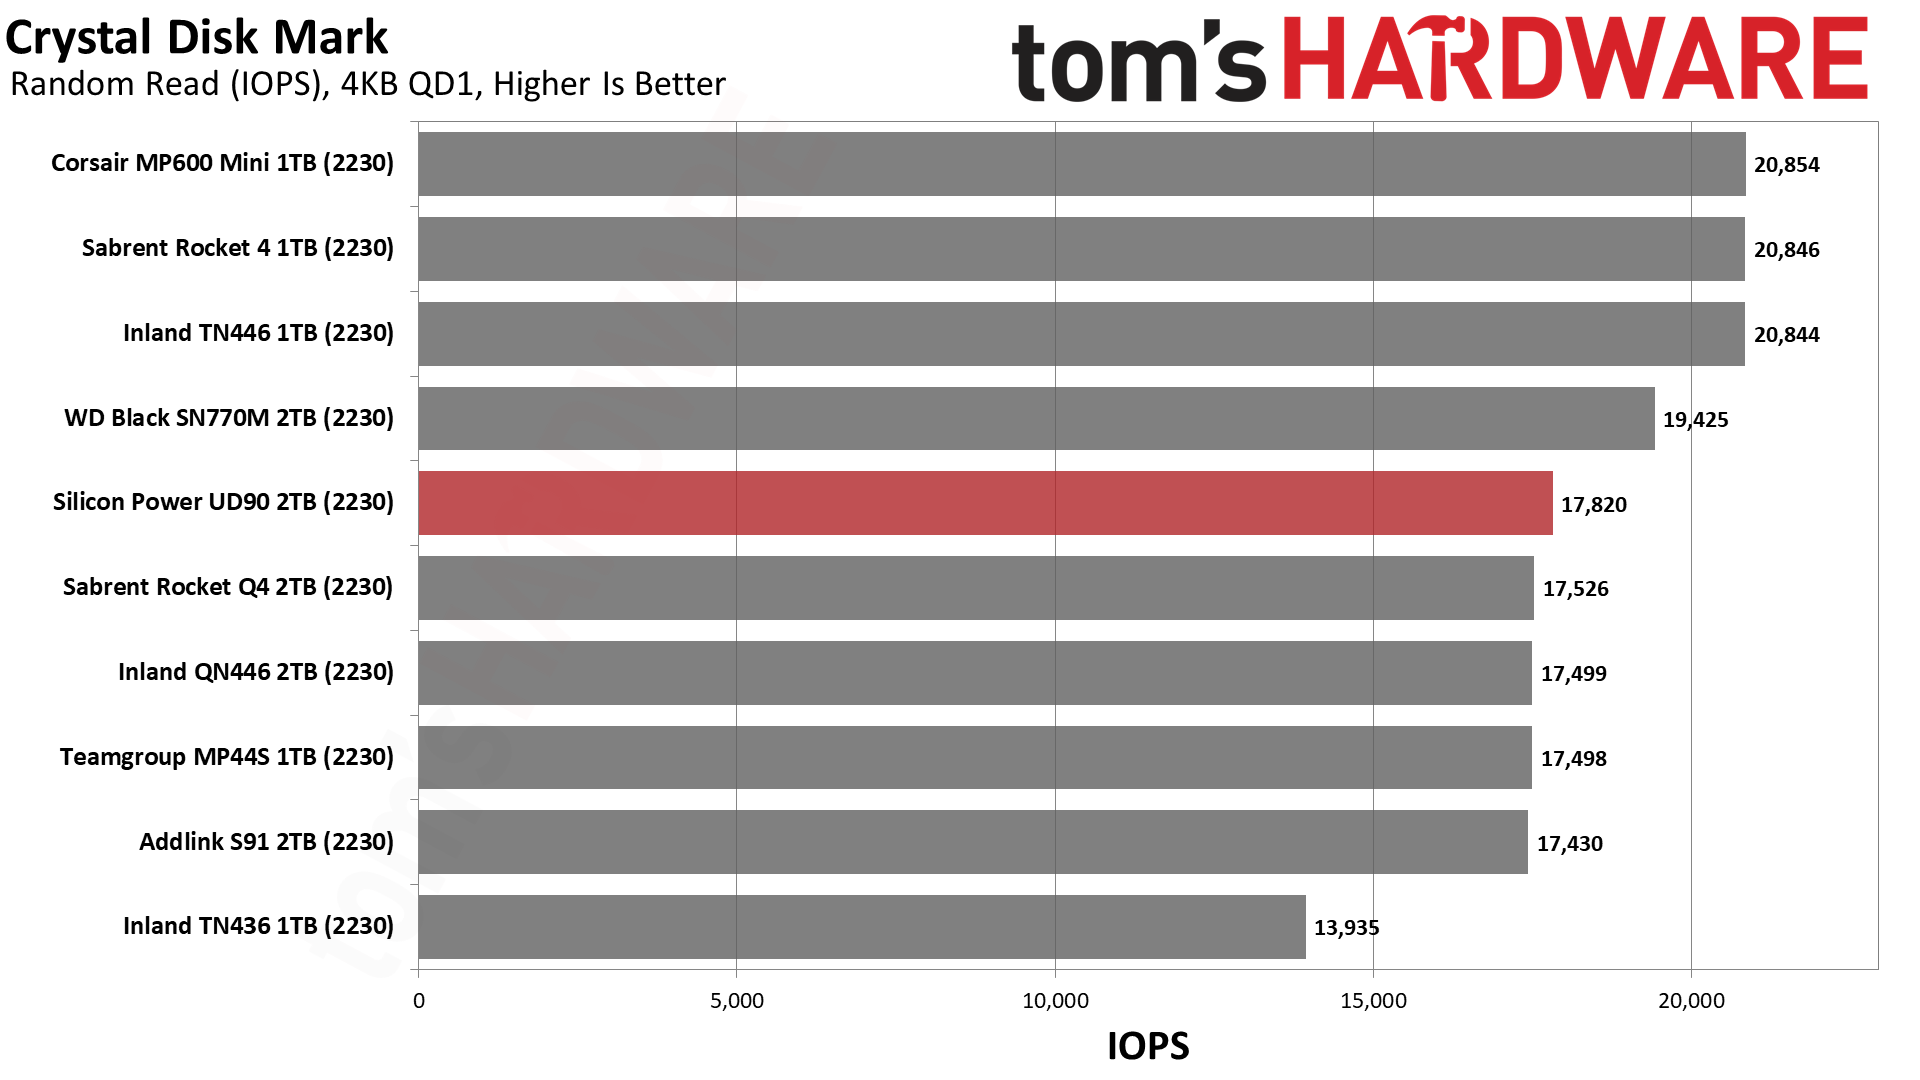
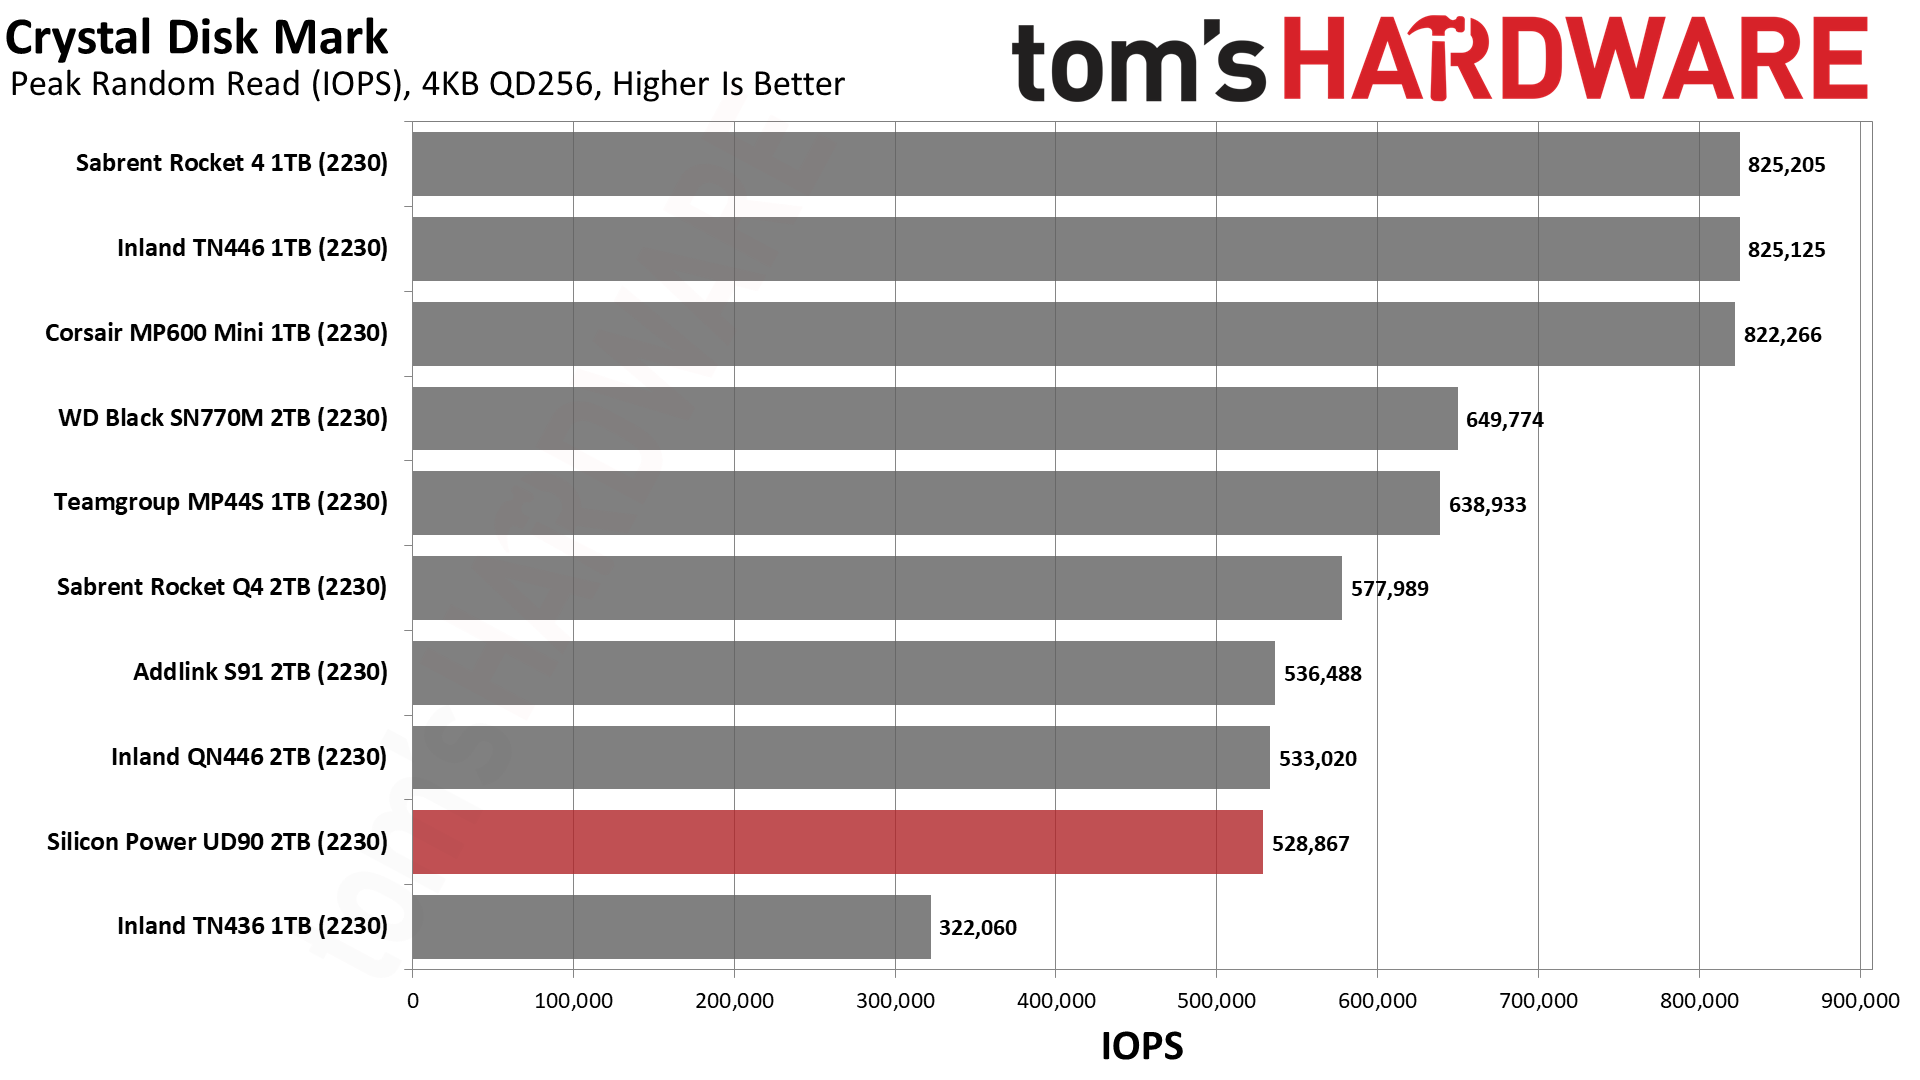
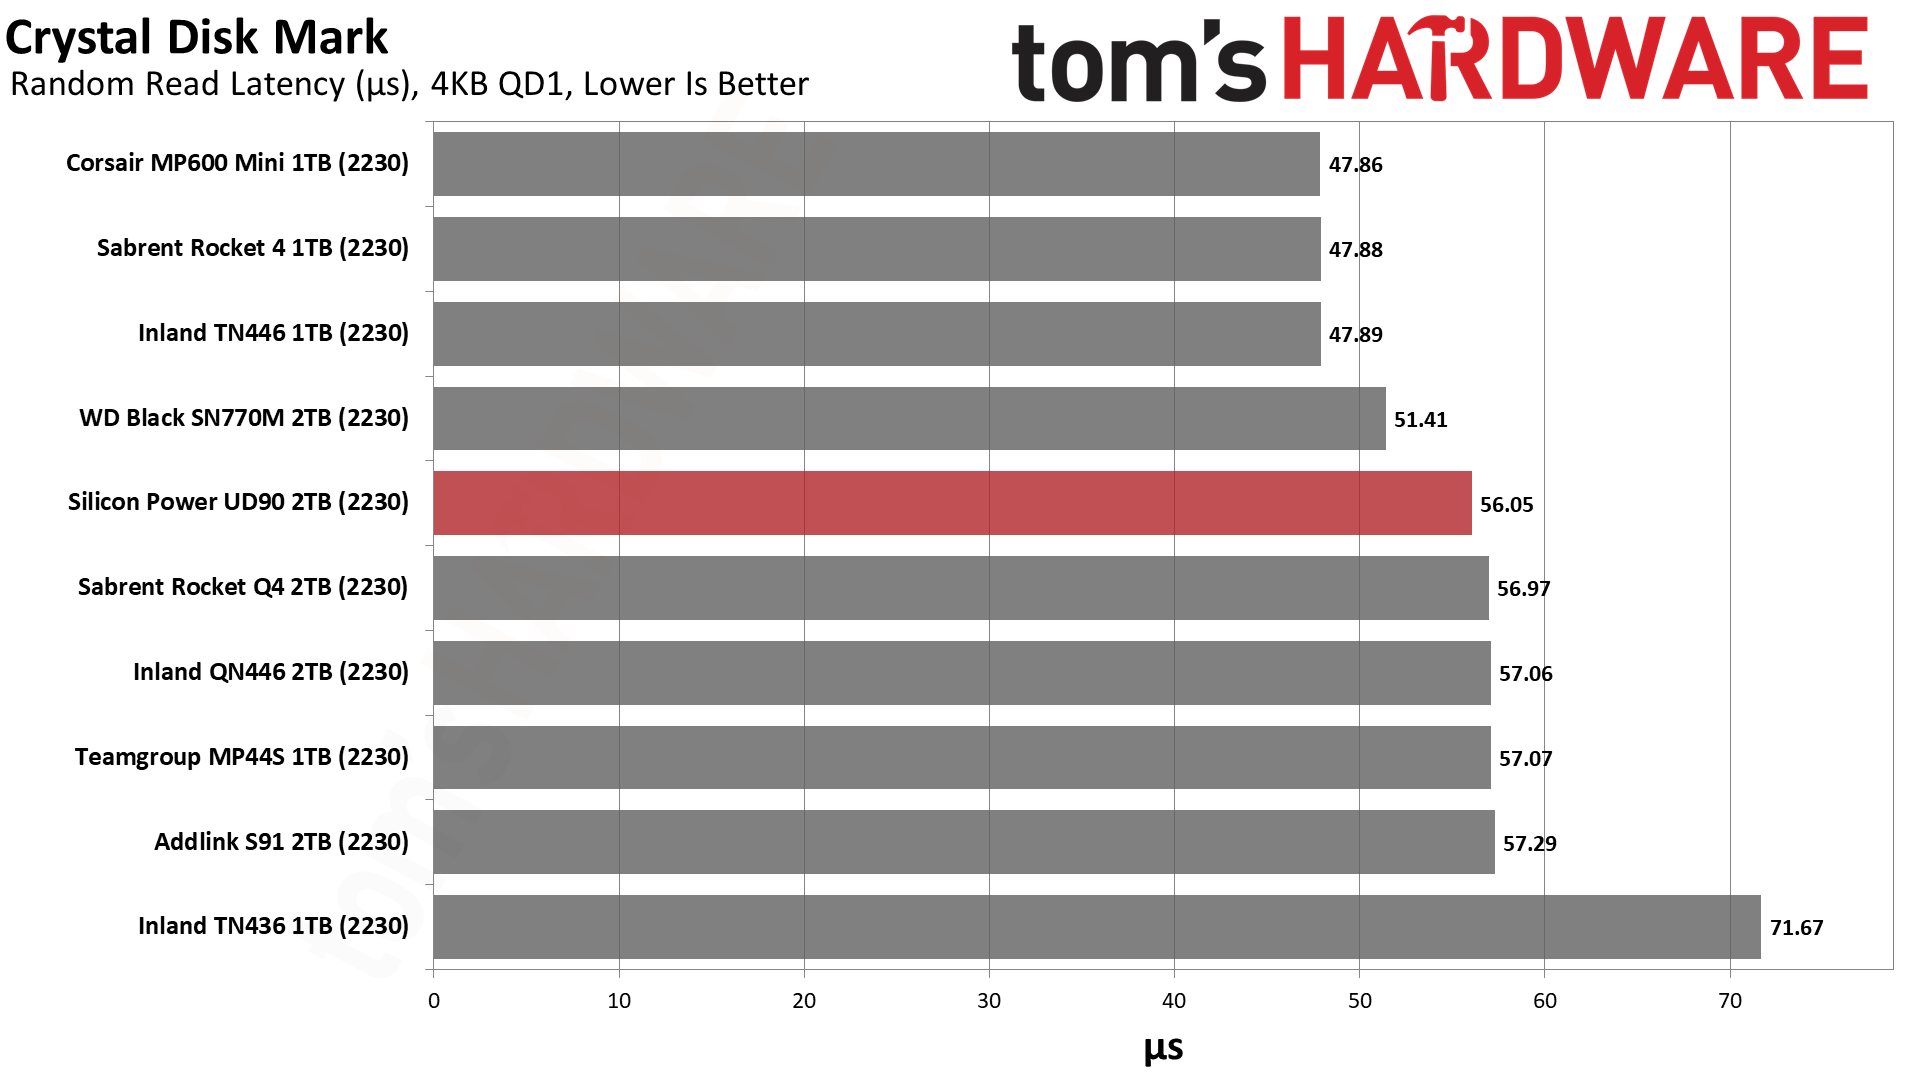
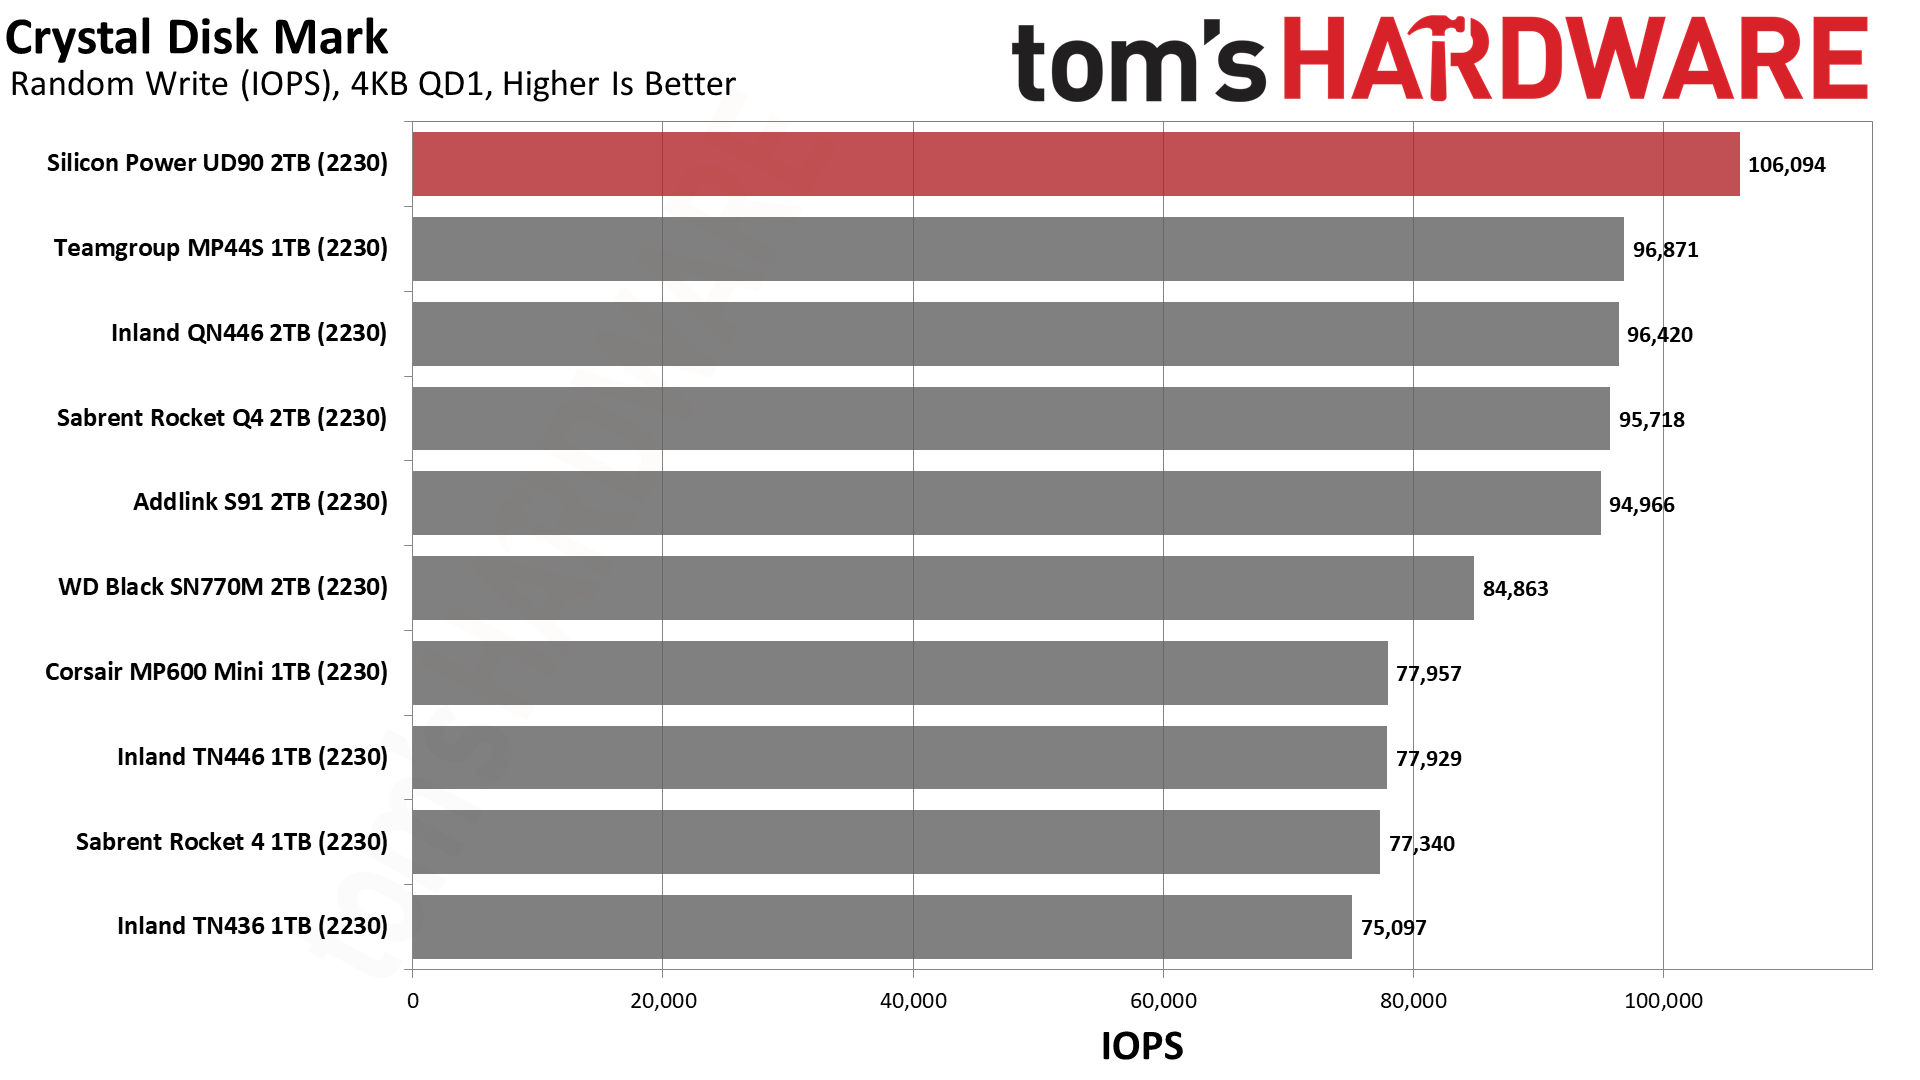
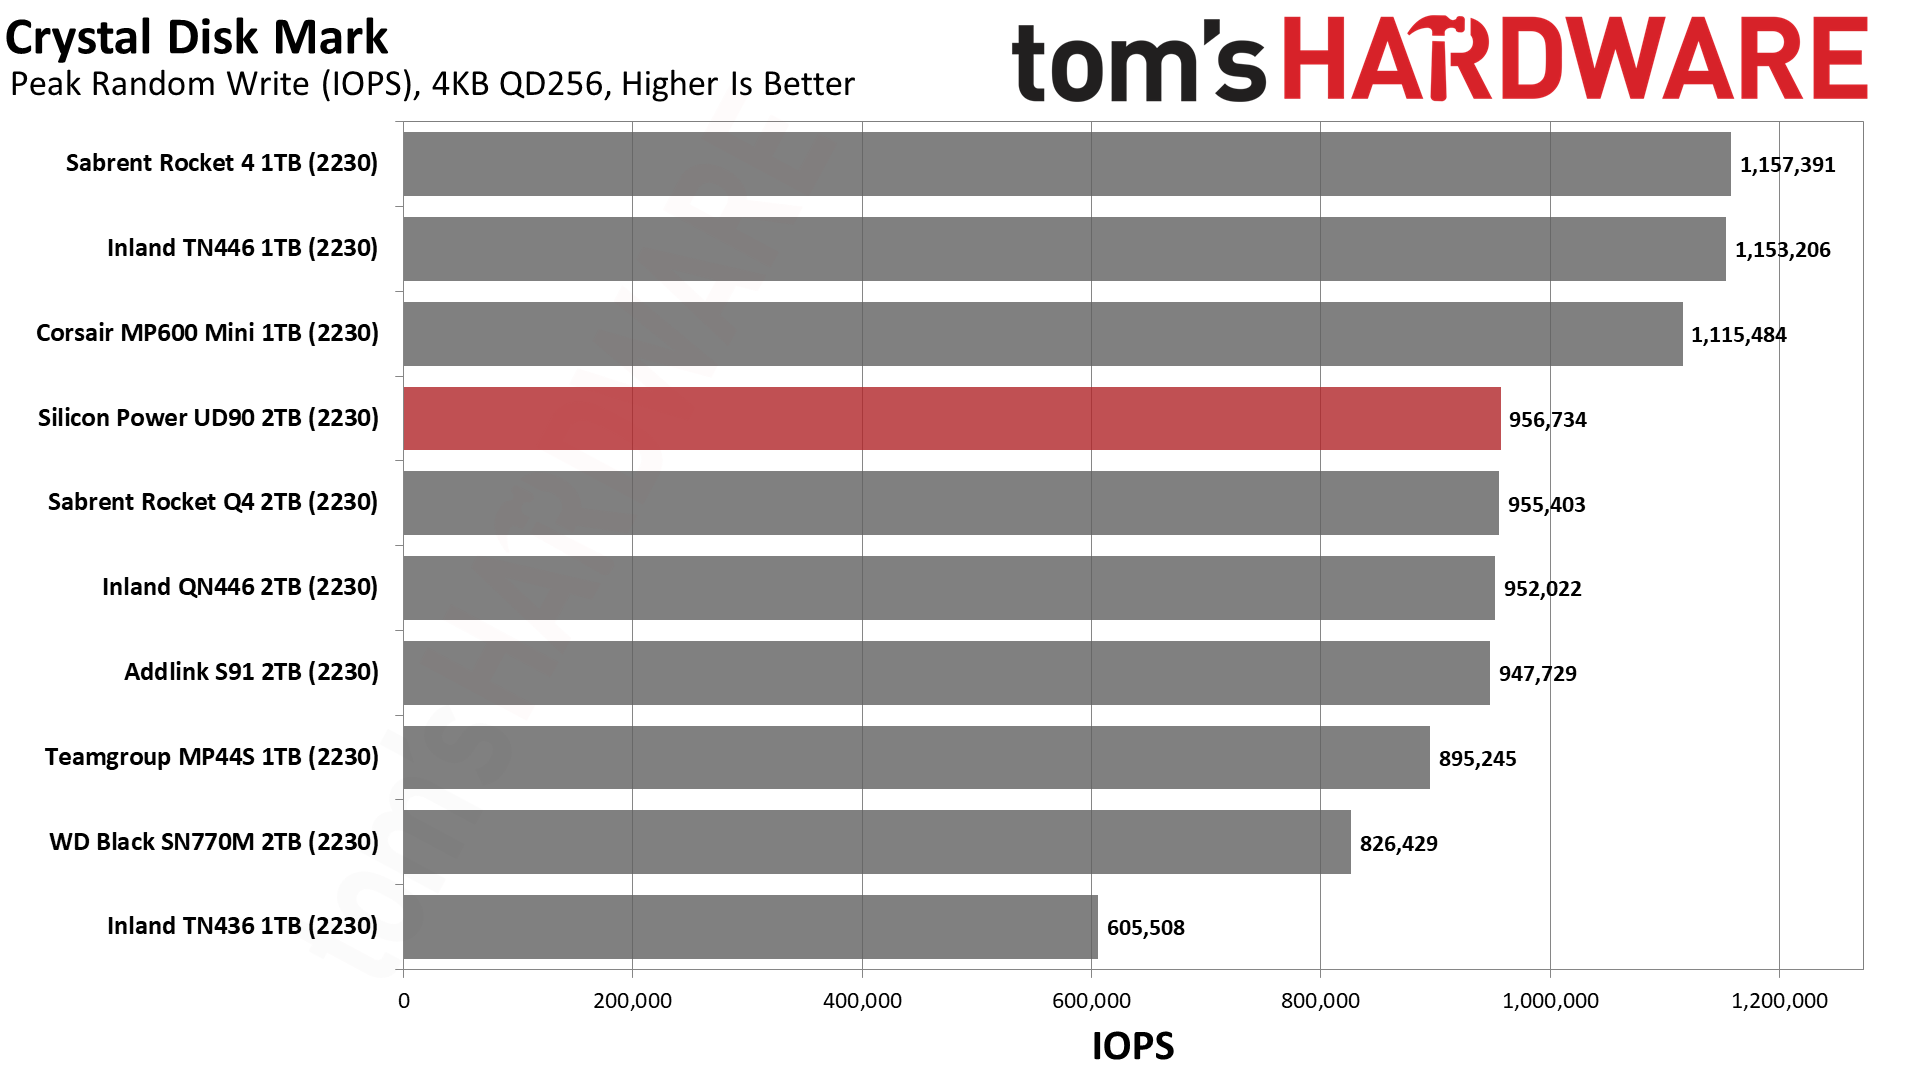
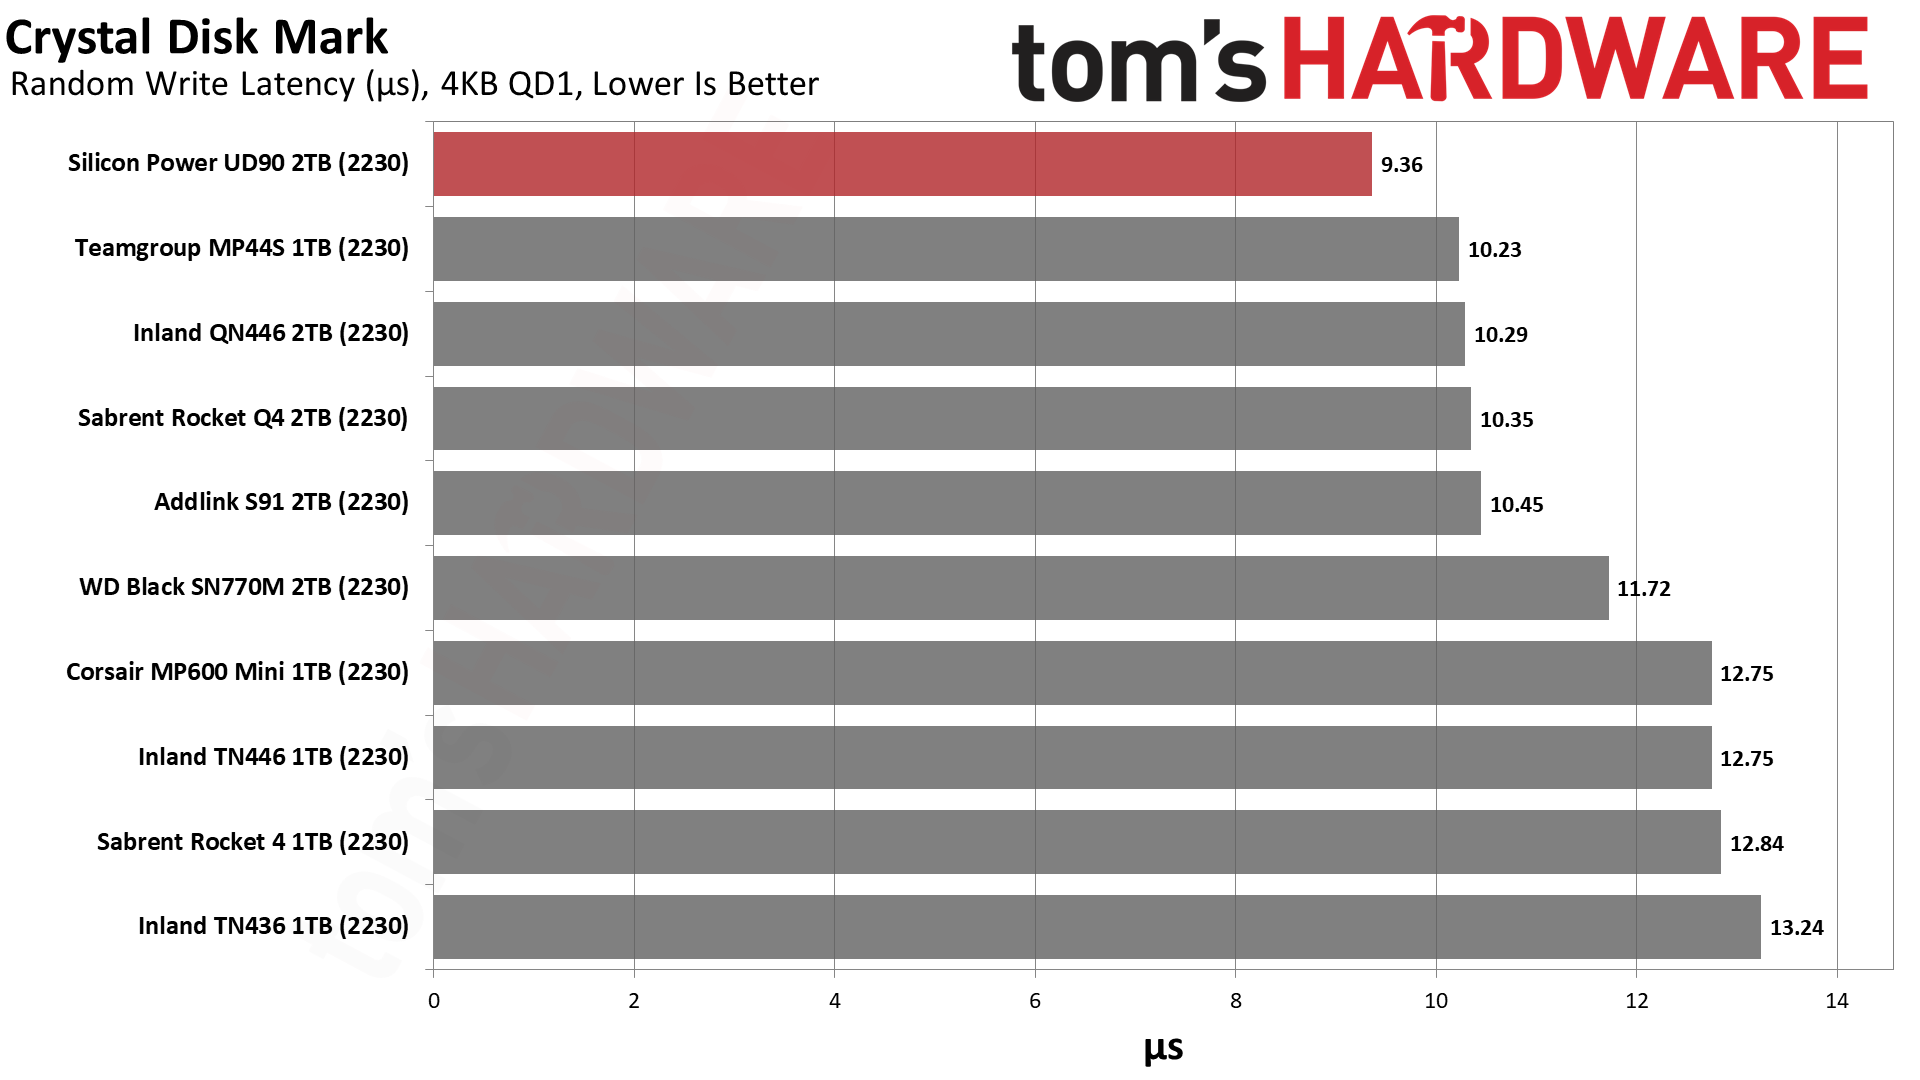
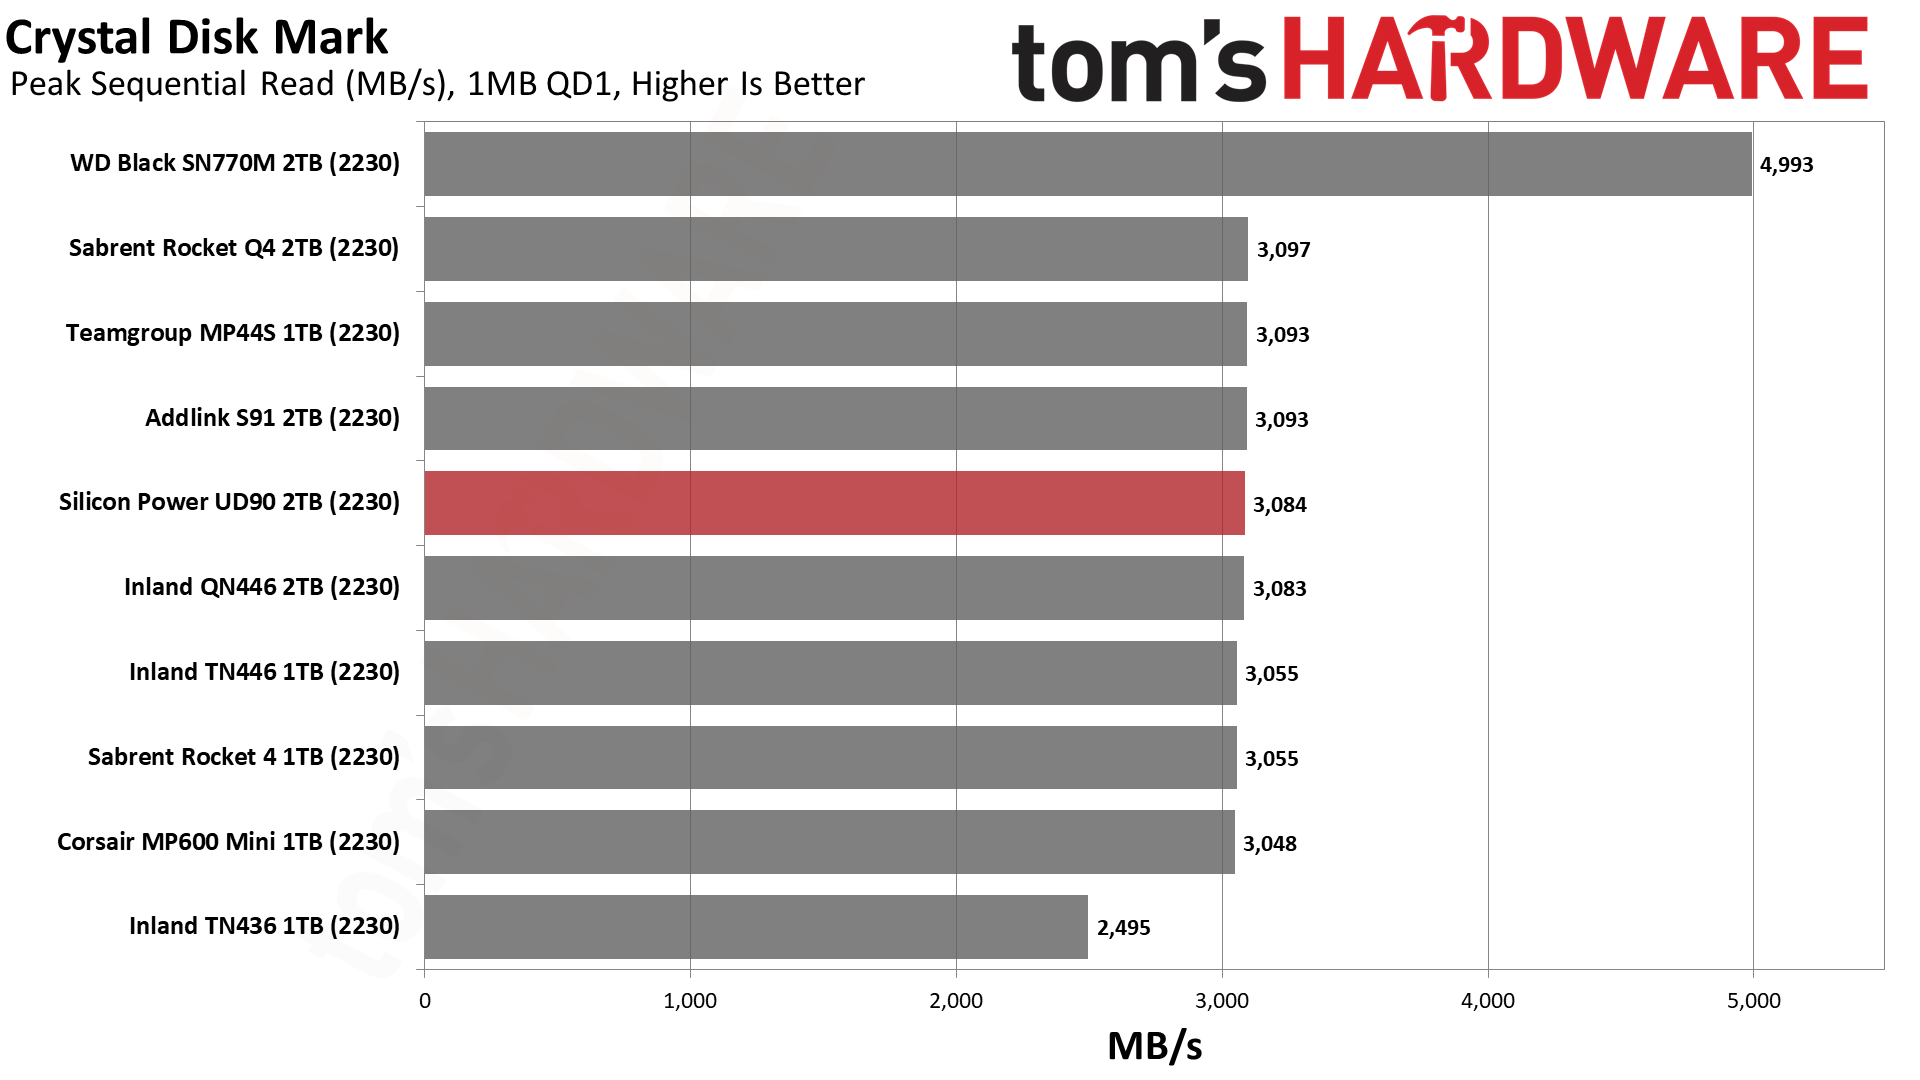
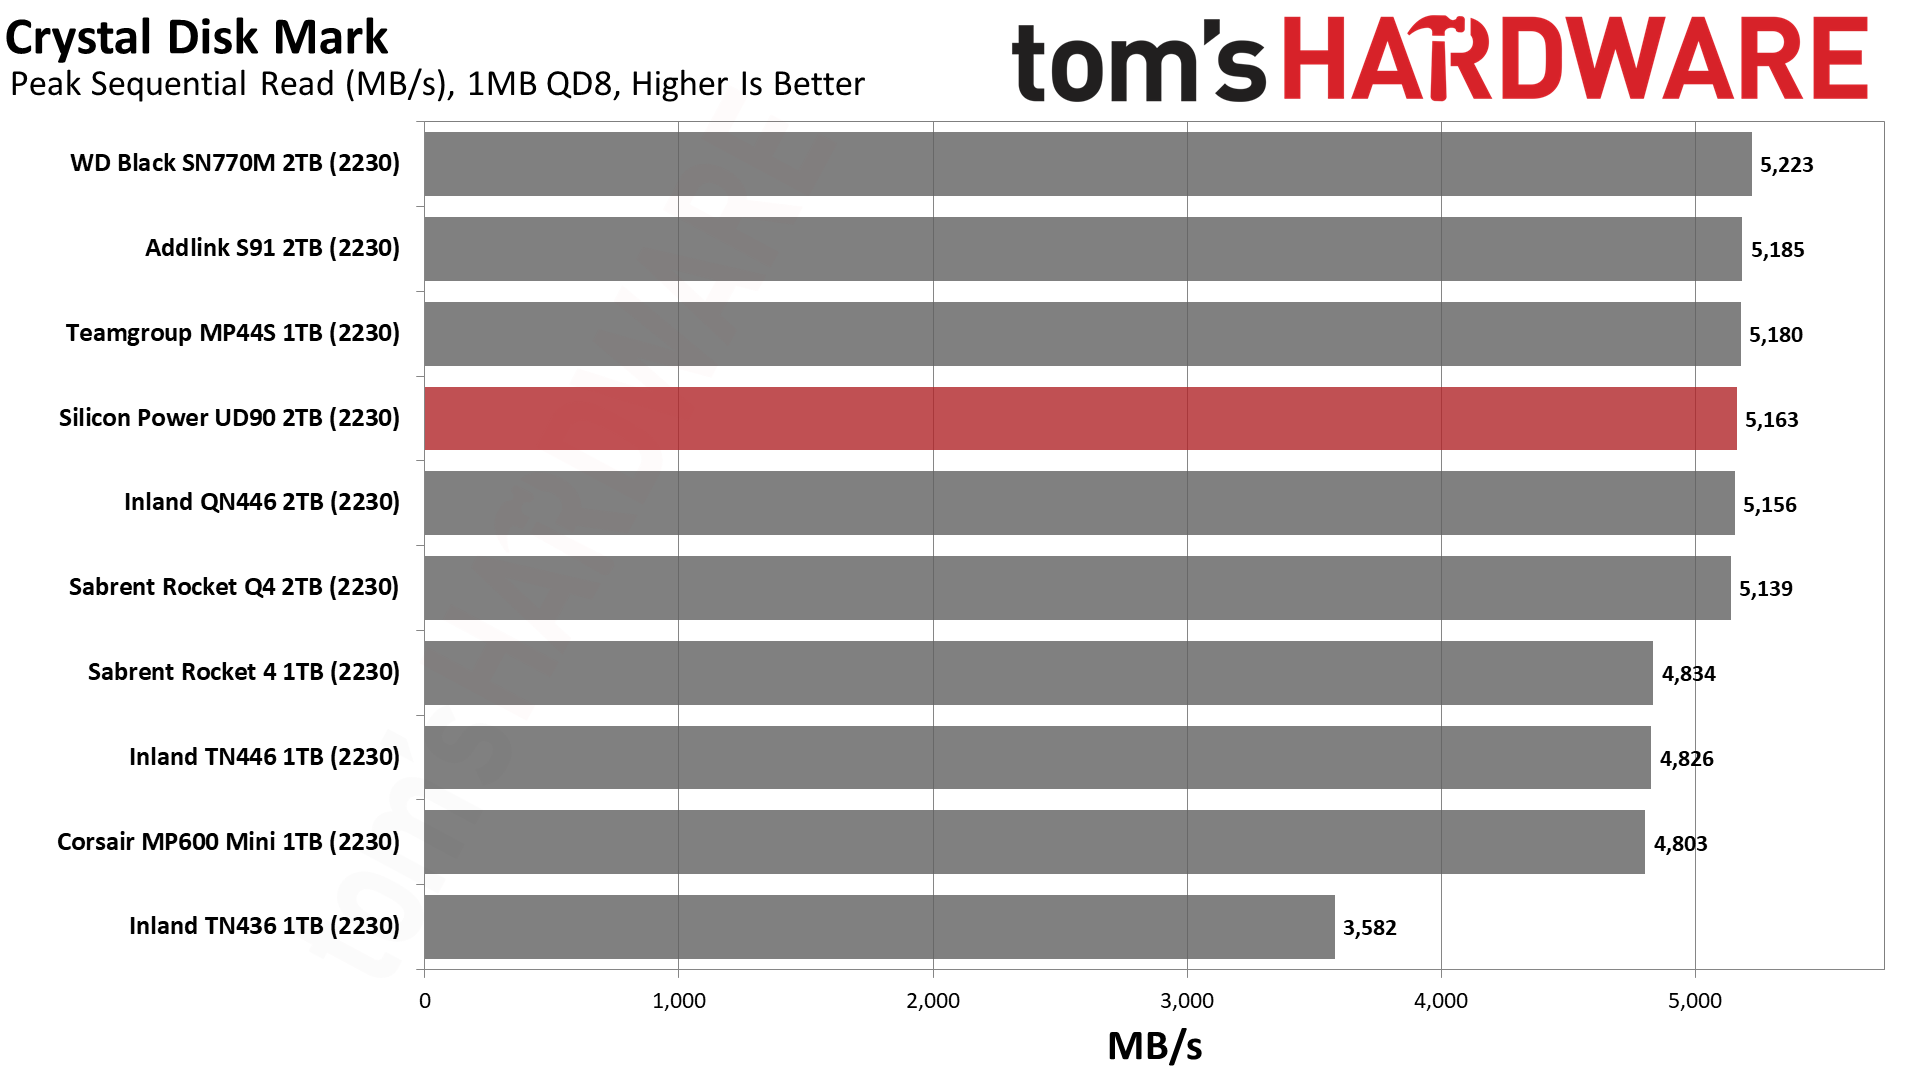
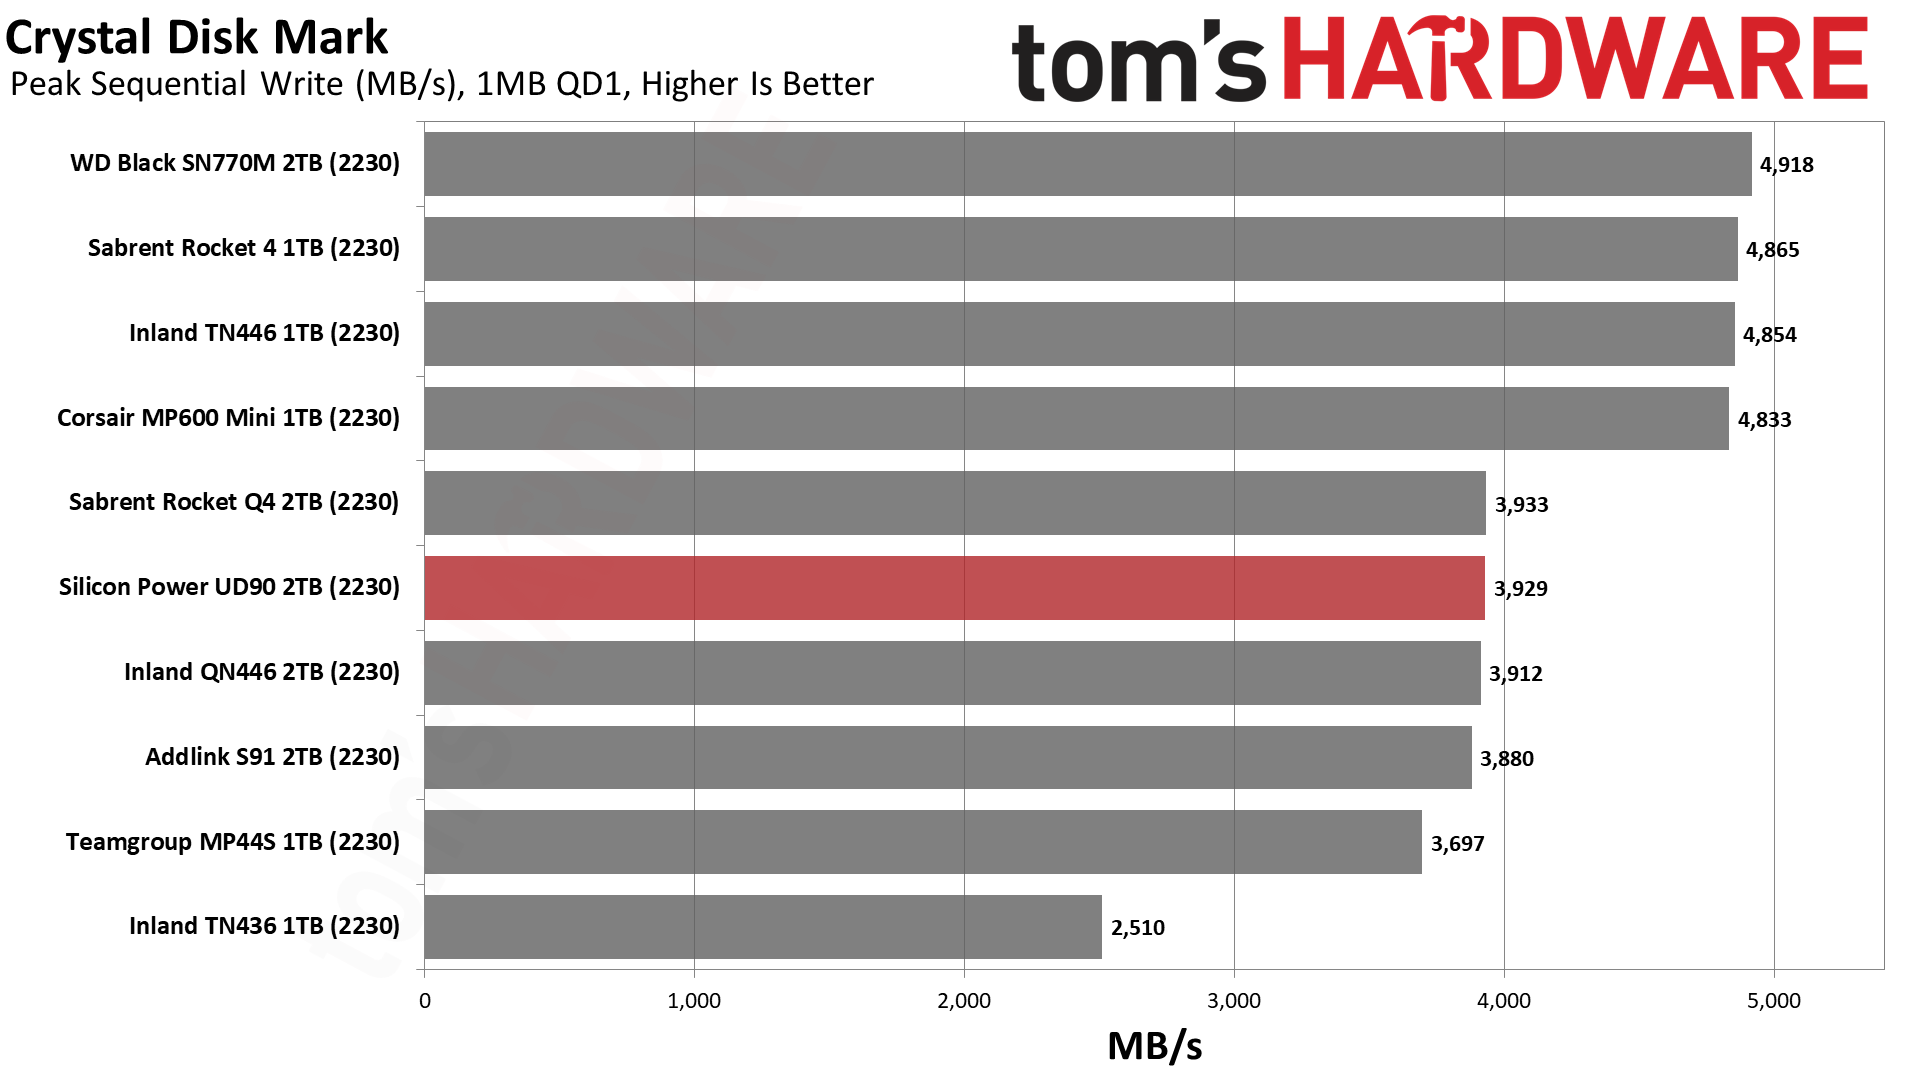
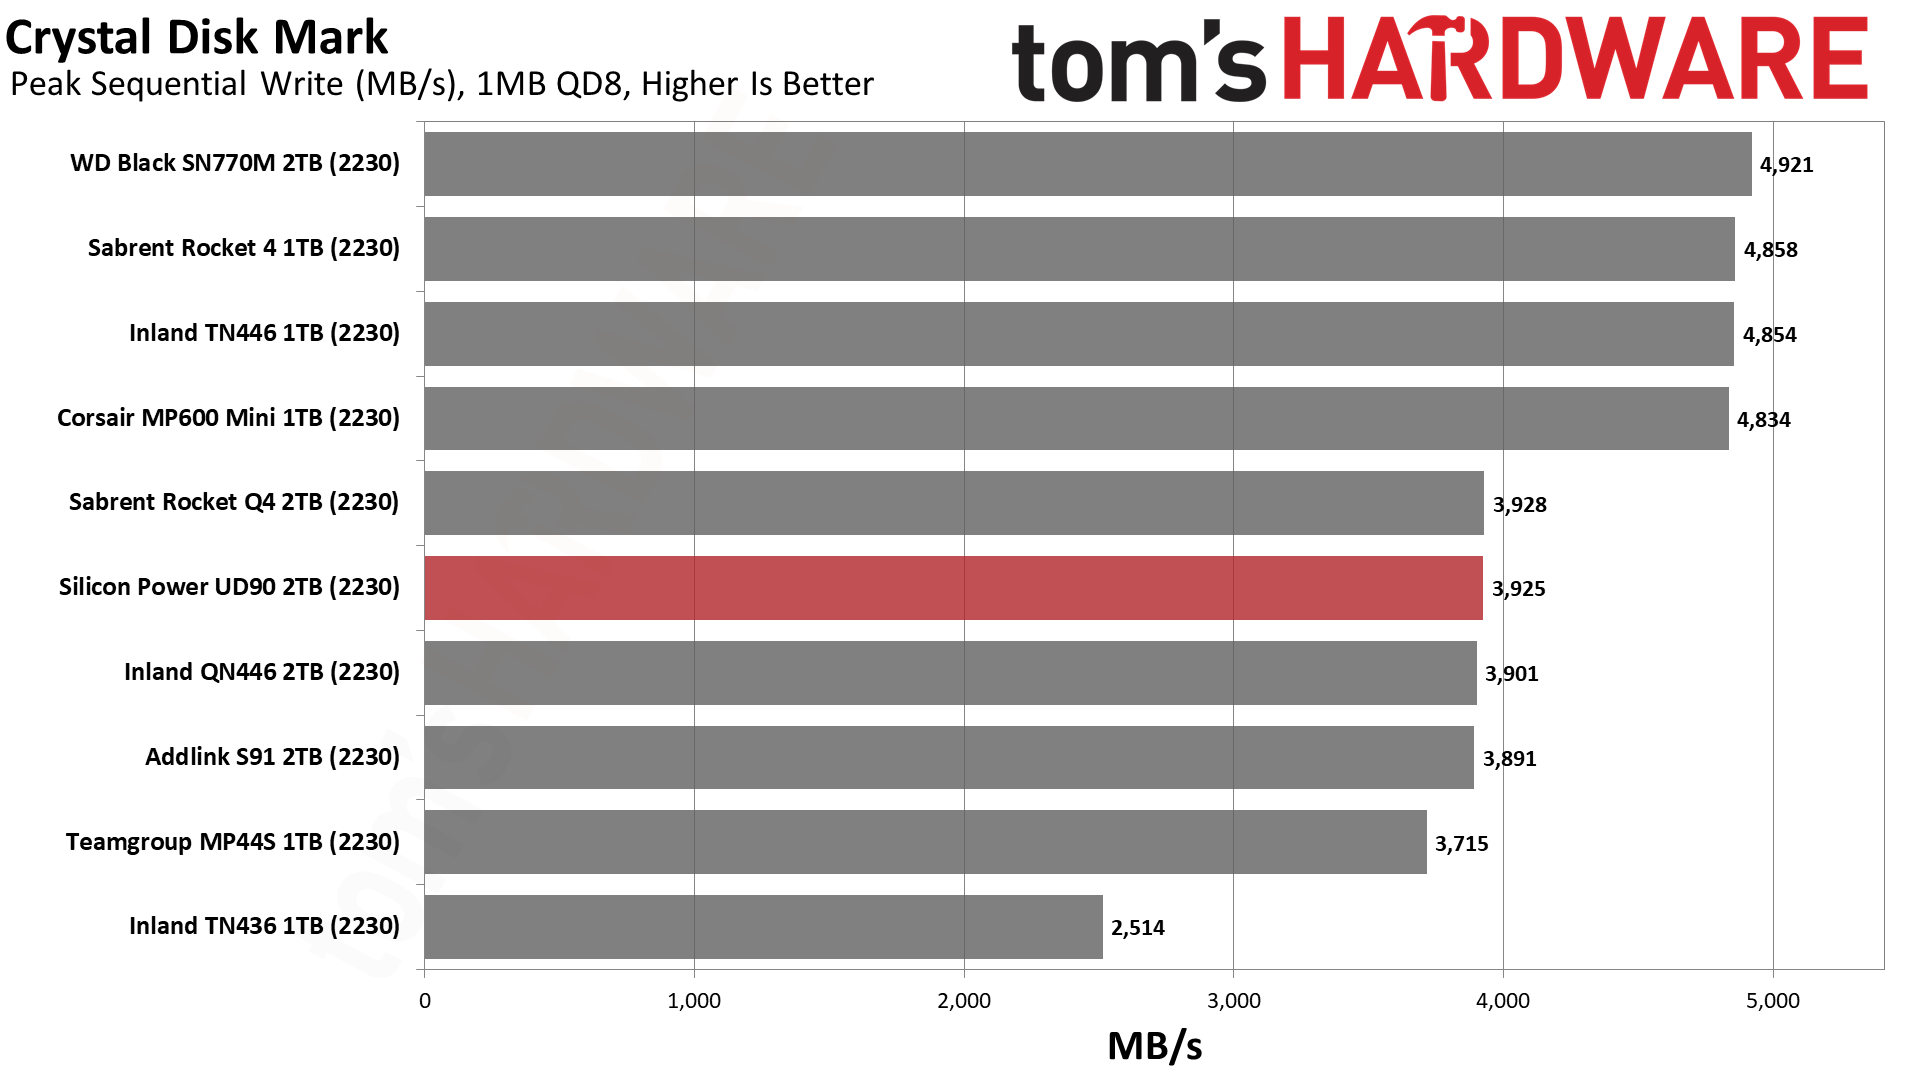
The UD90's 2230 overall pattern for ATTO looks solid. The UD90 2230, in fact, seems to outperform expectations, which is also demonstrated in previous benchmarks. If you think Silicon Power smuggled in higher-quality TLC flash here, we still see the tell-tale signs of QLC flash with CDM’s low queue-depth sequential write and random read results.
The UD90 2230 does stand out with regard to random write latency, though. Although the pSLC write latency range is significantly smaller than deviations for TLC and QLC would be, gains can still be realized from the native flash architecture. Micron’s 176-Layer QLC, for example, has better 4KB QD1 random write latency than its 176-Layer TLC, with both tests falling in pSLC. These architectures are similar but not identical, with QLC often having multi-planar optimizations and potentially a different effective cell size, which can impact program time and retention, much as is experienced differently across word lines positioned in an array.
This doesn’t explain why the UD90 2230 is faster than identical competitors here. We retested to ensure the results. We have indeed seen slower-than-expected results on some sampled drives with lower-grade flash, as with the Teamgroup Cardea A440 Pro. This is not to single out Teamgroup, as this flash sometimes makes its way into drives unintentionally. We’ve also seen higher-grade TLC from Micron, although that’s usually reserved for special drives like Teamgroup’s T-Create Expert.
We’re unaware of a special grade for this QLC, but the possibility exists. The firmware revision, at least, matches the standard UD90. We point out this discrepancy because it’s possible that reviewed drives might perform somewhat differently than the average purchased drive. We can say that the UD90 2230 appears to perform at least as well as expected in our Windows testing but check further below for SteamOS results.
PC Sustained Write Performance and Cache Recovery
Official write specifications are only part of the performance picture. Most SSDs implement a write cache, which is a fast area of (usually) pseudo-SLC programmed flash that absorbs incoming data. Sustained write speeds can suffer tremendously once the workload spills outside of the cache and into the "native" TLC or QLC flash.
We use Iometer to hammer the SSD with sequential writes for 15 minutes to measure both the size of the write cache and performance after the cache is saturated. We also monitor cache recovery via multiple idle rounds.
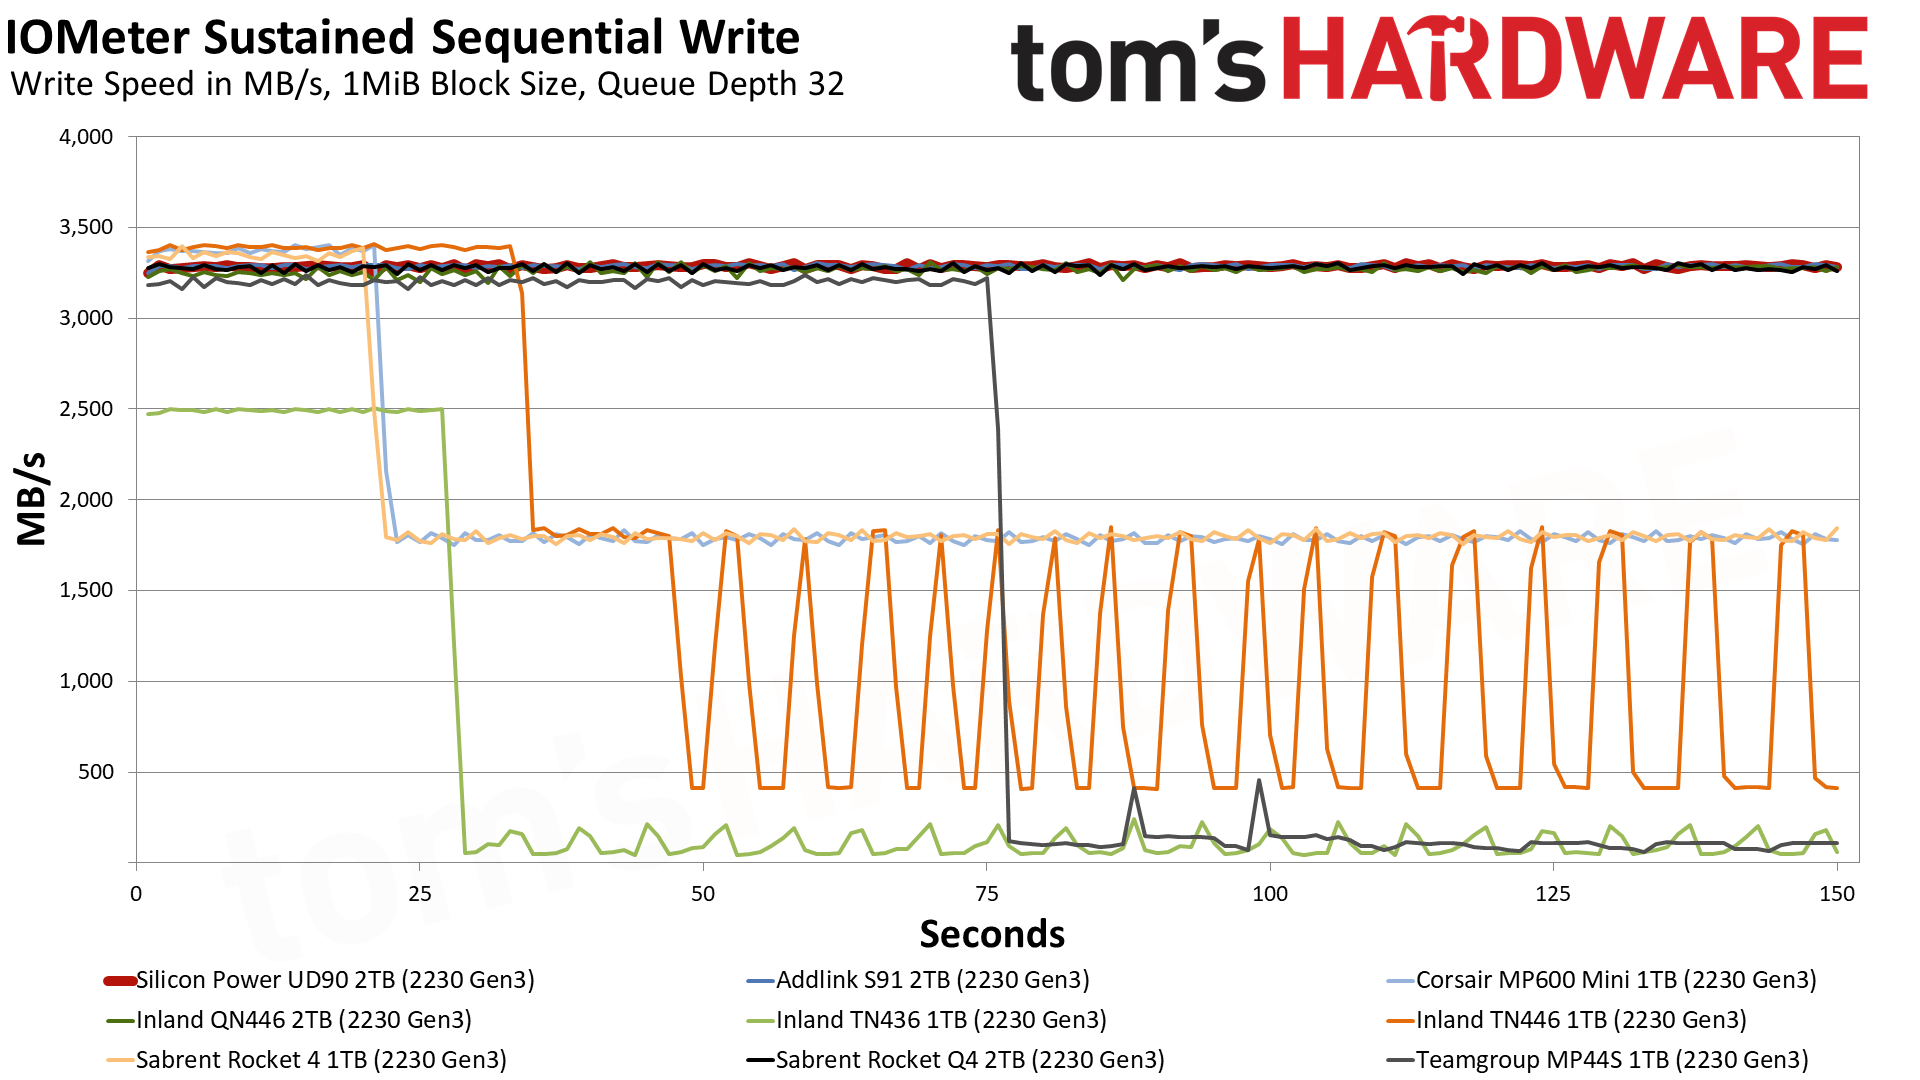
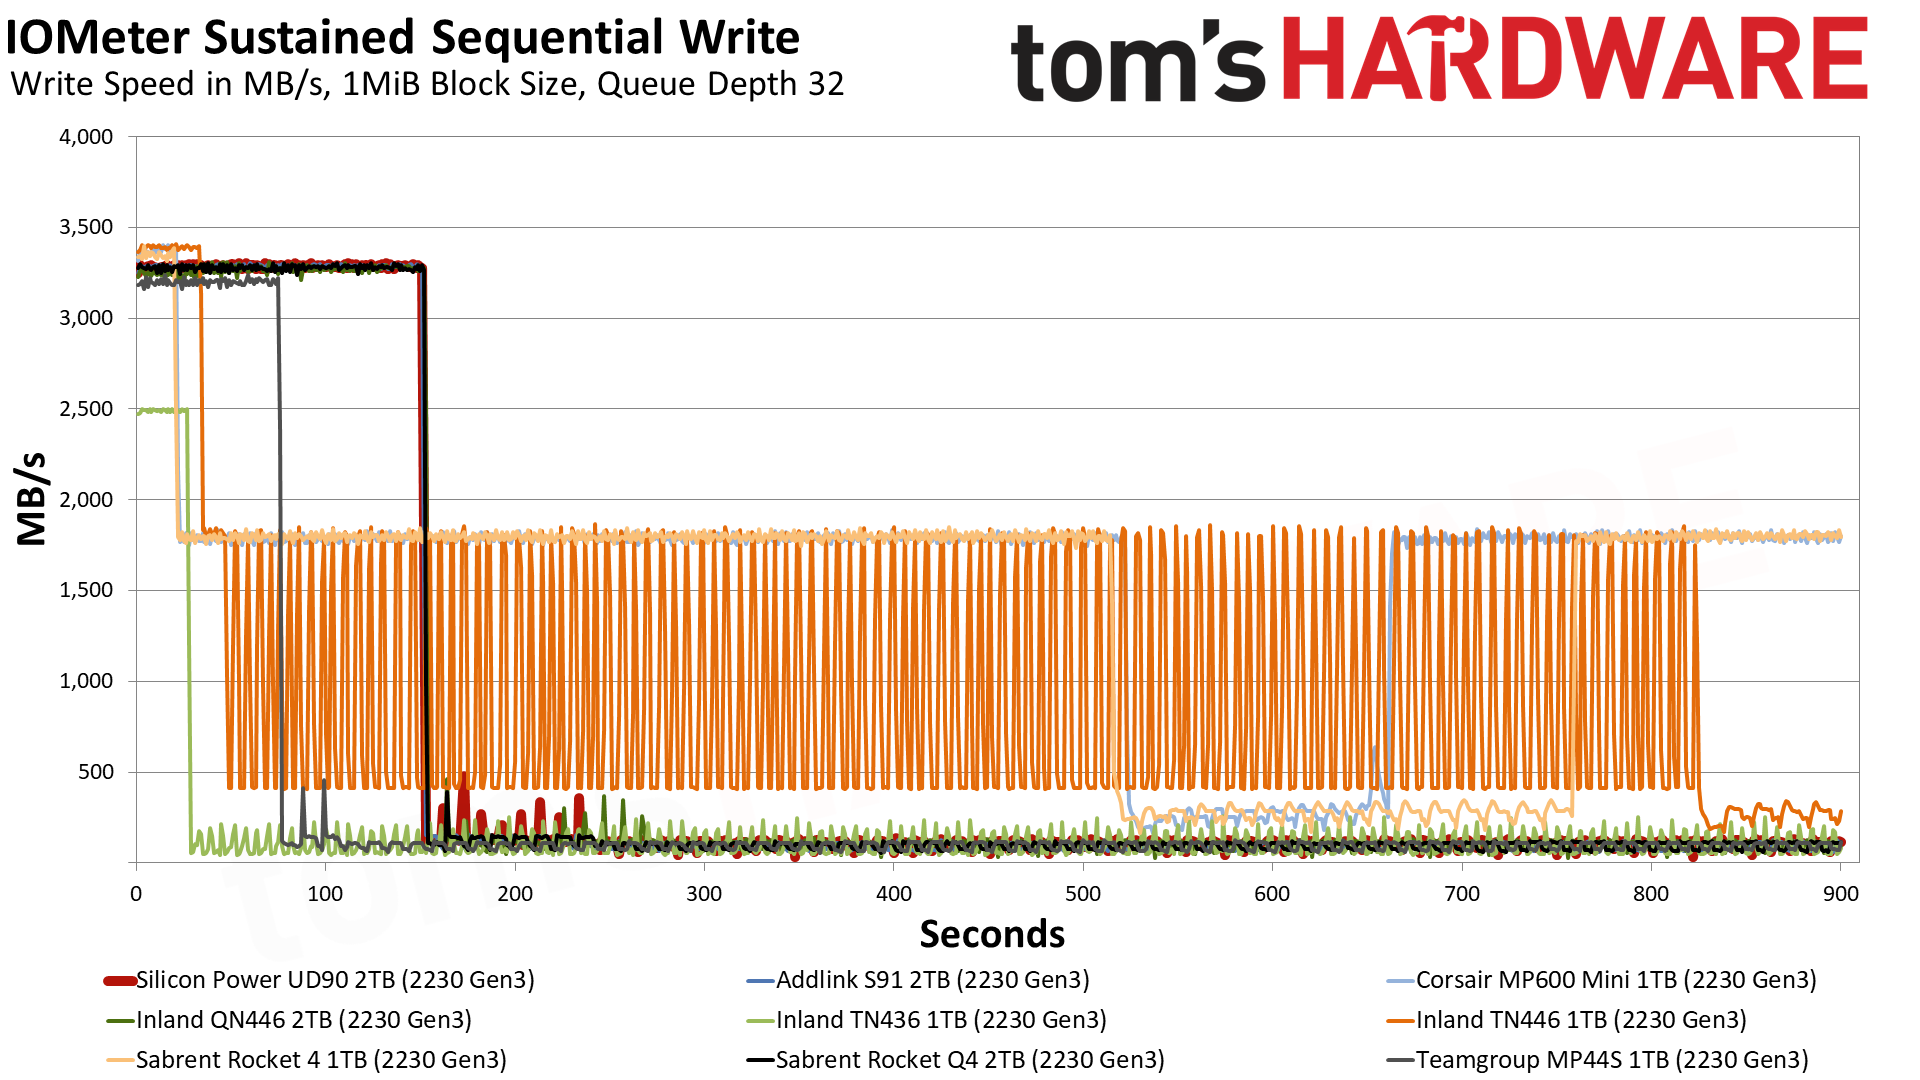
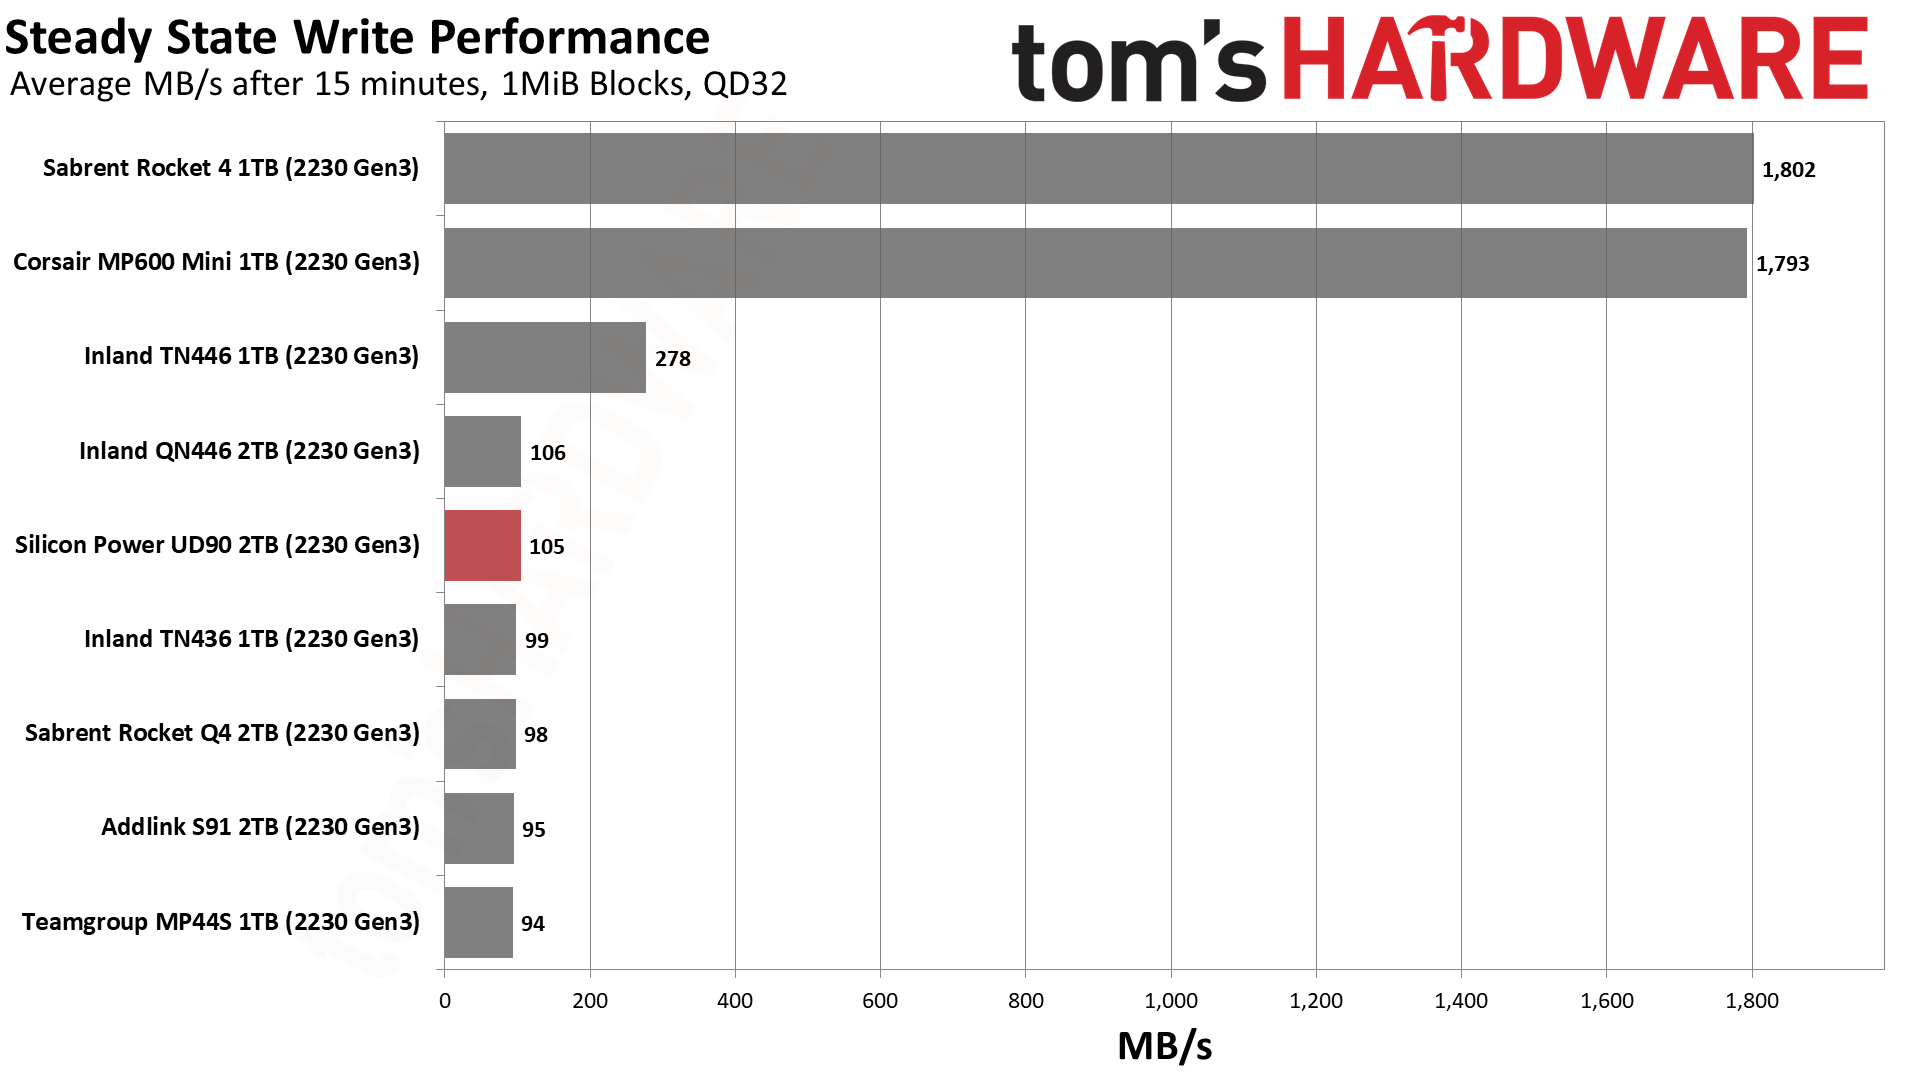
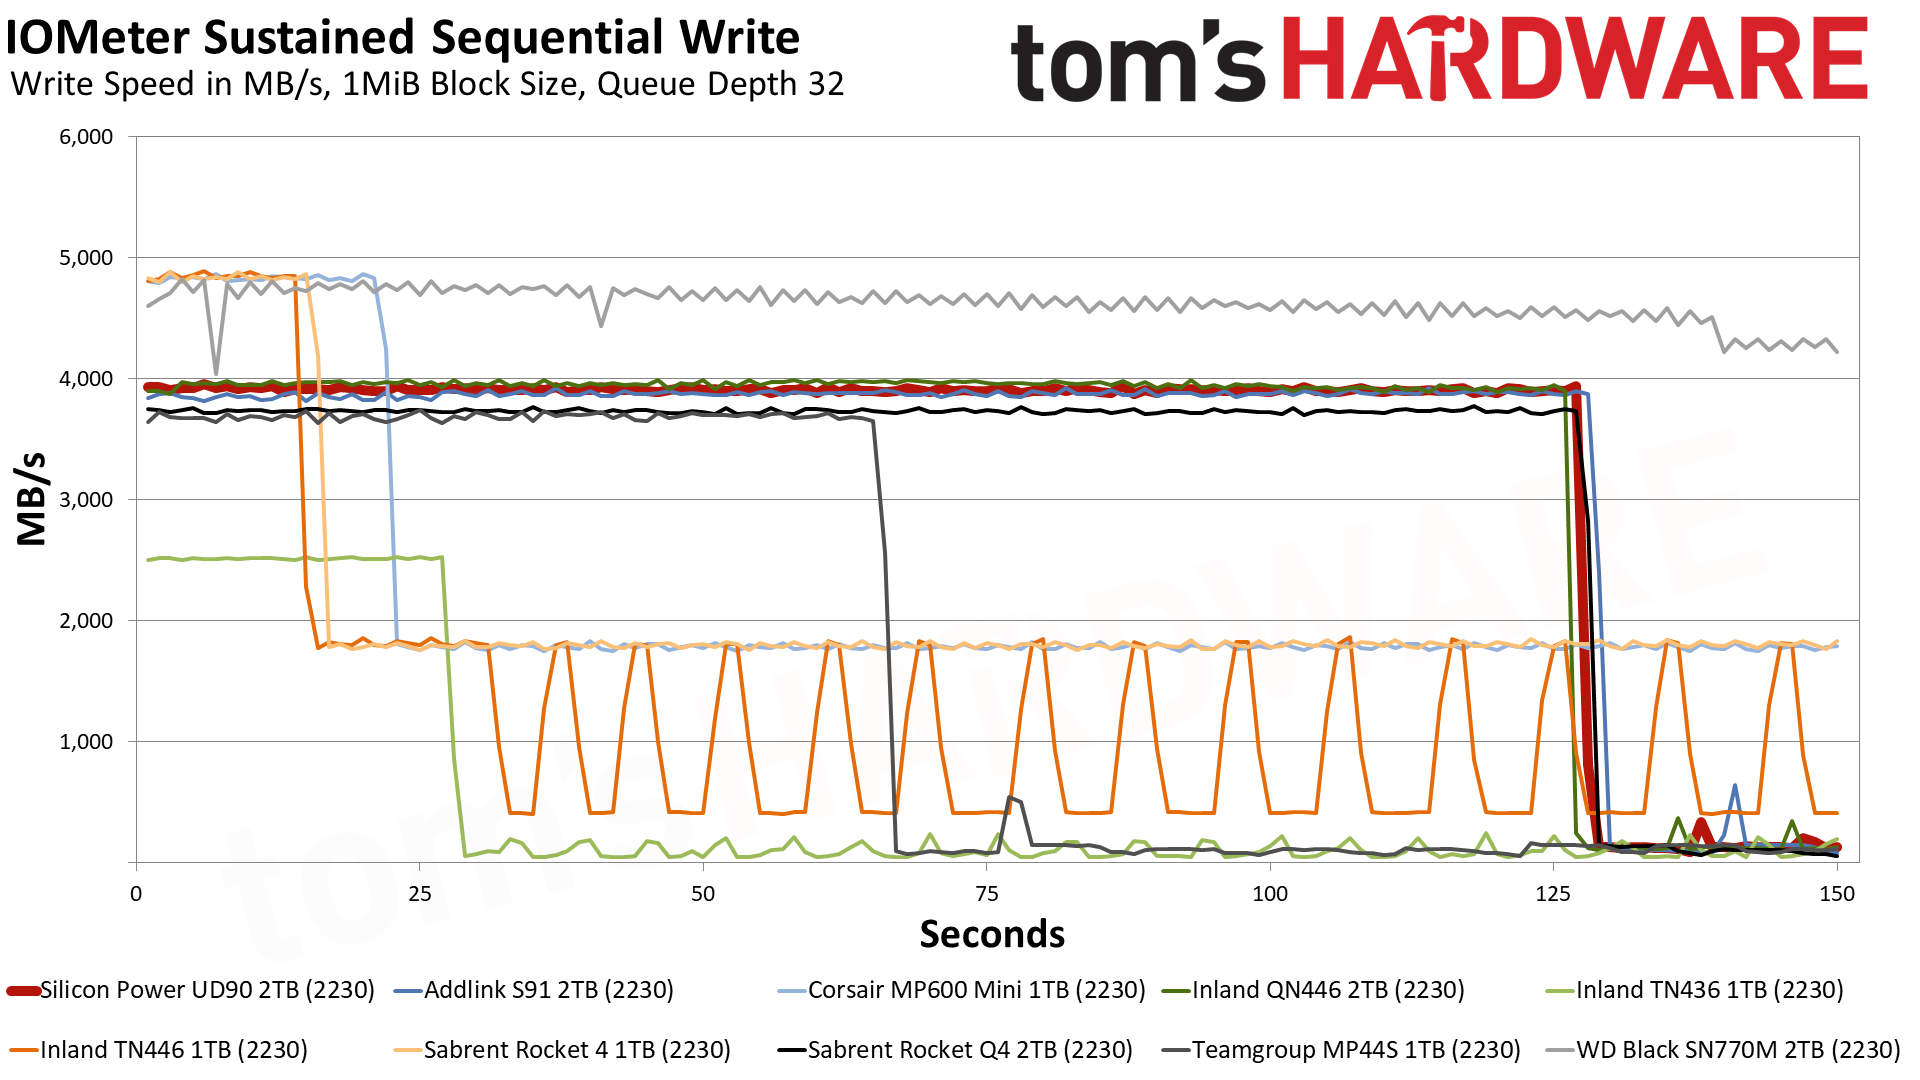
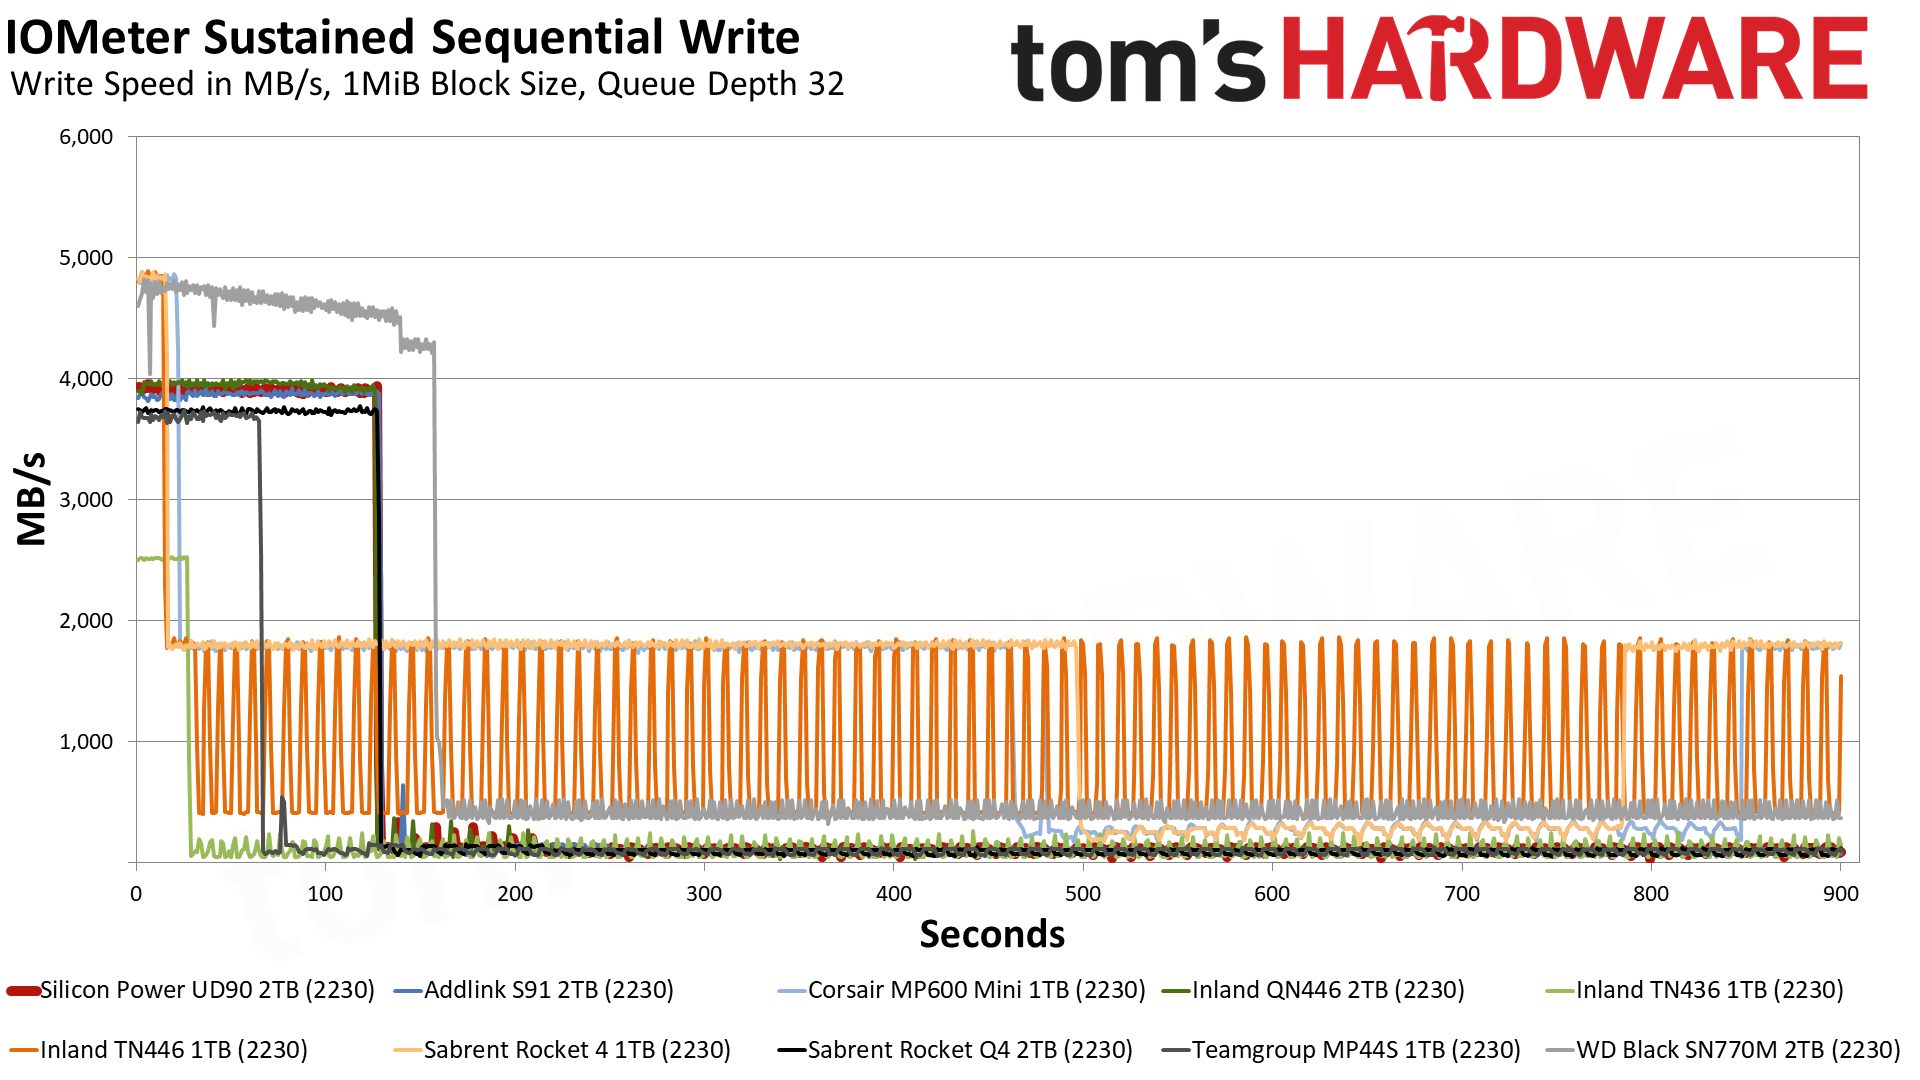
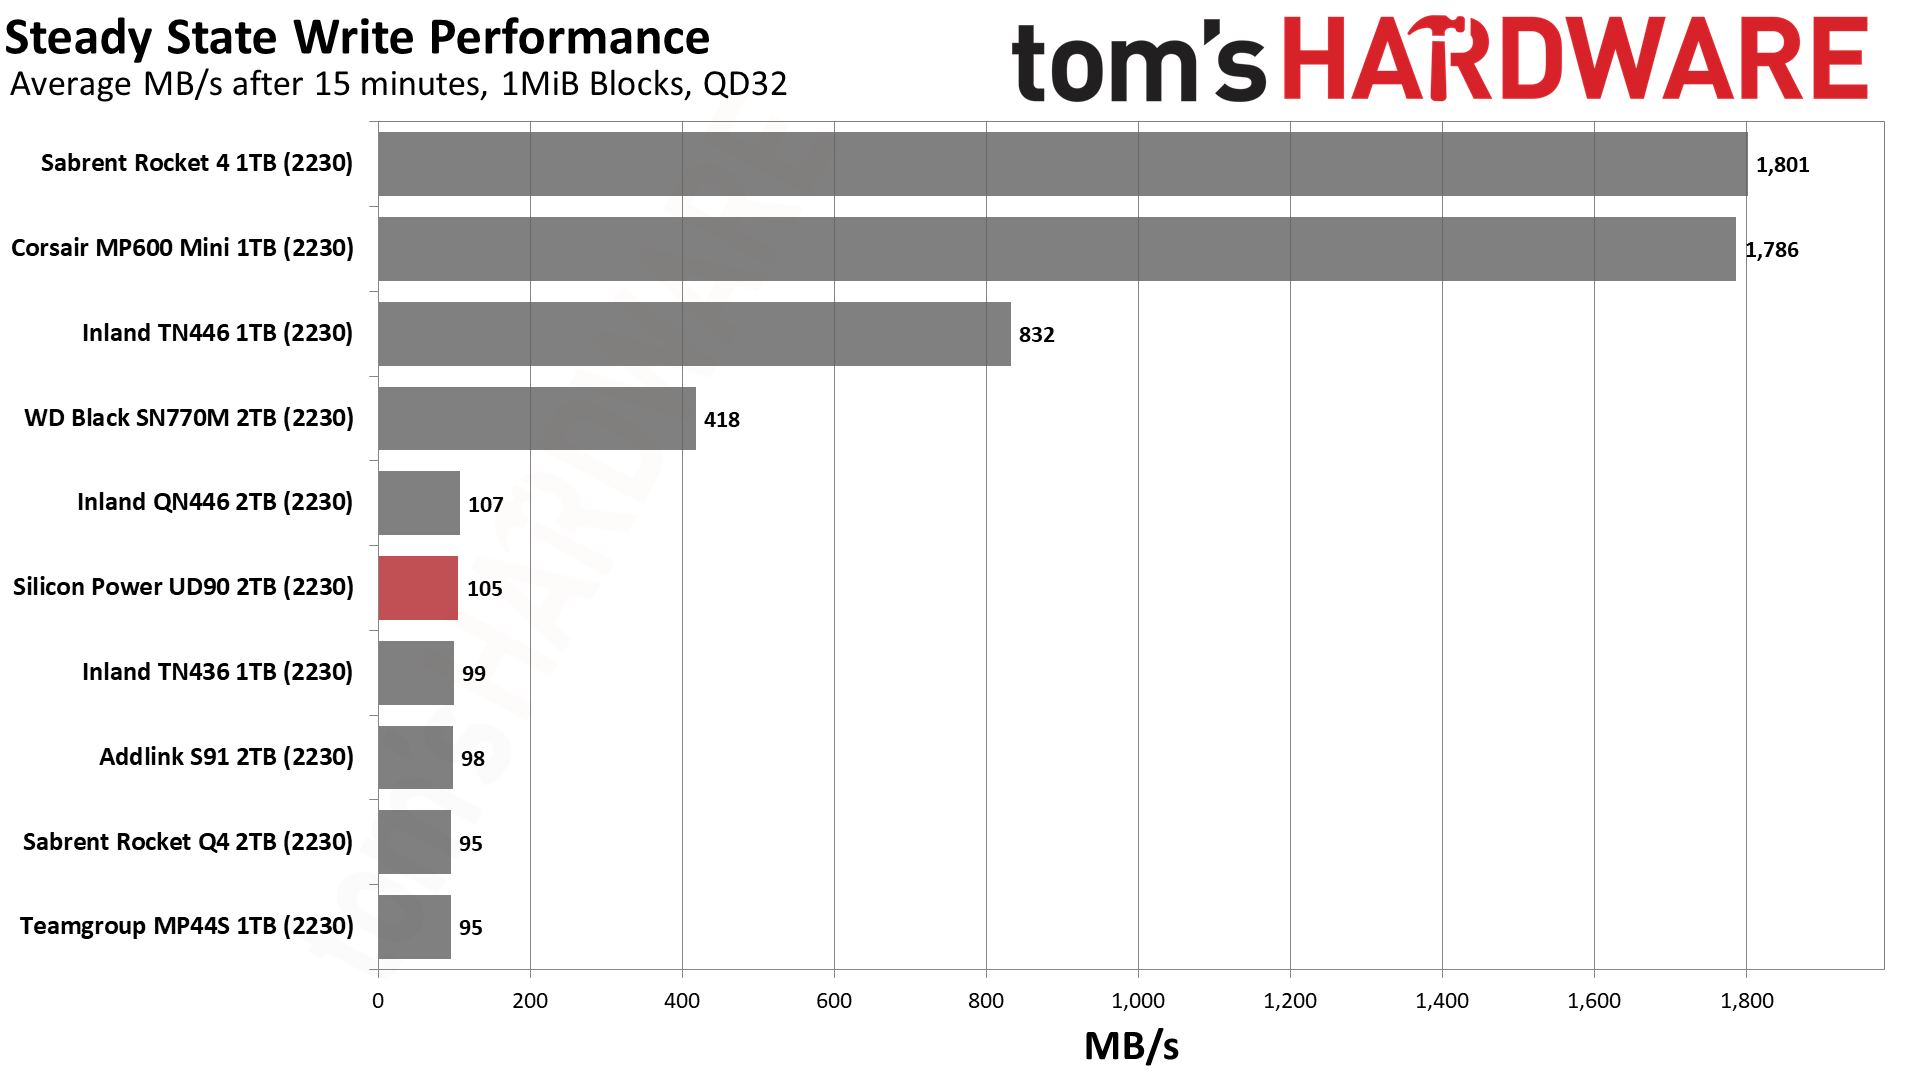
QLC can’t escape poor native sequential write performance. The 2TB UD90 2230 writes at maximum speed in pSLC mode, up over 3.7 GB/s in PCIe 4.0 mode, for the entire length of its cache before falling to a QLC folding mode. The cache is massive, up to one-quarter of the drive’s capacity. This cache will shrink with drive usage while maintaining a 1/4th ratio to free user capacity. Folding performance ends up being around 100 MB/s. This aggressive cache requires some rapid recovery to help hide the performance pitfall.
Power Consumption
We use the Quarch HD Programmable Power Module to gain a deeper understanding of power characteristics. Idle power consumption is an important aspect to consider, especially if you're looking for a laptop upgrade as even the best ultrabooks can have mediocre storage.
Some SSDs can consume watts of power at idle while better-suited ones sip just milliwatts. Average workload power consumption and max consumption are two other aspects of power consumption, but performance-per-watt is more important. A drive might consume more power during any given workload, but accomplishing a task faster allows the drive to drop into an idle state more quickly, ultimately saving energy.
For temperature recording we currently poll the drive’s primary composite sensor during testing with a 24C ambient.
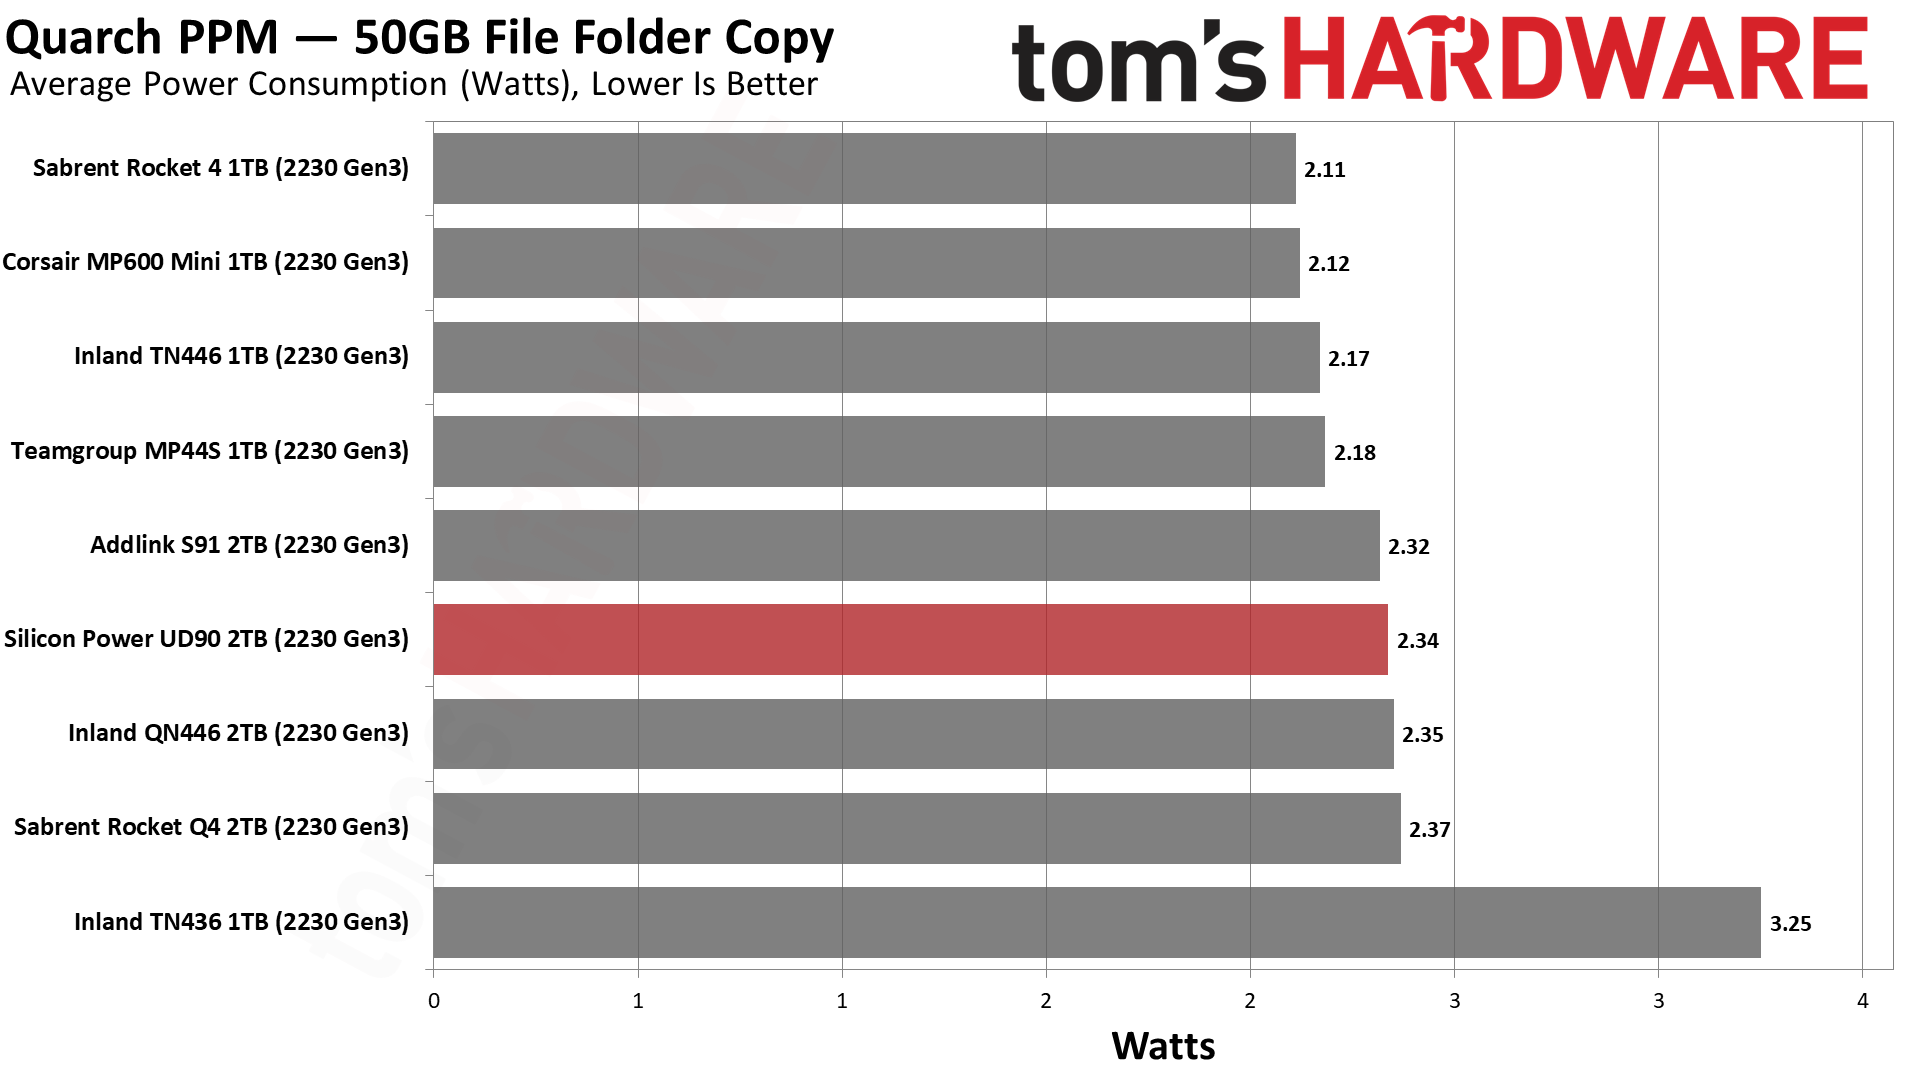
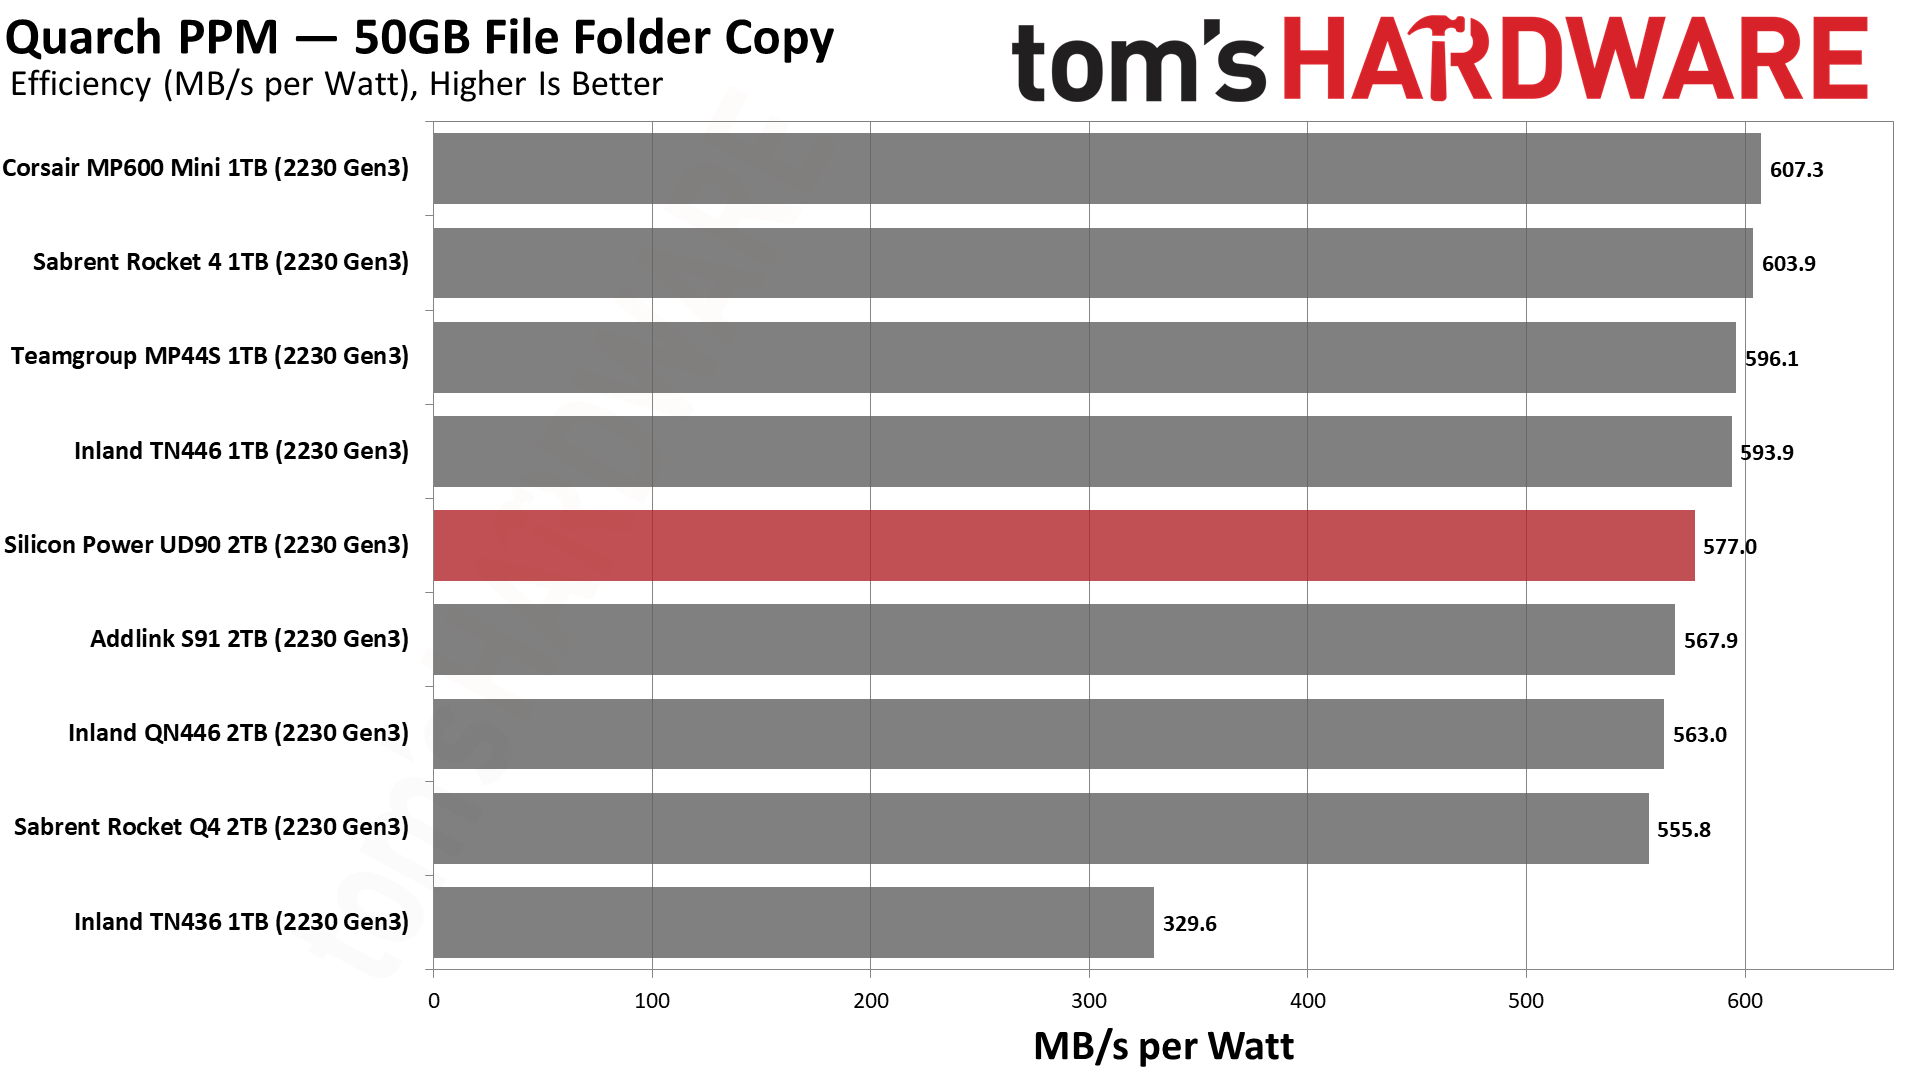
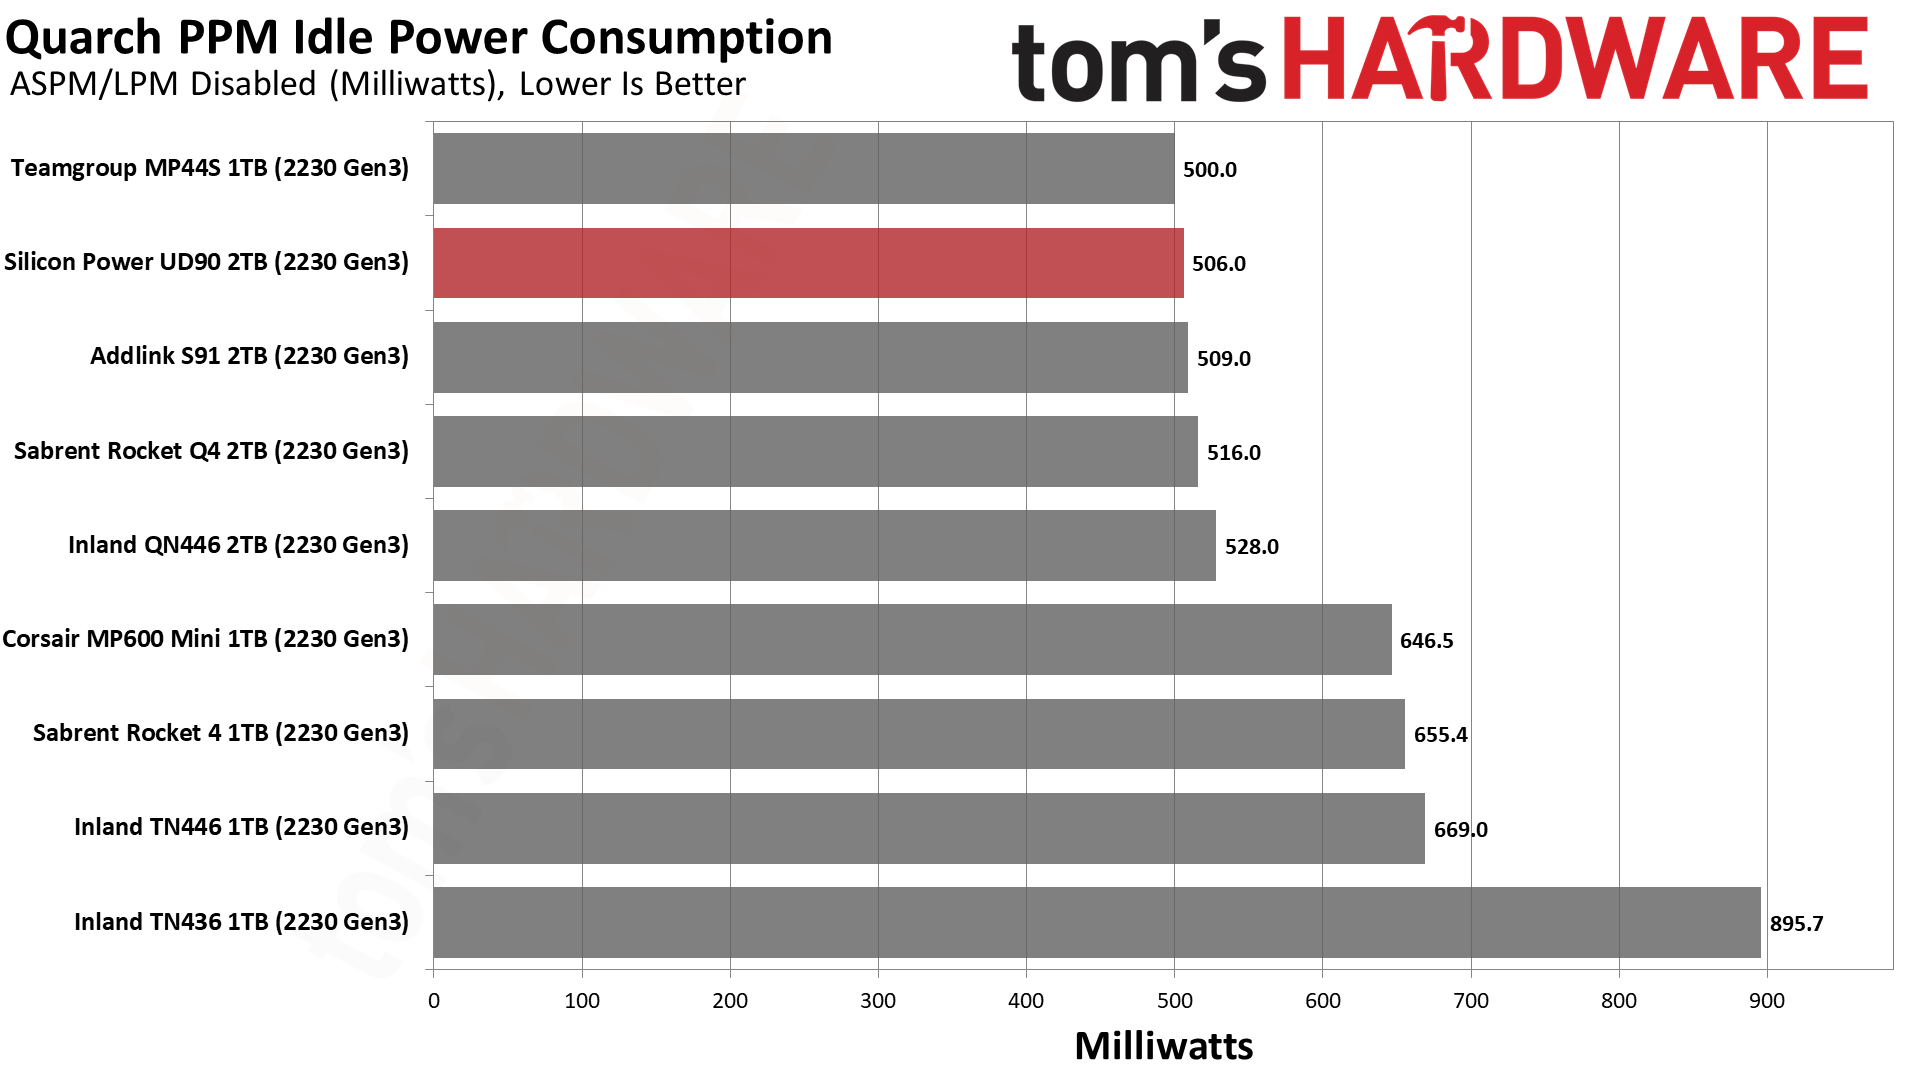
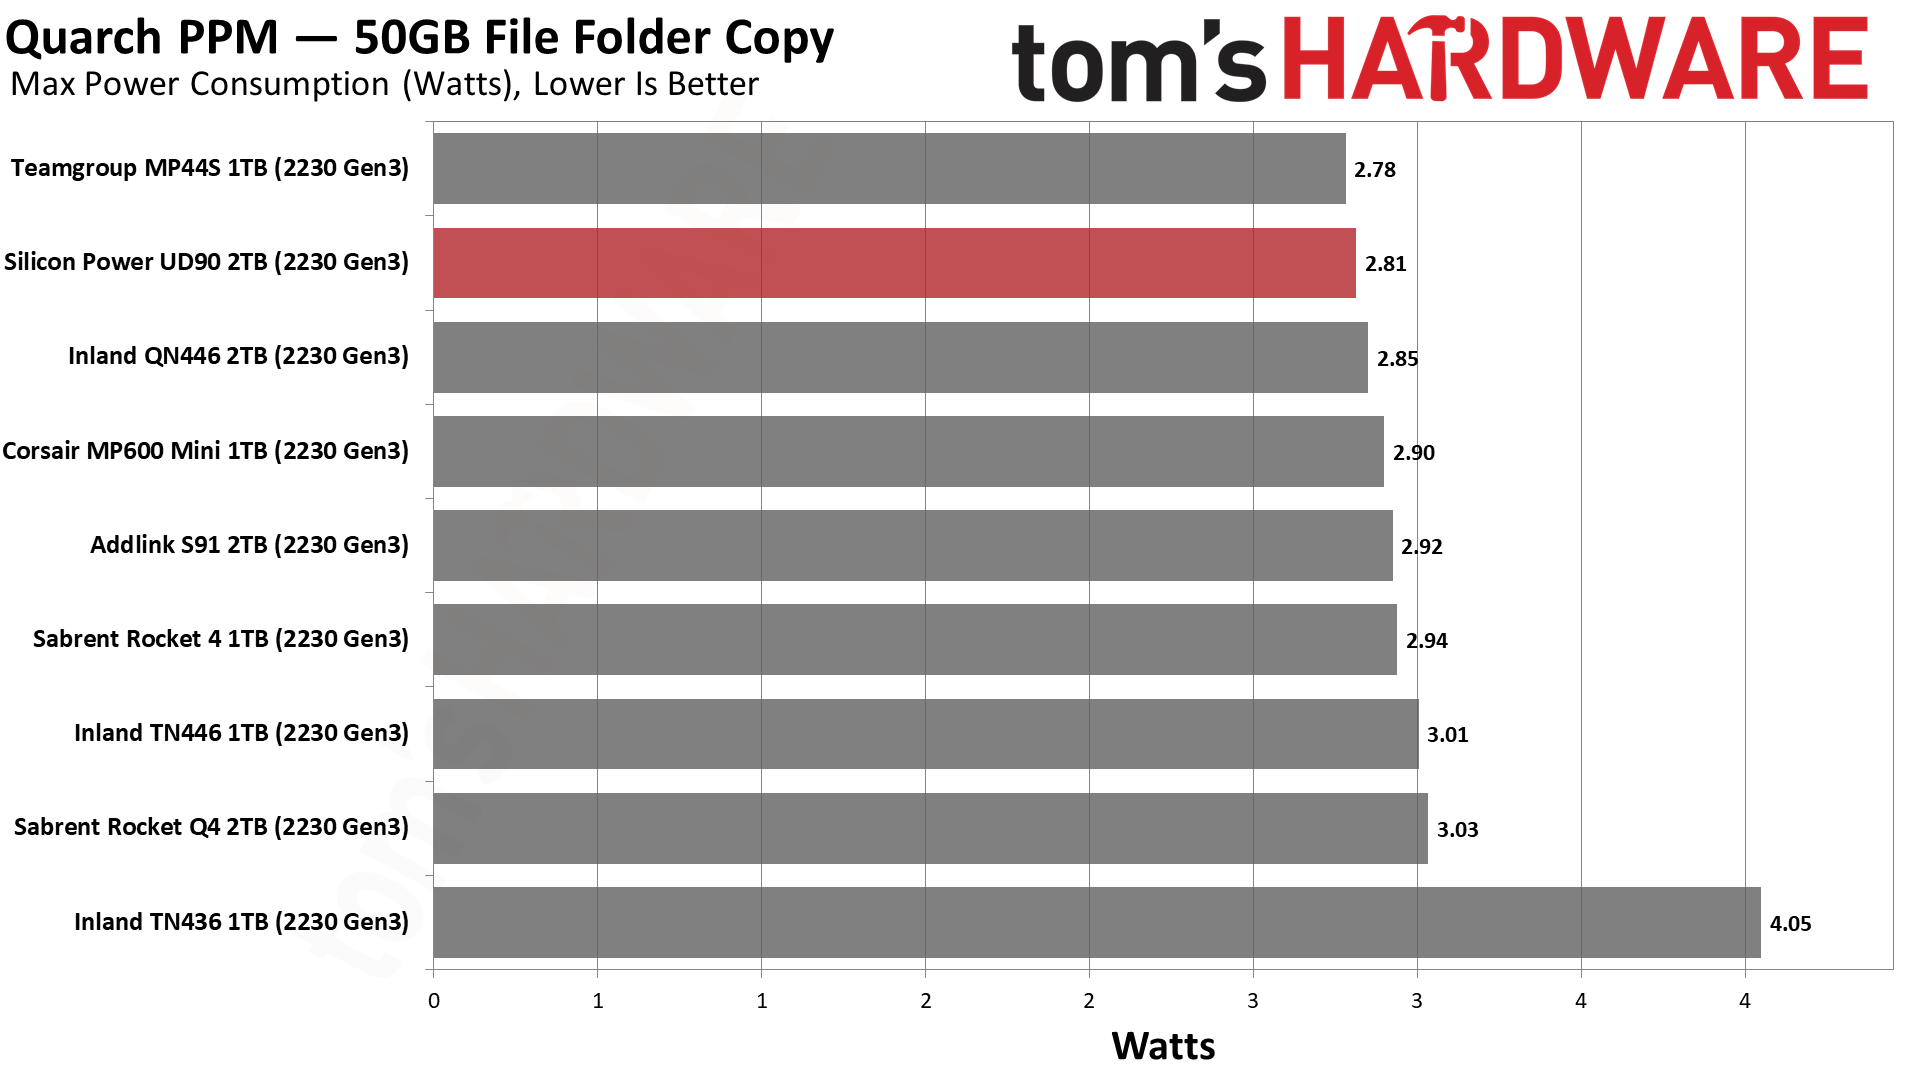
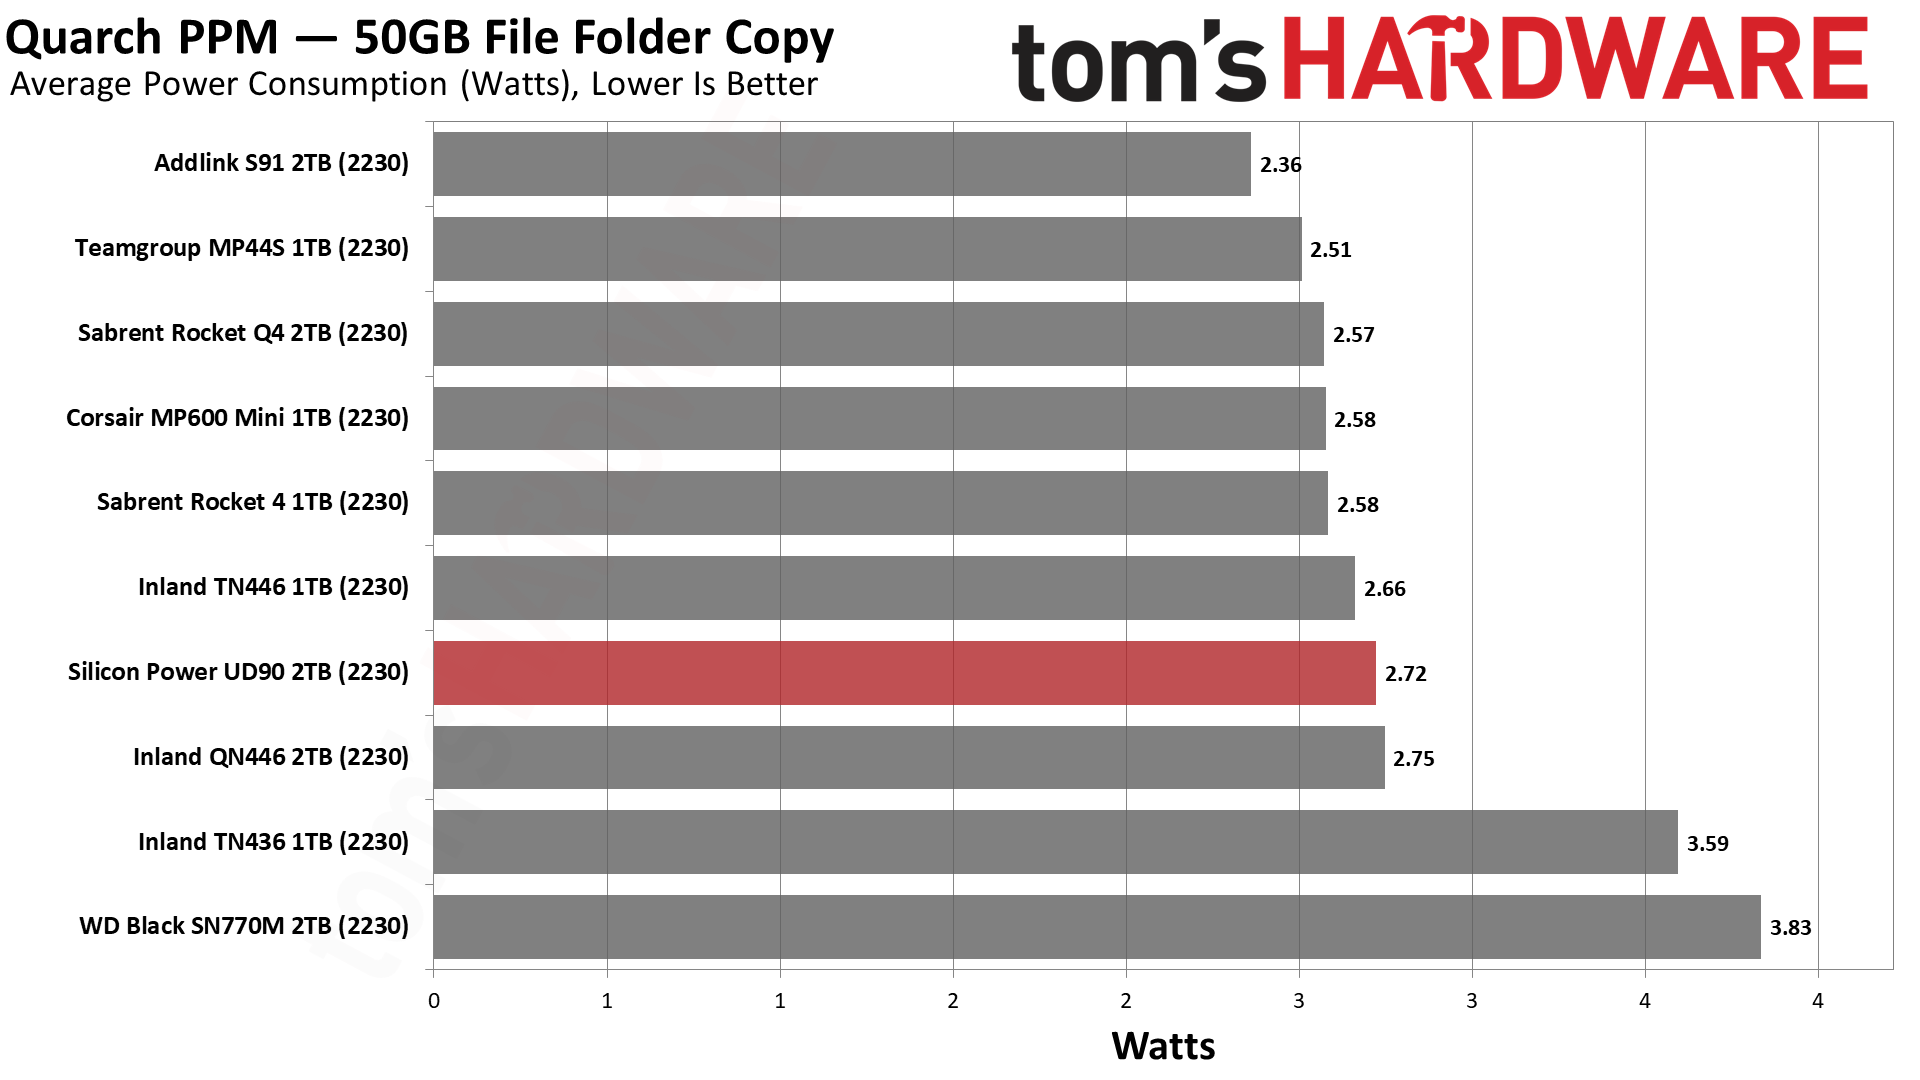
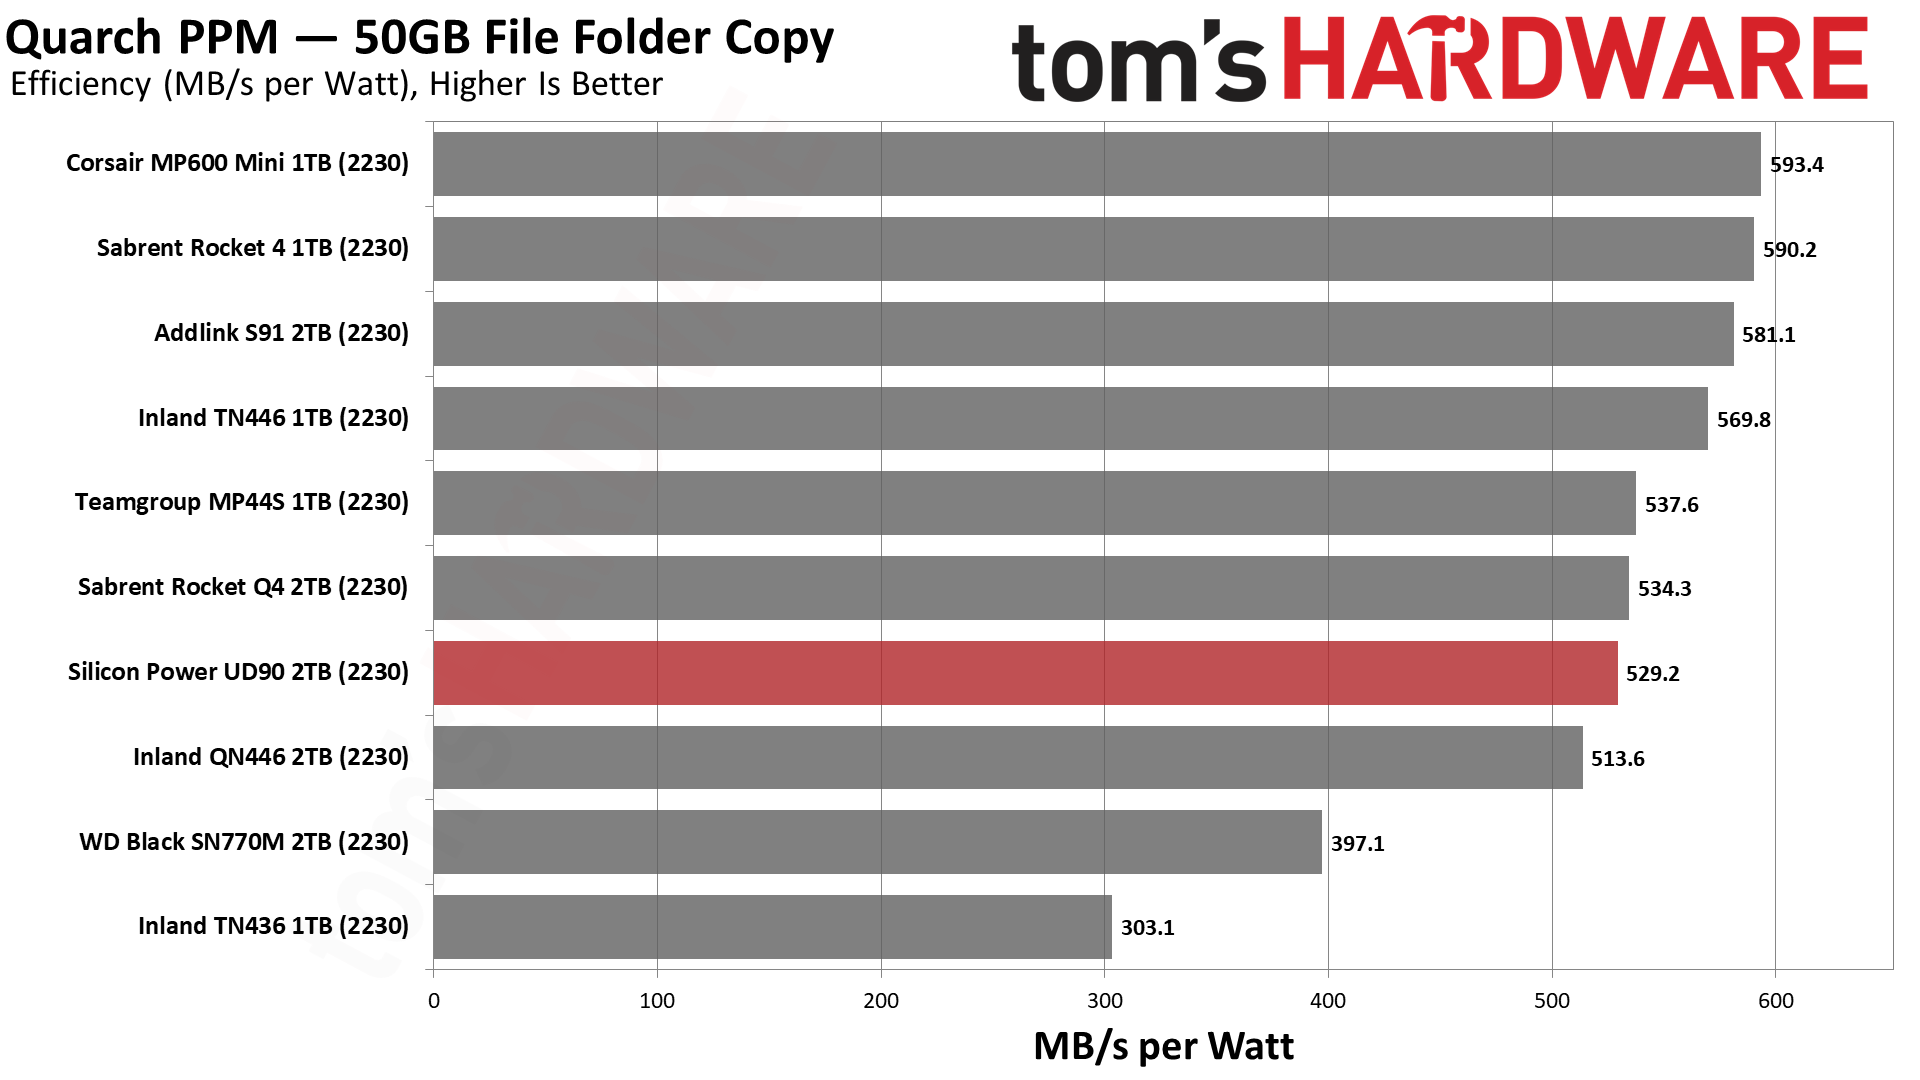
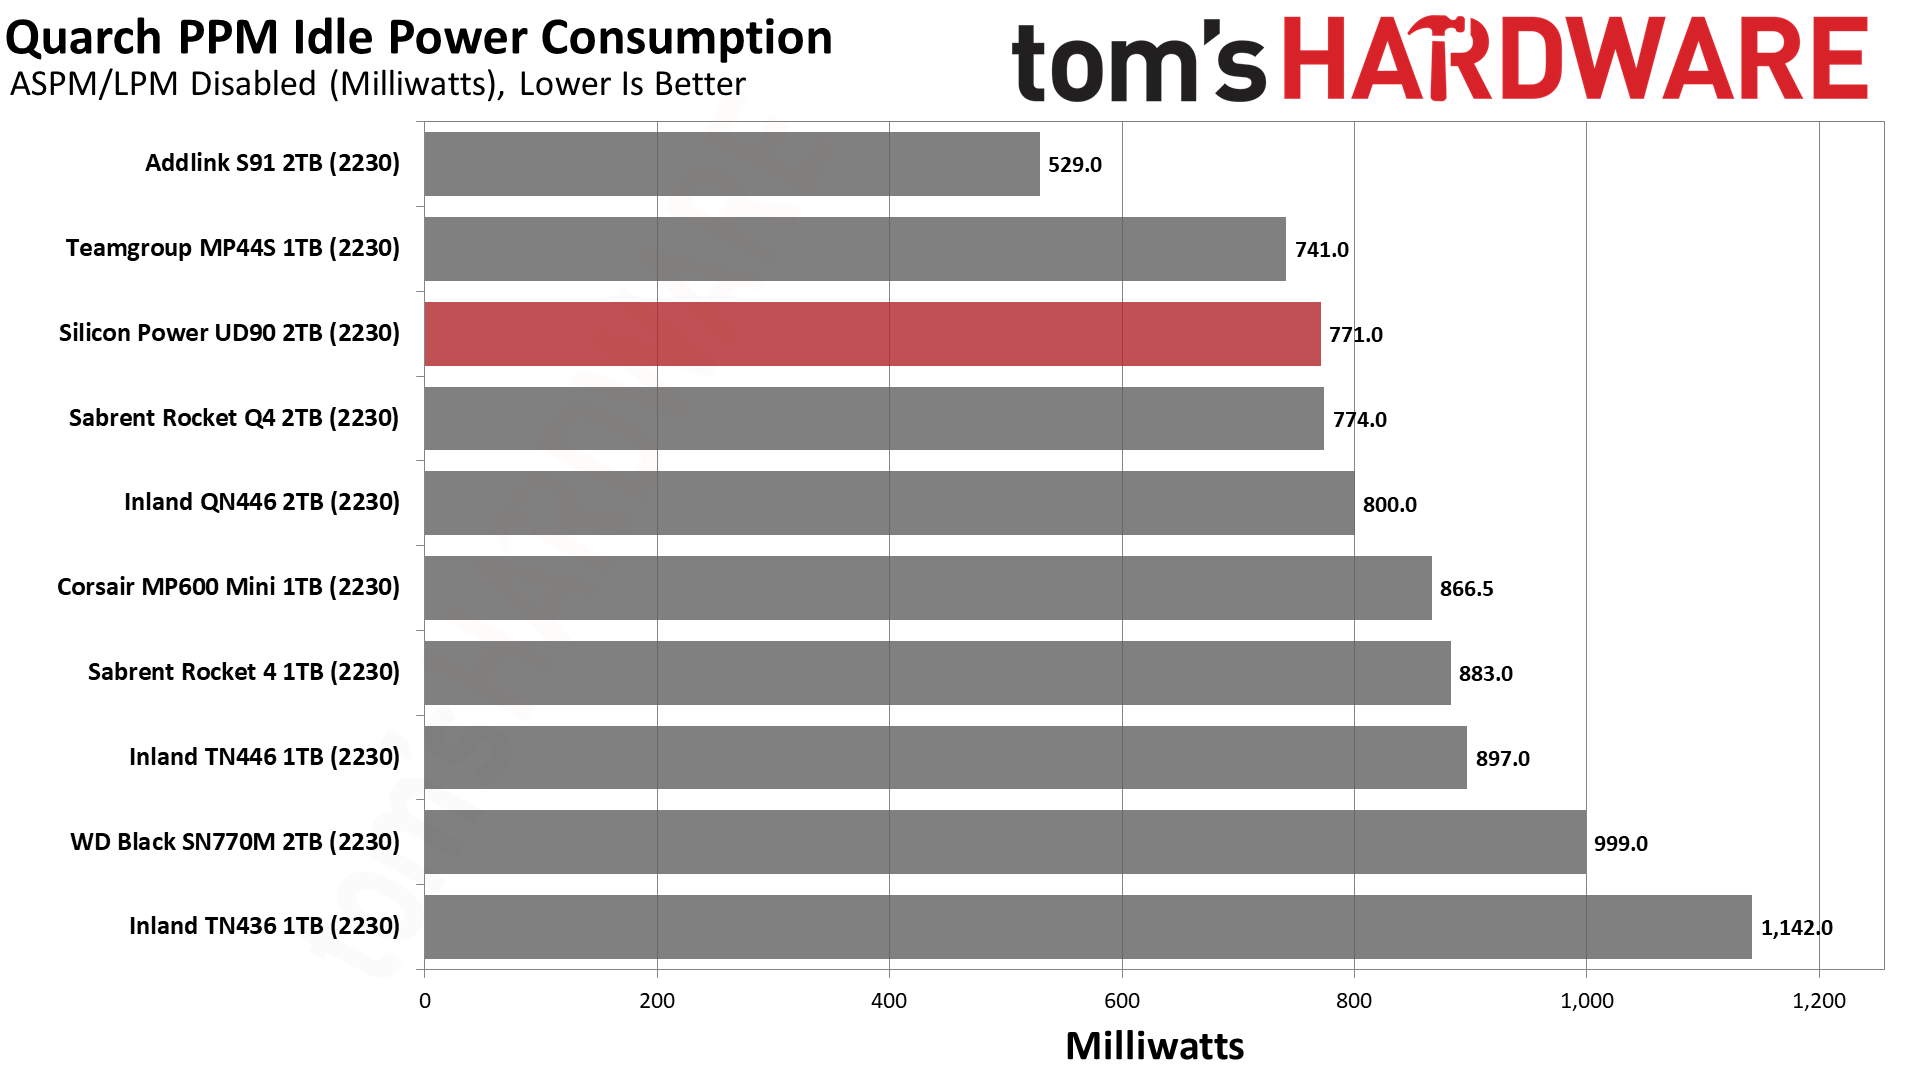
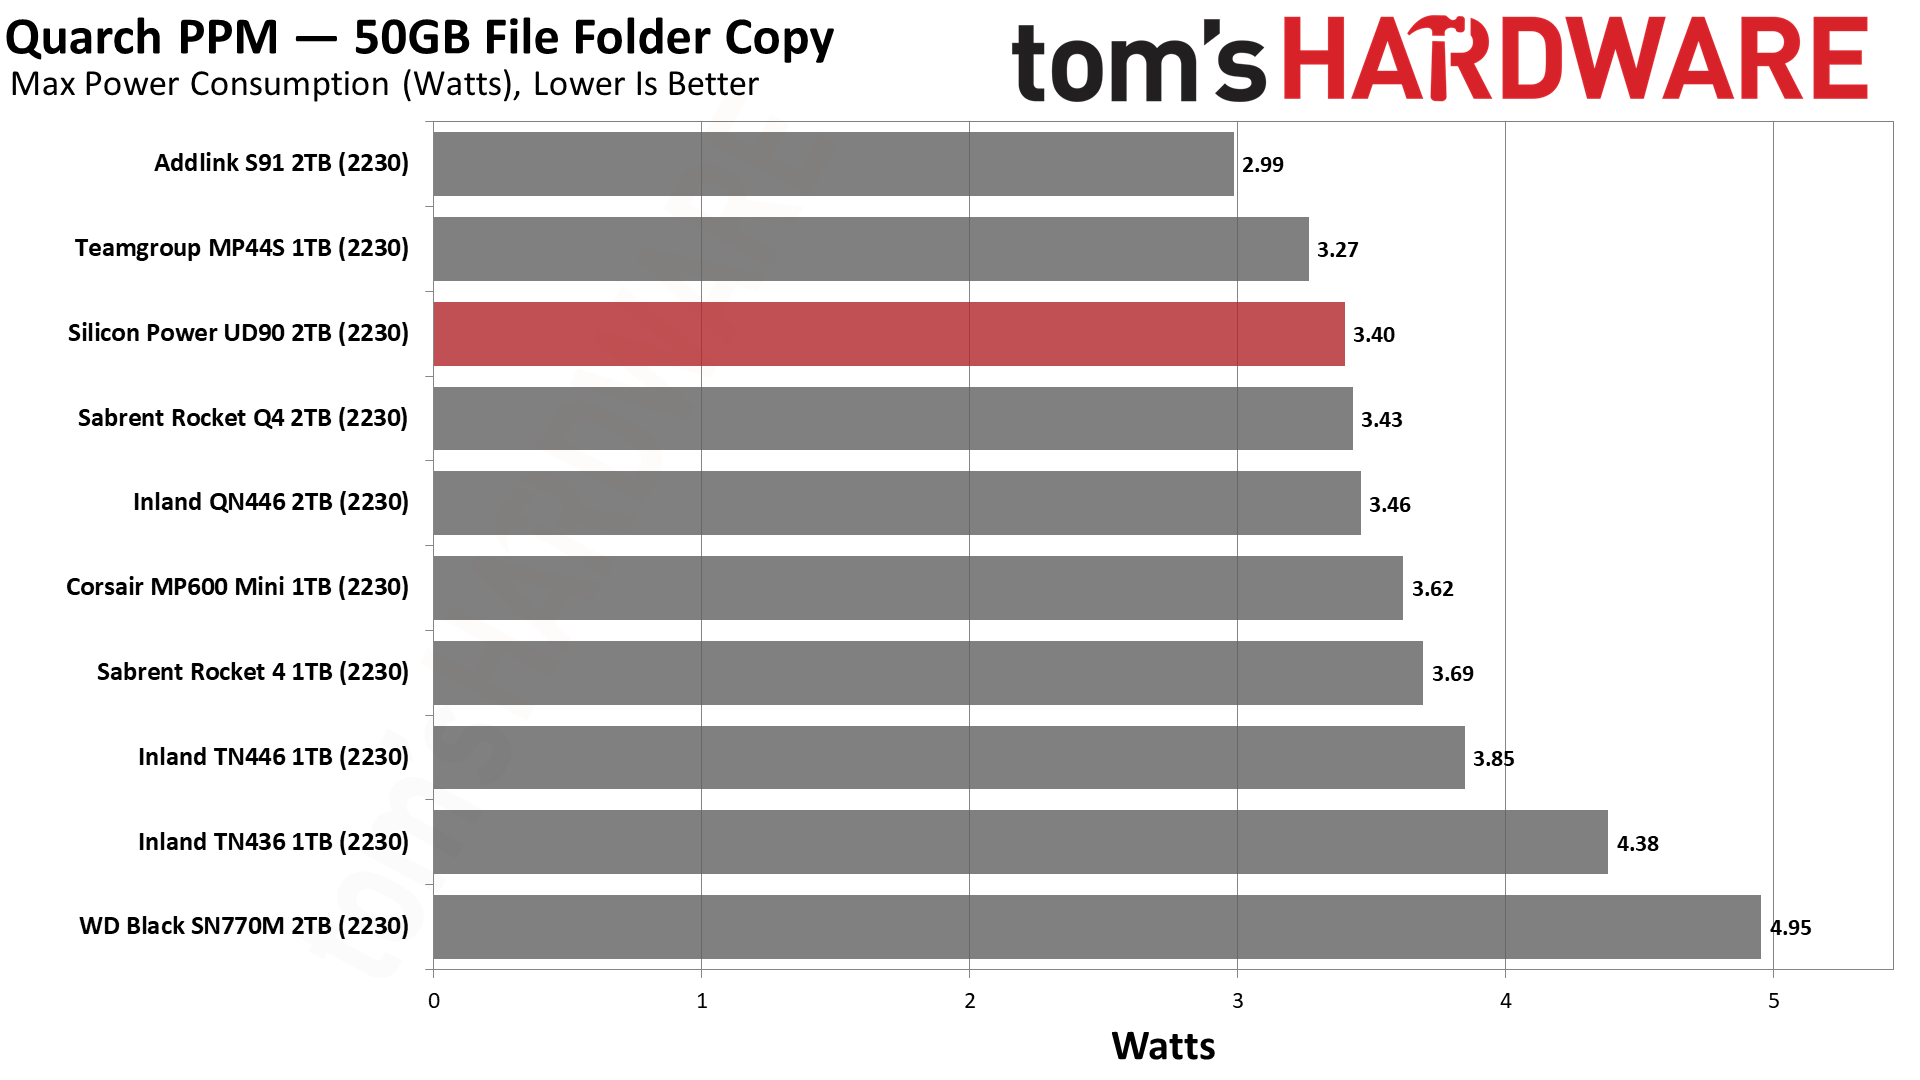
The UD90 2230 is as efficient as expected, which is to say it’s quite efficient indeed. It uses less power than the last-gen TN436 and also the TLC-based, high-performing SN770M.
The UD90 2230 hit a maximum of 67C in PCIe 4.0 mode during our testing, about 8C higher than in PCIe 3.0 mode. This is well below the first critical threshold at 83C. The drive will run hotter in an enclosed environment.
Test Bench and Testing Notes
| CPU | Intel Core i9-12900K |
| Motherboard | Asus ROG Maximus Z790 Hero |
| Memory | 2x16GB G.Skill DDR5-5600 CL28 |
| Graphics | Intel Iris Xe UHD Graphics 770 |
| CPU Cooling | Enermax Aquafusion 240 |
| Case | Cooler Master TD500 Mesh V2 |
| Power Supply | Cooler Master V850 i Gold |
| OS Storage | Sabrent Rocket 4 Plus 2TB |
| Operating System | Windows 11 Pro |
We use an Alder Lake platform with most background applications such as indexing, Windows updates, and anti-virus disabled in the OS to reduce run-to-run variability. Each SSD is prefilled to 50% capacity and tested as a secondary device. Unless noted, we use active cooling for all SSDs.
Conclusion
While the Silicon Power UD90 2230 doesn’t do anything new, you don’t exactly need it to surprise. It’s a simple SKU designed to compete in the M.2 2230 space with a range of convenient capacities. It’s QLC-based to save on cost, and that’s where Silicon Power operates best. While it does bring better results in Windows, we suspect this is an anomaly, and your actual experience will be comparable to the alternatives. You should look at all prices for similar drives when you decide to make your purchase, at least if you're looking for a 2TB SSD.
The one exception is if you have your heart set on TLC flash. Currently, the WD Black SN770M is the best TLC-based retail option for a 2TB, M.2 2230 SSD. It’s important for many devices that the drive be single-sided, which has made it more difficult for manufacturers to offer a 2TB TLC SSD in this form factor. It costs more to go with TLC, even when bringing in OEM options and rebrands. While TLC does provide the best performance, especially with a PCIe 4.0 host device, the SN770M may not be the best option if you’re concerned about heat and power draw.
The UD90 2230 is also available at 1TB and, unusually, 500GB. Our experience has been that QLC performs adequately and largely just as well at 1TB as it does at 2TB. This is especially true in PCIe 3.0 mode or on the Deck, but even with the full PCIe 4.0 link speed, you will usually not feel the difference between QLC and TLC. However, QLC has performance pitfalls in edge cases, which you can feel after long transfers and/or when the drive is fuller. If you plan to use a lot of space, going up to 2TB is probably worthwhile.
If performance is a high priority, TLC can be a better option at 1TB, but it’s definitely better than QLC at 500/512GB. The 500GB UD90 2230 will only have four dies and a smaller cache size, making it more prone to exhibiting its performance shortcomings. That said, if you’re just trying to clear the default 64GB drive on the Steam Deck, it can be a less expensive option and probably a better deal than going down to 256GB if you’re trying to match that launch 512GB. On the other hand, the 256GB Rocket 2230 is TLC-based and should perform well if you are okay with a fast, compact package.
Of course, that last bit is only a decision if you can even find the 500GB UD90 2230. At the time of the review, it was missing in action, but we would like to see it as an option to help fill out the 2230 SSD market.
MORE: Best SSDs
MORE: Best External SSDs and Hard Drives
MORE: How We Test HDDs And SSDs
MORE: All SSD Content

Shane Downing is a Freelance Reviewer for Tom’s Hardware US, covering consumer storage hardware.
