AMD Ryzen 7 2700X Review: Redefining Ryzen
Why you can trust Tom's Hardware
Cache And Memory Performance, IPC
Memory Latency
| AMD Measurements | L1 Cache Latency | L2 Cache Latency | L3 Cache Latency | Memory Latency |
| Latency Improvements | 13% | 34% | 16% | 11% |
AMD's first-gen processors demonstrated higher memory latency than we expected, affecting the performance of memory-sensitive applications. The company claims it reduced memory latency by 11% this time around, as well as cutting cache latencies by double-digit percentages. We'll start by measuring the memory and Infinity Fabric subsystems, and then move on to IPC tests.
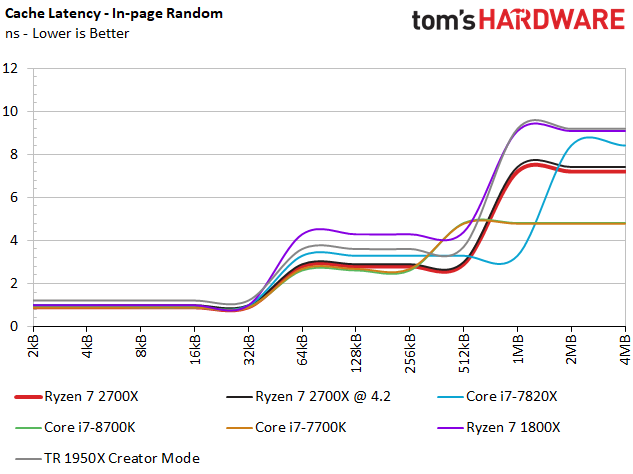
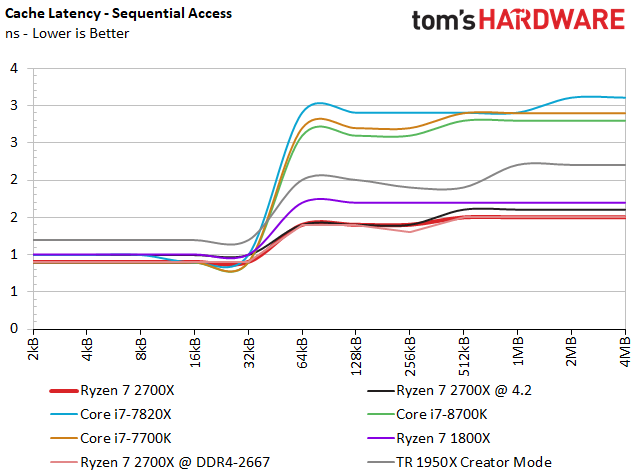
SiSoftware's Sandra is used to measure cache and memory latency with three different access patterns, giving us more granularity than a single test. Sequential access patterns are almost entirely prefetched into the TLB, so that one's a good measure of prefetcher performance. The in-page random test measures random accesses within the same memory page. It also measures TLB performance and represents best-case random performance. The full random test features a mix of TLB hits and misses, with a strong likelihood of misses, so it quantifies worst-case latency.
We tested both the Ryzen 7 1800X and Ryzen 7 2700X on the same X470 motherboard. We include results with the Ryzen 7 2700X at DDR4-2933 for the stock configuration, DDR4-3466 for the overclocked configuration, and DDR4-2666 to normalize it with AMD's Ryzen 7 1800X.
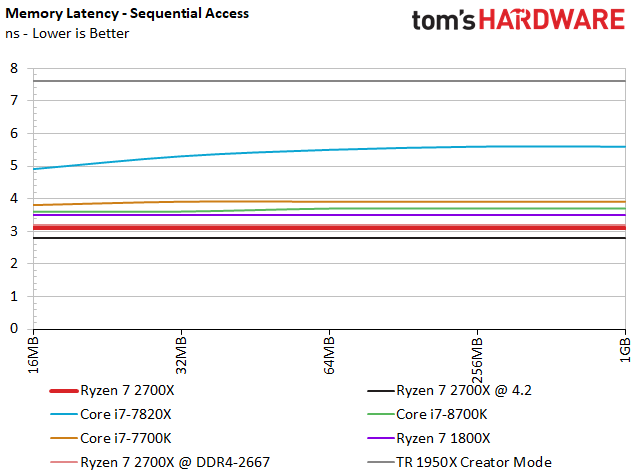
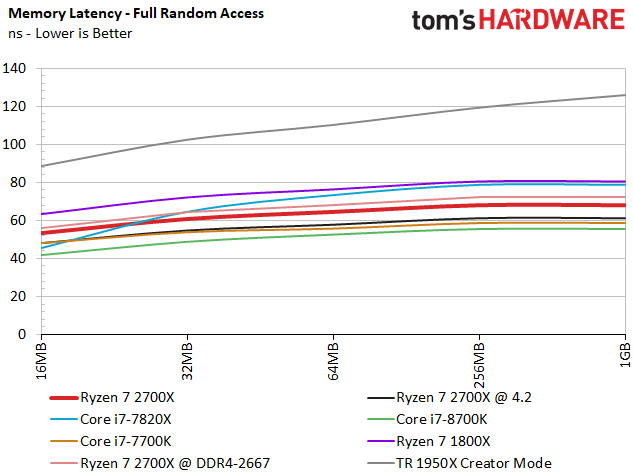
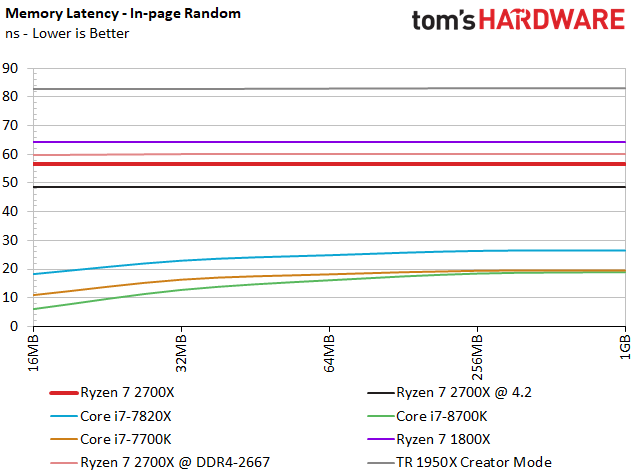
With normalized DDR4-2667 data rates and timings, the Ryzen 7 2700X posts impressive gains over Ryzen 7 1800X, regardless of the data access pattern. As percentages, the 2700X's improvements weigh in at 11.49% for full random, 6.64% for in-page, and 9.35% for the sequential access pattern.
The Infinity Fabric speeds up as we increase memory frequency to the 2700X's default DDR4-2933. This fabric ties the IMC and cores together, so we record even larger improvements of 18% in the full random test, 13.4% with a full random access pattern, and 12.9% with the sequential metric.
AMD isn't fully disclosing the steps it took to improve memory latency, but we suspect the company worked on the Infinity Fabric and integrated memory controller to realize these gains.
Cache Latency And Bandwidth
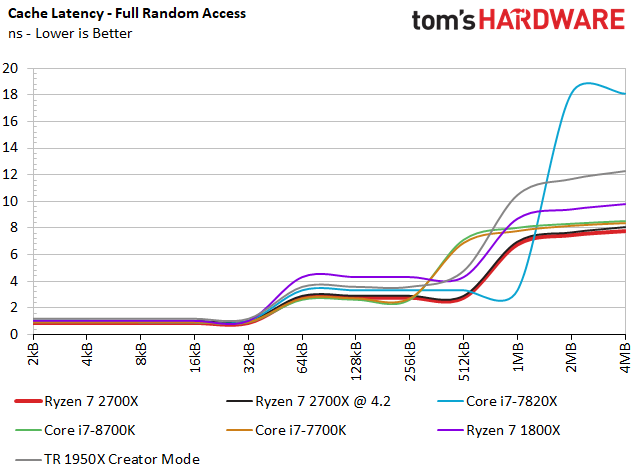
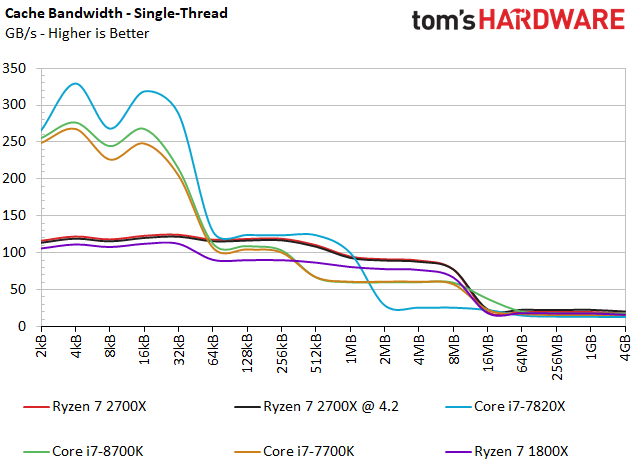
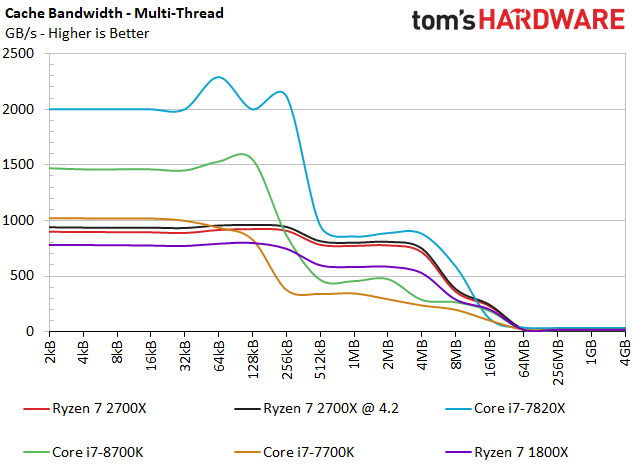
Regardless of the memory access pattern, the smallest data chunks fit into L1 cache. As the data gets larger, it populates the 2700X's higher tiers of cache, which we outlined in the following table:
Get Tom's Hardware's best news and in-depth reviews, straight to your inbox.
| Row 0 - Cell 0 | L1 | L2 | L3 | Main Memory |
| Range | 2KB - 32KB | 64KB - 512KB | 1MB - 4MB | 8MB - 1GB |
| % Improvement Over 1800X | L1 | L2 | L3 |
| In-Page | 11.11% | 51.72% | 26.38% |
| Full-Random | 11.11% | 53.5% | 25.64% |
| Sequential | 11.11% | 13.3% | 13.3% |
The cache latency reductions that we measured are even better than what AMD suggested we'd see, though its lab might be using different access patterns. Regardless, the apples-to-apples results in our table are downright impressive.
We also see a notable increase in cache bandwidth. Feeding the cores with lower latency and higher throughput is a win-win on the performance front. Intel's S-series processors still have a big single-core L1 bandwidth advantage, but AMD's updated L2 cache is measurably faster than the 1800X in both single- and multi-threaded tests. AMD even enjoys better L2 cache latency than Intel in the sequential test and better L3 cache latency with several data patterns.
To Infinity, And Beyond
The updated Zen+ design fuses two four-core CCXs together with the Infinity Fabric, which is a crossbar that also handles IMC, northbridge, and PCIe traffic. As such, fabric latency is a critical variable that ensures the memory latency gains we observe can actually be delivered to the cores.
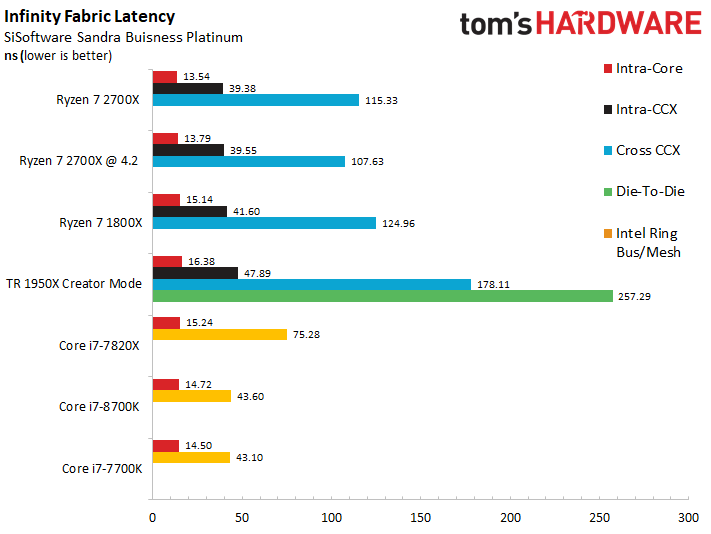
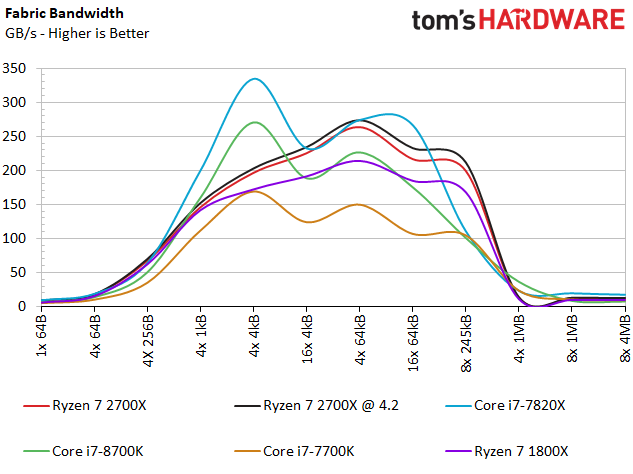
SiSoftware Sandra's Processor Multi-Core Efficiency metric helps illustrate the Infinity Fabric's performance. We use the Multi-Threaded test with the "best pair match" setting (lowest latency). The utility measures ping times between threads to quantify fabric latency in every possible configuration. We boil those benchmarks down to latency averages for the different pathways, but head here for a more detailed explanation of the various components.
AMD reduced Ryzen 7 2700X's intra-core latency by 11.8% and the critical cross-CCX latency by 8.3%. We also notice that Ryzen 7 2700X offers significantly improved fabric bandwidth.
Instructions Per Clock
It's important to remember that IPC can vary by workload, so dissimilar tasks may yield different outcomes. We set a static 3 GHz clock rate for the following tests:
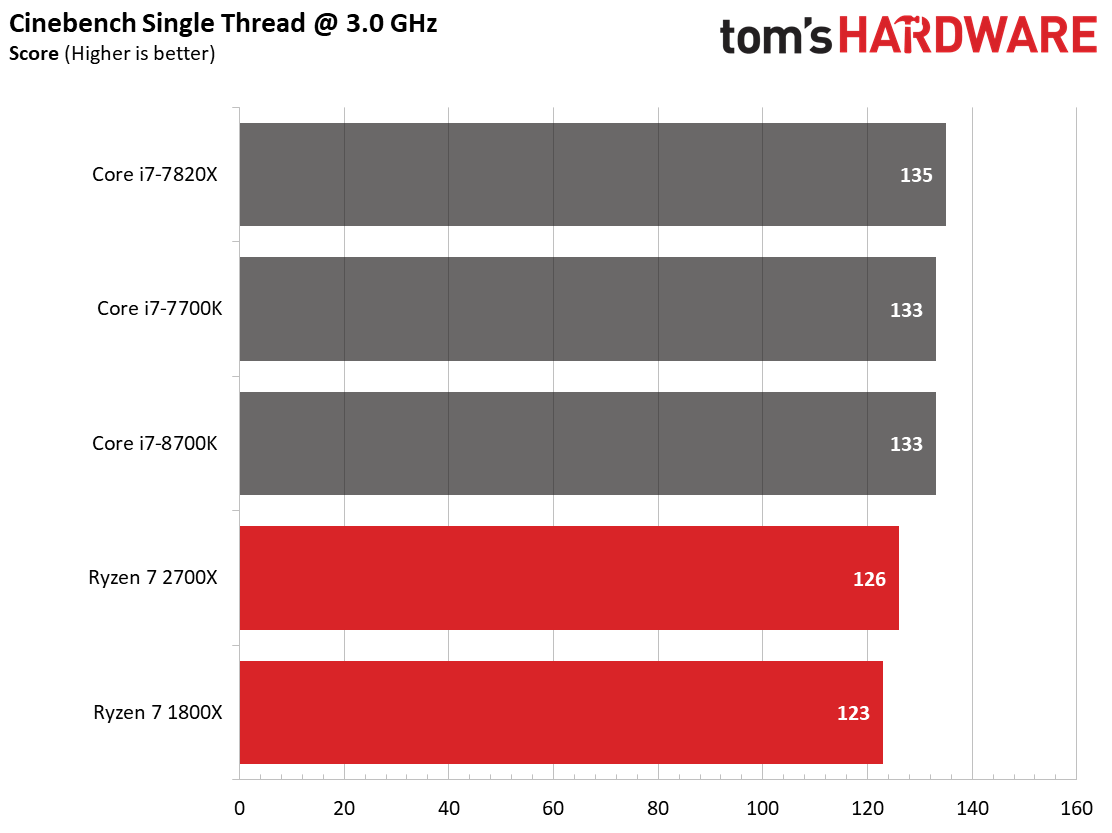
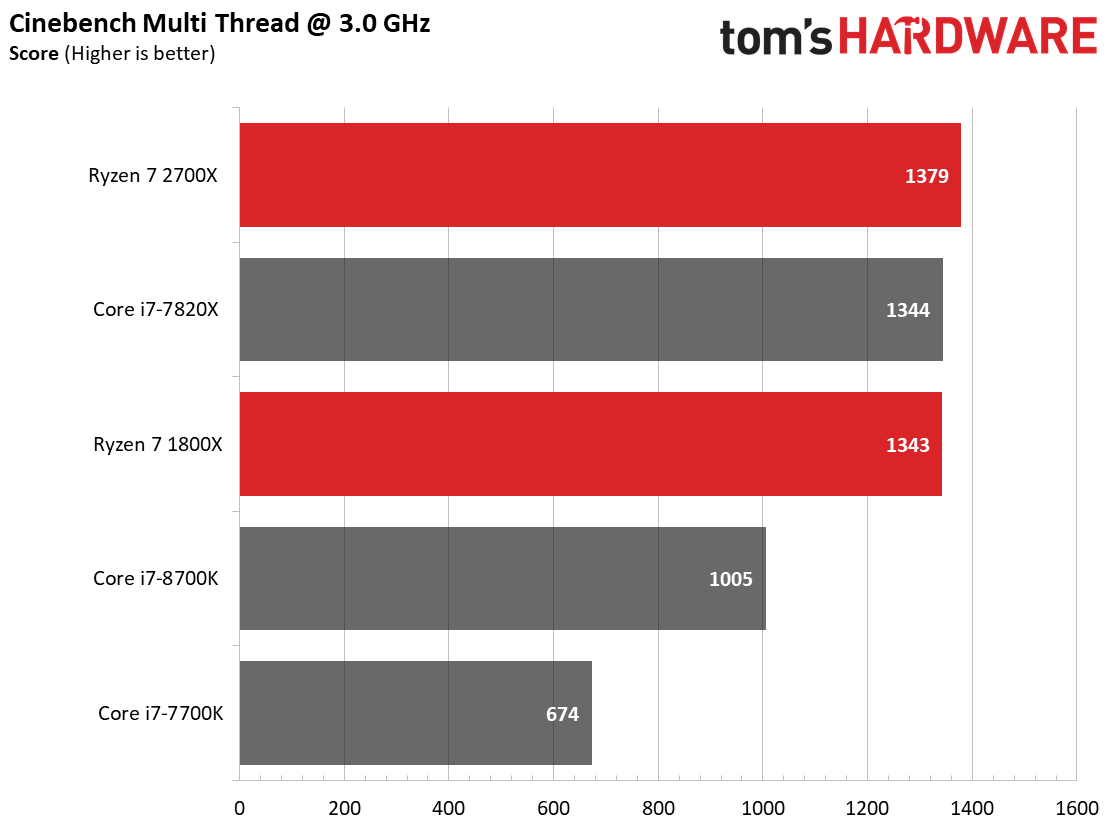
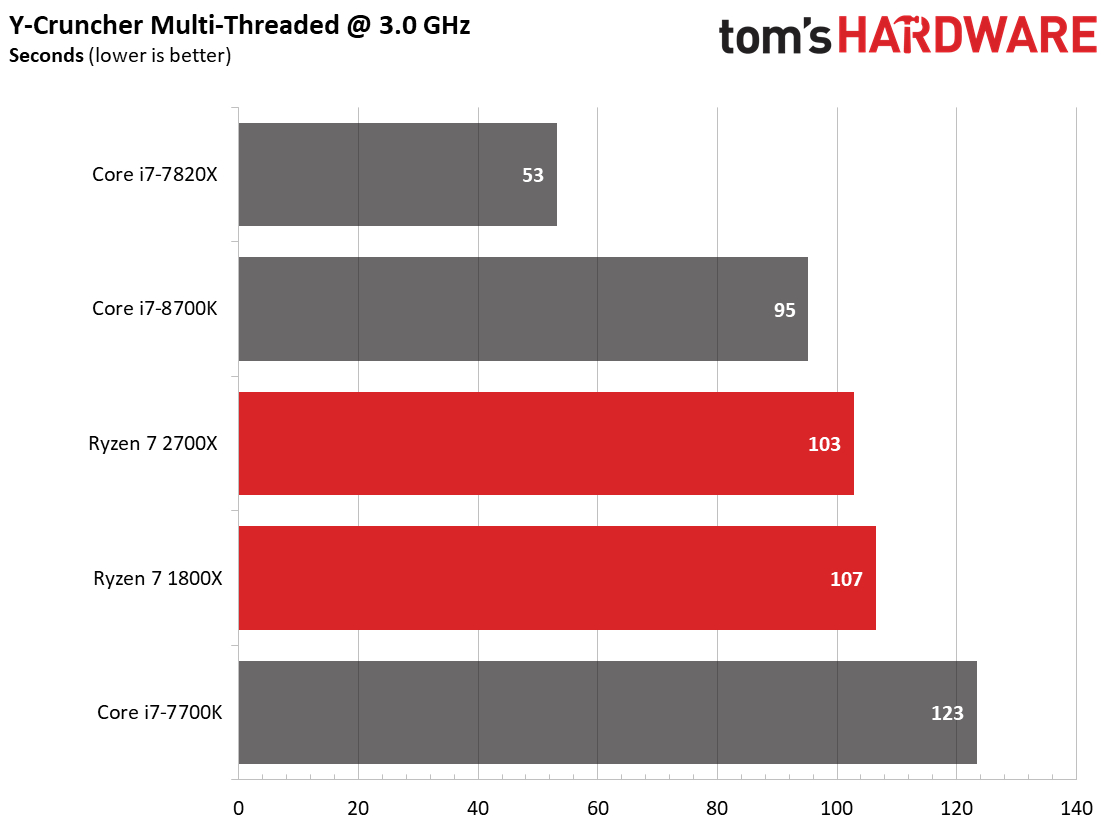
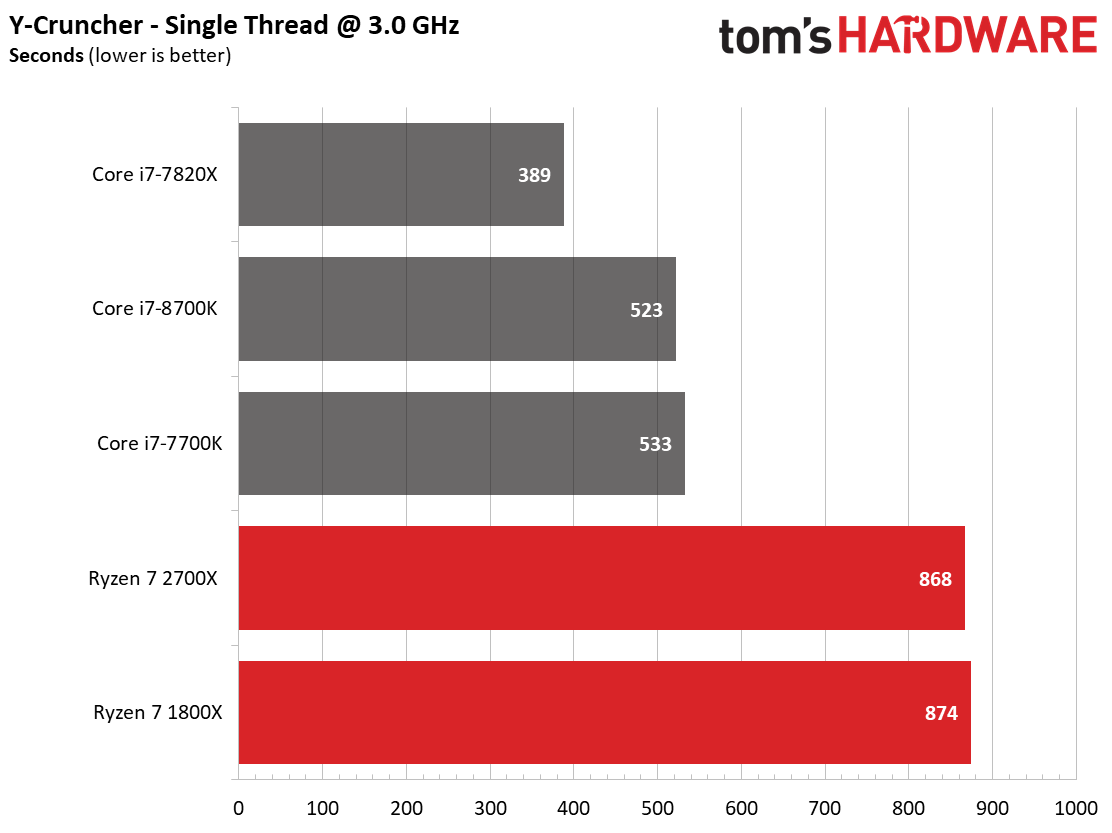
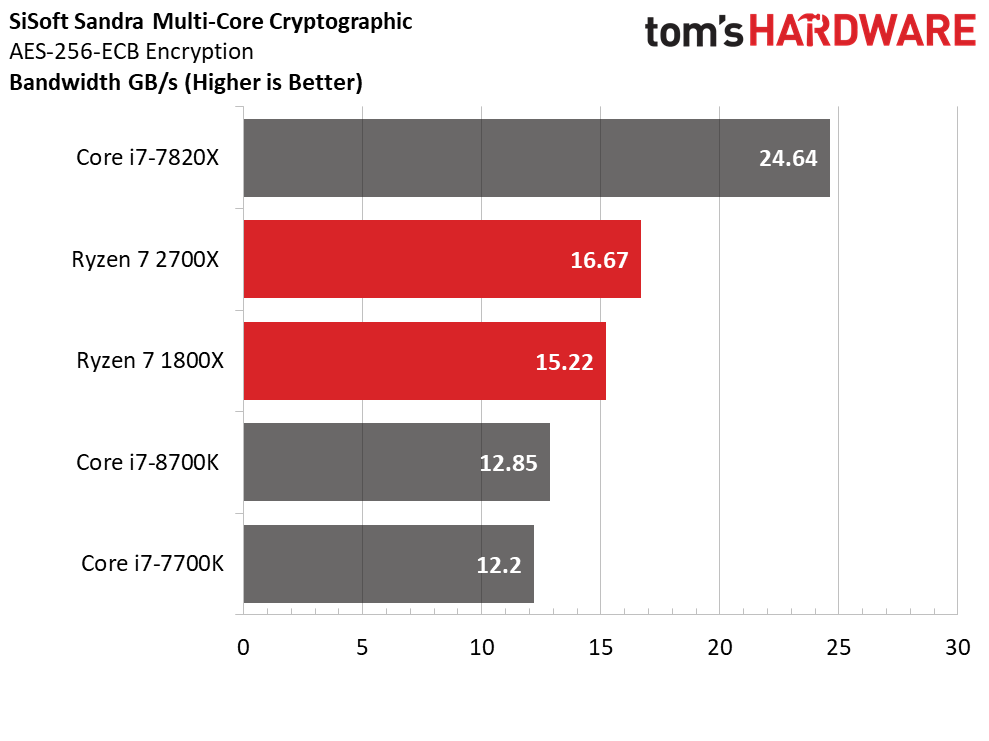
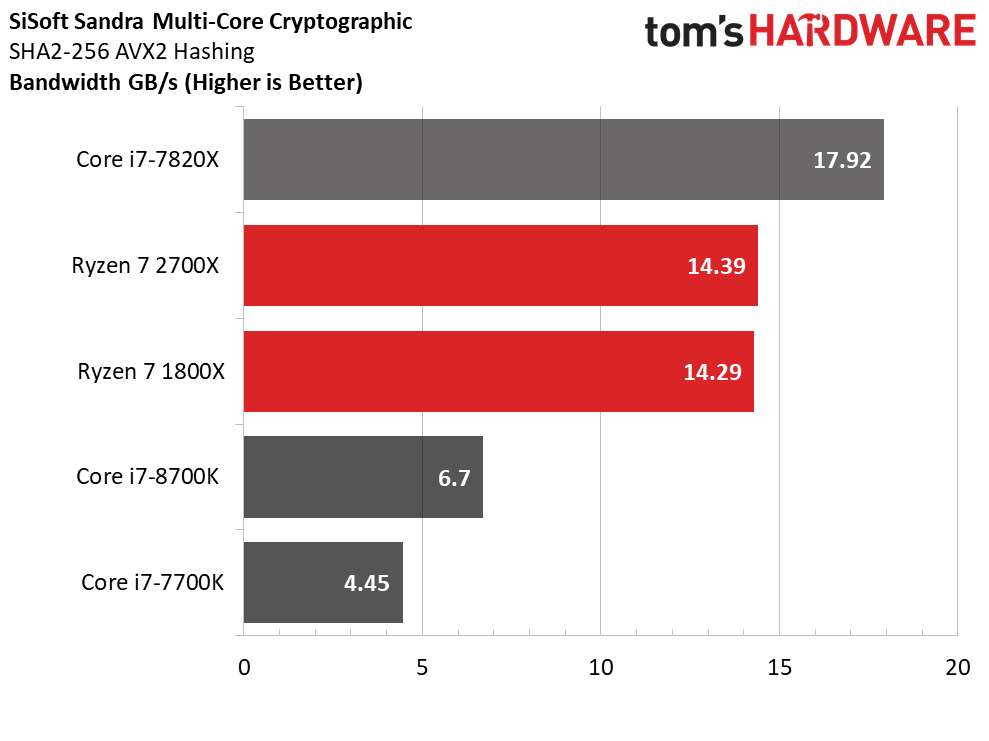
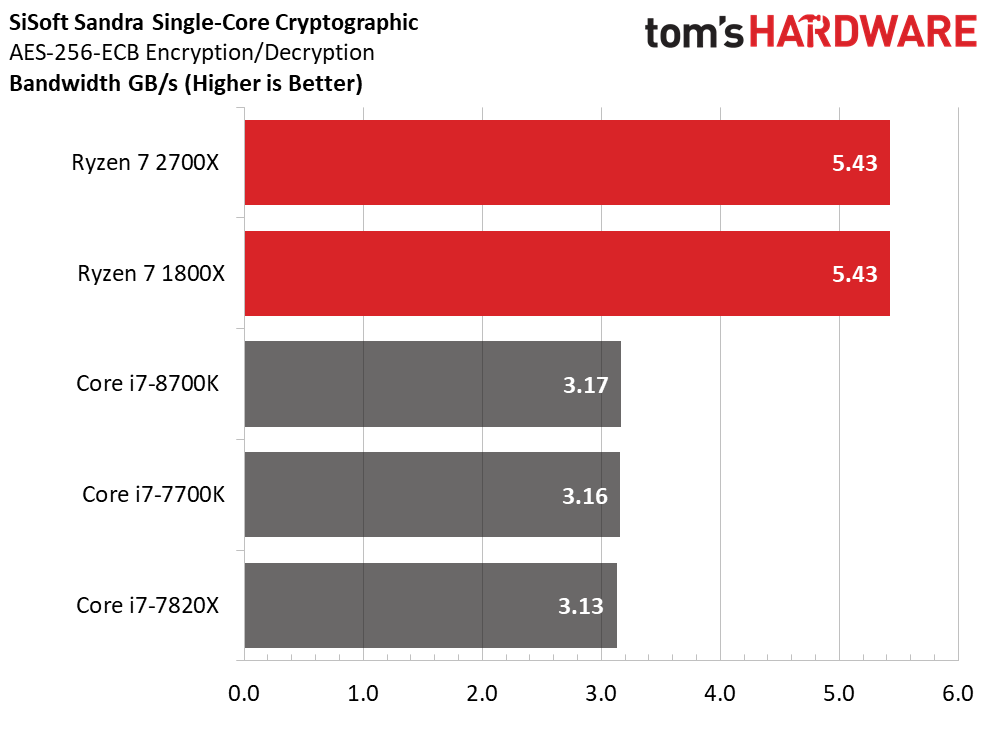
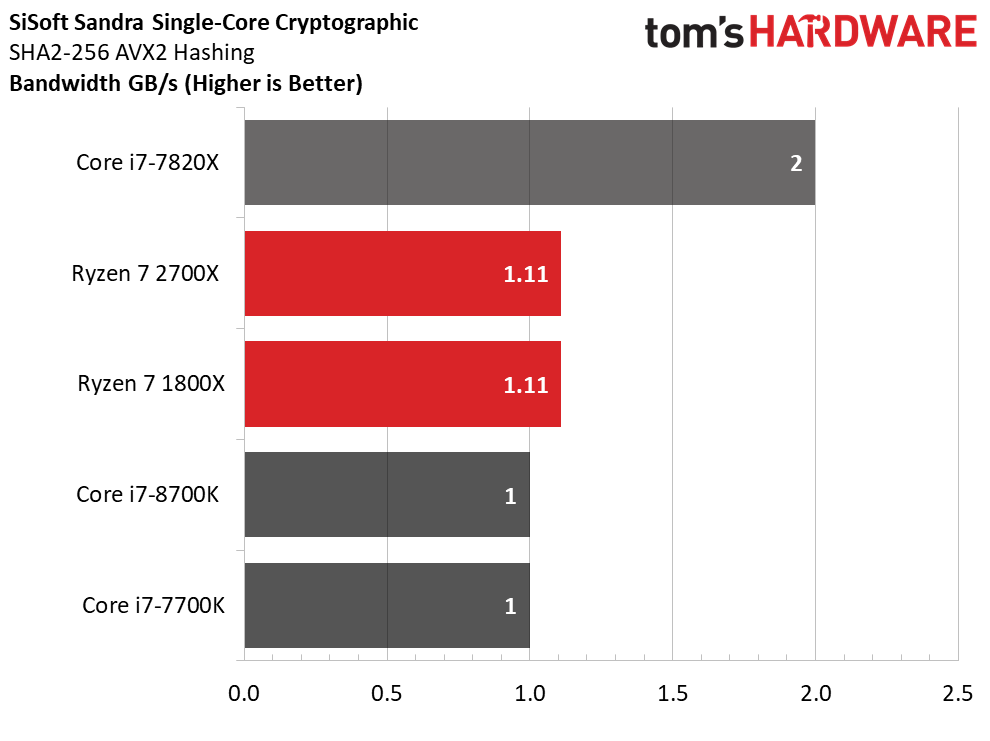
Our single-core Cinebench benchmark suggests a 1.6% IPC improvement favoring Ryzen 7 2700X. But while AMD does improve, Intel still holds onto a distinct IPC throughput advantage. Switching to the Multi-Threaded Cinbench test gives Ryzen 7 2700X a 2.7% improvement over its predecessor.
Core i9-7820X employs two 256-bit AVX FMA units per core that operate in parallel, whereas Ryzen's Zen architecture divides 256-bit AVX operations across two FMA units per core. That difference hands the Skylake-X processor a commanding lead in y-cruncher. We do see a 3.9% increase in the 2700X's Multi-Threaded y-cruncher result compared to Ryzen 7 1800X. But the gains in single-threaded AVX performance are marginal.
We see similar results in our single-core cryptographic tests, though Ryzen 7 2700X takes an 8.7% lead over the 1800X in the Multi-Threaded AES-256-ECB encryption workload. AMD's Zen architecture includes two AES cryptographic accelerators for each core, so it isn't surprising to see Ryzen dominate over Intel's S-series CPUs in the AES-256-ECB tests.
MORE: Best CPUs
MORE: Intel & AMD Processor Hierarchy
MORE: All CPUs Content
Current page: Cache And Memory Performance, IPC
Prev Page X470 And Ryzen Master 1.3 Next Page Overclocking, Spectre, And Test Setup
Paul Alcorn is the Editor-in-Chief for Tom's Hardware US. He also writes news and reviews on CPUs, storage, and enterprise hardware.
-
Ninjawithagun Once again, Tom's provides an incorrect comparison in this review. Intel's 8700K is comparable to the 2600 or 2600X and NOT the 2700 or 2700X. Just count the number of cores and threads and one should be able to figure that out O.oReply
Whine all you want. Just because you down vote me only means you don't know how to read or count :P -
Sakkura Reply20899022 said:Once again, Tom's provides an incorrect comparison in this review. Intel's 8700K is comparable to the 2600 or 2600X and NOT the 2700 or 2700X. Just count the number of cores and threads and one should be able to figure that out O.o
The 2700X costs $329, the 8700K costs $359. It is a very reasonable comparison to make. -
justin.m.beauvais It sure is nice to see an AMD chip up there in the thick of it with Intel's best offerings. Competition has finally officially returned. I'm impressed that AMD gained so much ground and managed to make the price more competitive than the 1800x was. It is slightly disappointing that overclocking remains less impressive than the Intel offerings, but everything else sort of makes up for that.Reply
I didn't feel like AMD was quite "there" yet with the 1000 Ryzens, but with the 2000 series I feel like we can finally say that they have arrived. -
Ninjawithagun Reply20899035 said:20899022 said:Once again, Tom's provides an incorrect comparison in this review. Intel's 8700K is comparable to the 2600 or 2600X and NOT the 2700 or 2700X. Just count the number of cores and threads and one should be able to figure that out O.o
The 2700X costs $329, the 8700K costs $359. It is a very reasonable comparison to make.
Incorrect. It has nothing to do with price. Comparing like CPU architectures is the only logical course of action. 6 core/12 thread vs 8 core/16 thread makes no sense. Comparing the Intel 8700K 6 core/12 thread @ $347 to the AMD 2600X 6 core/12 thread @ $229.99 makes the most sense here. Once the proper math is done, AMD destroys Intel in performance vs. cost, especially when you game at any resolution higher than 1080P. The GPU becomes the bottleneck at that point, negating any IPC benefits of the Intel CPUs. I know this how? Simple. I also own a 8700K gaming PC ;-)
Once again, whine all you want. Just because you down vote me only means you don't know how to read or count :P -
bfwhsm Now, do the tests again with meltdown/spectre applied on intel cpus, as you should.Reply
And you will see a VERY different story, with 2700k destroying 8700k in almost every measure).
(check out anandtech's review to get an idea) -
Ninjawithagun Reply20899131 said:Now, do the tests again with meltdown/spectre applied on intel cpus, as you should.
And you will see a VERY different story, with 2700k destroying 8700k in almost every measure).
(check out anandtech's review to get an idea)
I will definitely check out that review as well. Thanks bfwhsm! -
tripleX Reply20899131 said:Now, do the tests again with meltdown/spectre applied on intel cpus, as you should.
And you will see a VERY different story, with 2700k destroying 8700k in almost every measure).
(check out anandtech's review to get an idea)
Maybe you should read the comments on the AnandTech article. They all point out that the test results don't match any other site's results. -
Sakkura Reply20899157 said:20899131 said:Now, do the tests again with meltdown/spectre applied on intel cpus, as you should.
And you will see a VERY different story, with 2700k destroying 8700k in almost every measure).
(check out anandtech's review to get an idea)
Maybe you should read the comments on the AnandTech article. They all point out that the test results don't match any other site's results.
... because of the different testing procedure that he just referred to.