AMD Ryzen 7 3800X Review: Core i7 Has a New Challenger
Why you can trust Tom's Hardware
Power Consumption
Our power measurements, which we recently migrated towards a more efficiency-focused approach, revealed some interesting tidbits. Particularly in regards to both Precision Boost Overdrive and manual overclocking.
Power consumption measurements are always a bit tricky. But as long as your 12V supply (EPS) readings, motherboard power supply sensor values, and voltage transformer losses plausibly coincide, everything is fine. Therefore, we're using pure package power to avoid possible influences from our motherboard. Results from the PWM controller are very reliable if you take them as averages over a few minutes.
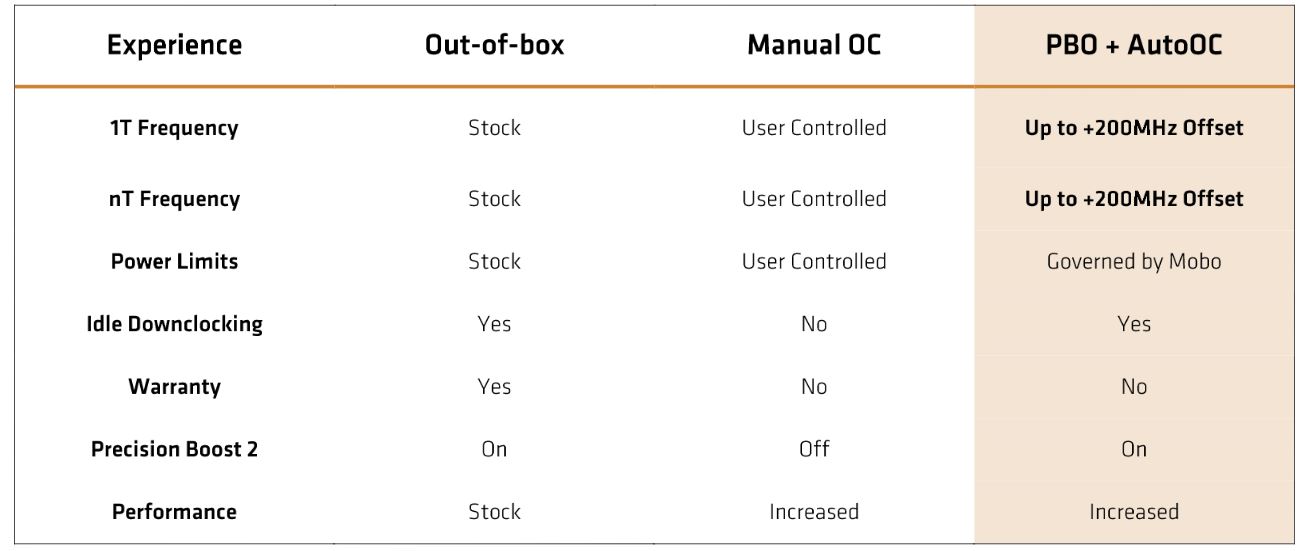
AMD's Precision Boost Overdrive (PBO) is an adaptive overclocking approach that allows the processor to communicate with the platform to modulate performance based on the motherboard's power delivery subsystem and thermal dissipation capabilities. The processor monitors Package Power Tracking (PPT), which is total socket power, and the Thermal Design Current (TDC) variable, which is the motherboard's maximum available sustained current. Electrical Design Current (EDC) also indicates the maximum current possible from the VRMs during peak/transient conditions.
| 105W CPU Limits | PPT | Row 0 - Cell 2 | Row 0 - Cell 3 |
| AMD IPM | 142W | 95A | 140A |
| MSI X570 Godlike | 1000W | 490A | 630A |
AMD enables two options for PBO: IPM is AMD's default PBO setting, which is activated if you leave the PBO setting to 'Auto' in the Godlike's UEFI. But you can select 'Enabled' to activate a profile that's dictated by the maximum limits of the motherboard's power delivery subsystem. These limits vary by motherboard and are defined by the vendor. We chose the latter to unlock the full potential of PBO. As you can see in the table, this enables the most robust power delivery options available, kicking the socket's maximum power delivery up to 1000W, and is designed to offer the best of increased multi-core boost clocks while retaining the high single-core boost clocks.
You can also further tune the power delivery options with an Auto OC (AOC) feature. This new feature grants you some control over the maximum attainable boost clocks by allowing you to add up to an extra 200MHz to the maximum boost clock, but it isn't guaranteed that the processor will reach those speeds at all times, or under all conditions. Instead, the processor will still respect the limits imposed by the motherboard maker.
Unfortunately, we've found that the PBO+AOC feature often comes at the expense of performance in single-threaded workloads even though it is billed as retaining, and even heightening, single-core boost clocks. From a performance and power consumption standpoint, it is more comparable to our all-core 4.3 GHz overclock. This might be an issue with early AGESA versions, but for now, the feature actually results in less performance in single-threaded workloads with MSI's X570 Godlike motherboard.
We chose to go with the limits of the motherboard, noted on the charts below as PBO, and the all-core 4.3 GHz overclock we outlined on the prior page. It's noteworthy that our all-core overclock comes at the expense of the single-core 4.5 GHz boost, which was a relatively rare occurrence during our testing in both stock and PBO trim.
Get Tom's Hardware's best news and in-depth reviews, straight to your inbox.
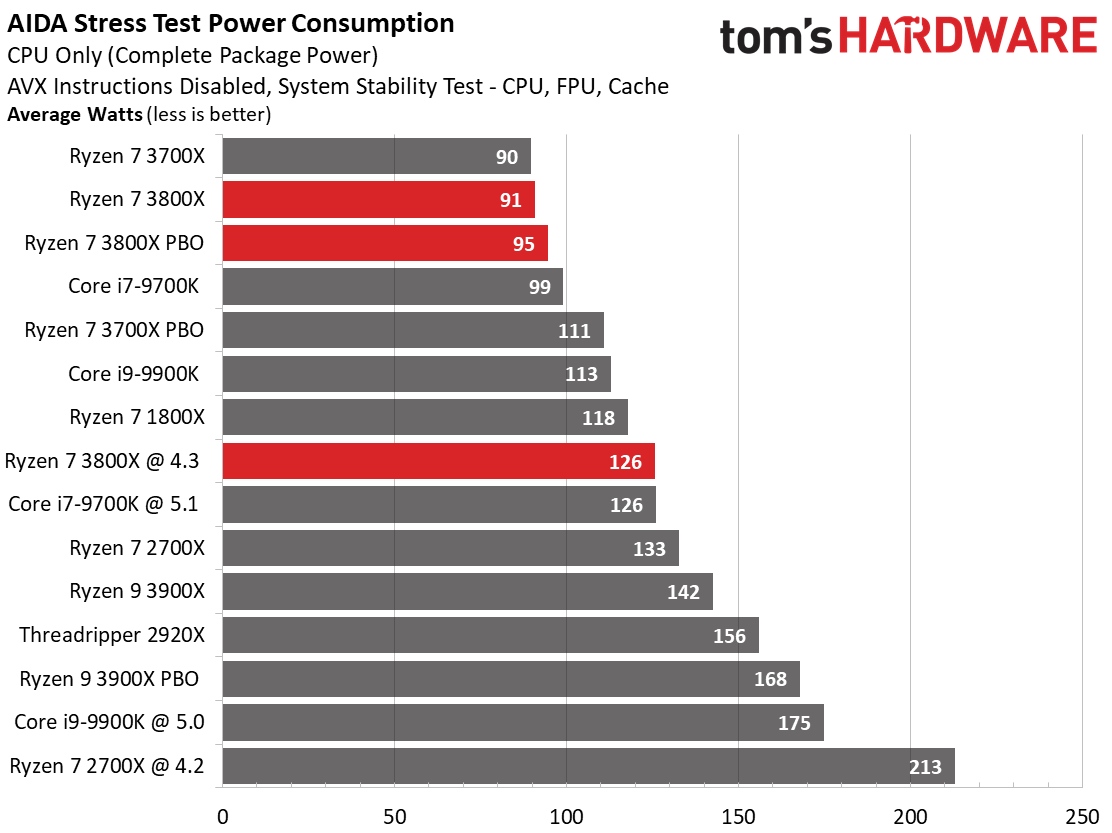
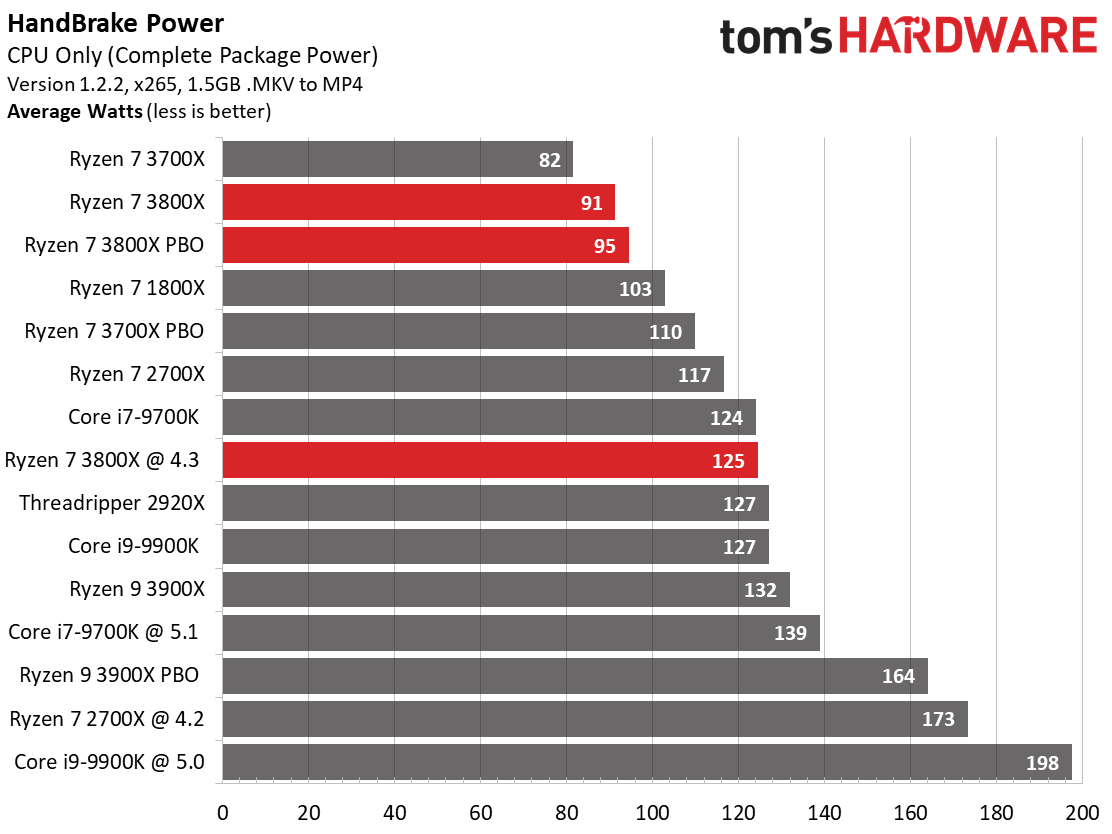
We began with the non-AVX stress test in AIDA64 and found that the Ryzen 7 3800X draws very little power at stock settings, nearly matching the stock Ryzen 7 3700X's power draw. We activated Precision Boost Overdrive, and the processor's power draw only increased marginally to 95W. Our all-core overclock, however, sucked down 126W on average, but hit 163W peaks during the test.
You'll notice the Ryzen 7 3700X draws more power with PBO+AOC active than the 3800X's PBO configuration, but that's due to its all-core overclock-like nature. As such, our PBO+AOC results for the Ryzen 9 3900X and Ryzen 7 3700X are more comparable to the 3800X's all-core overclock.
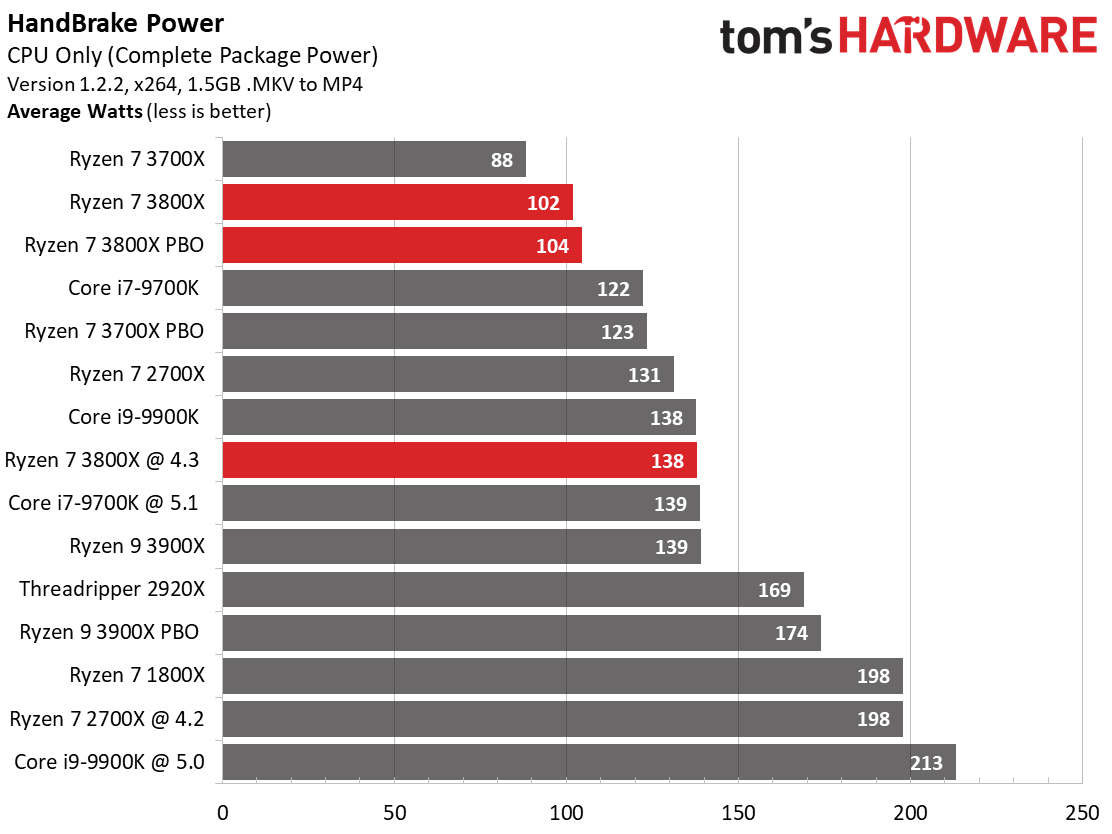
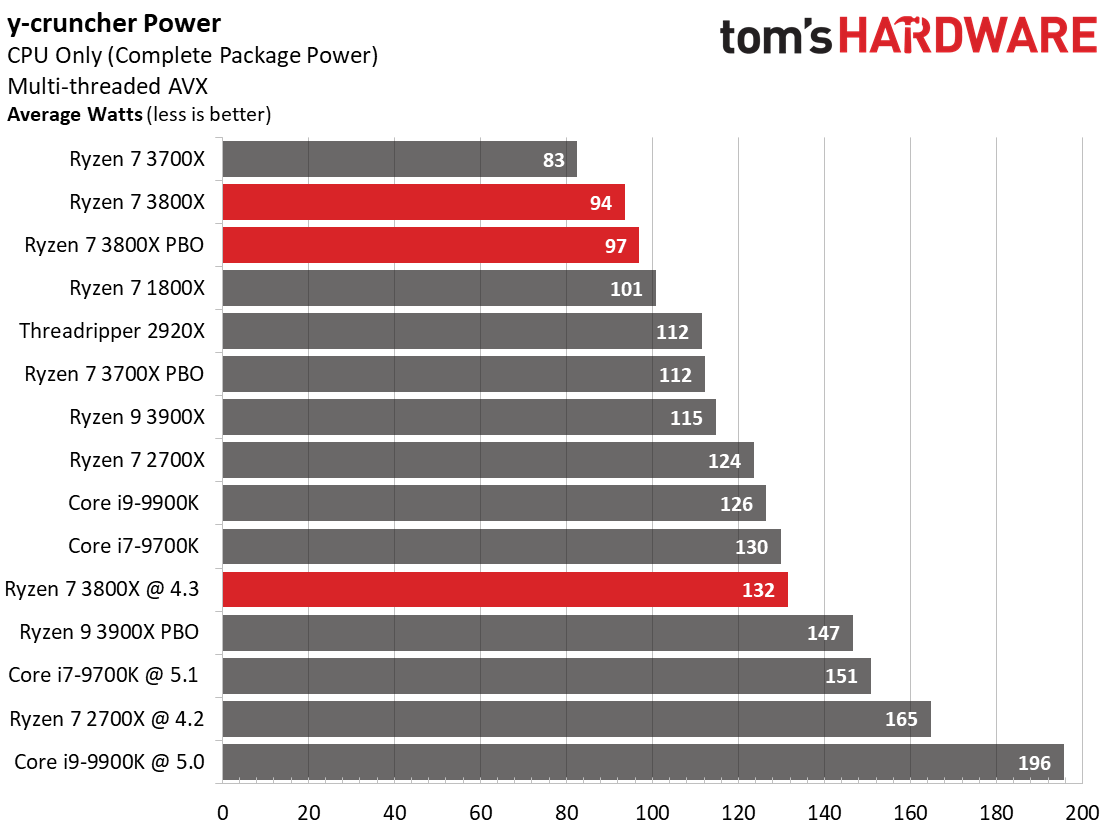
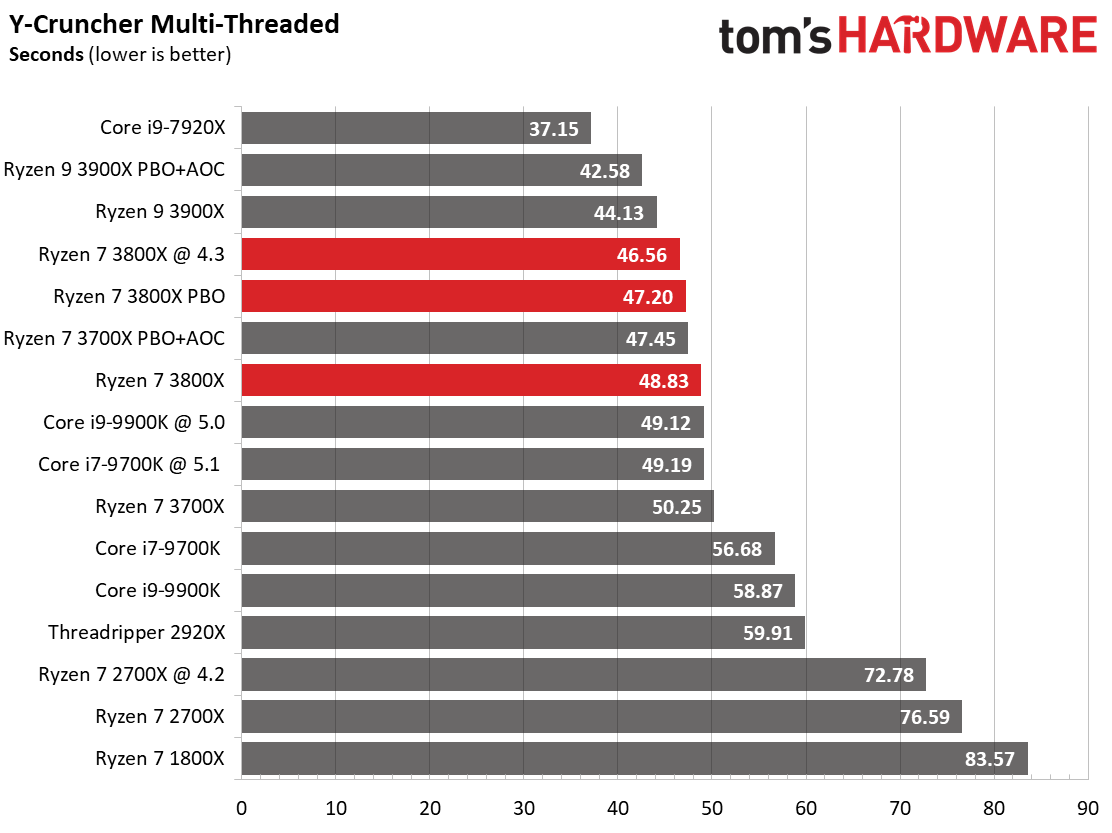
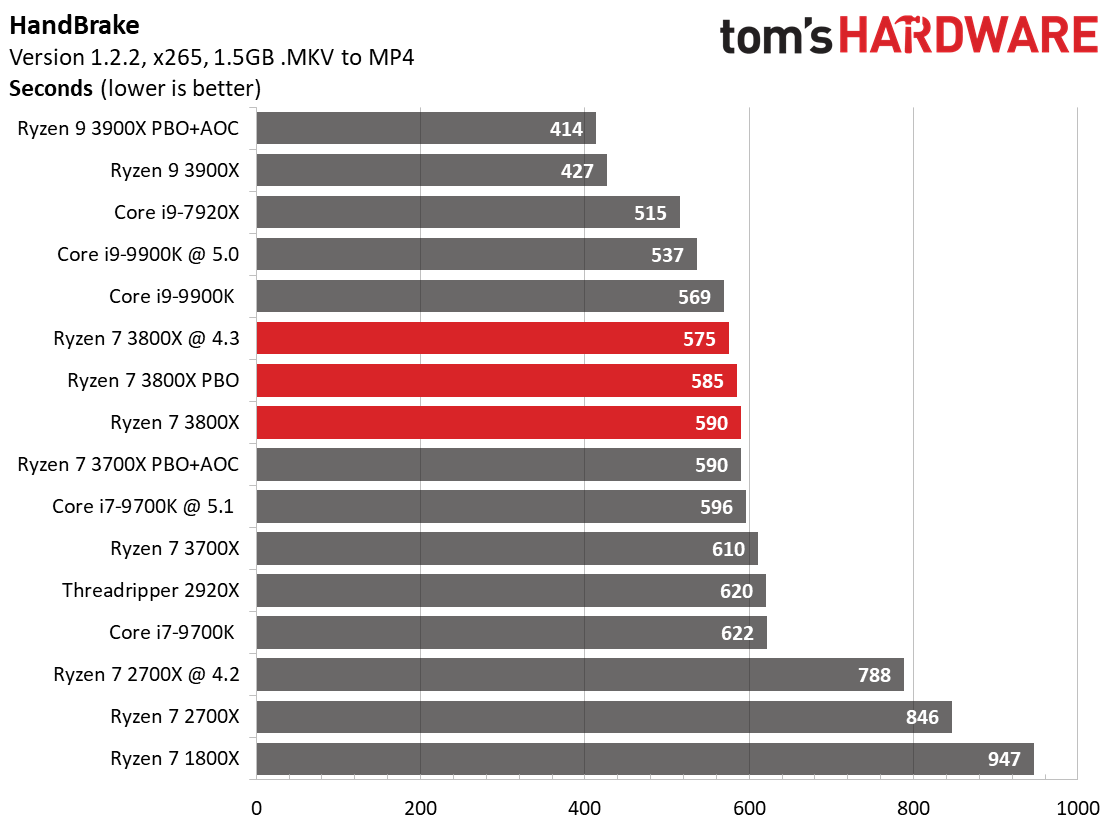
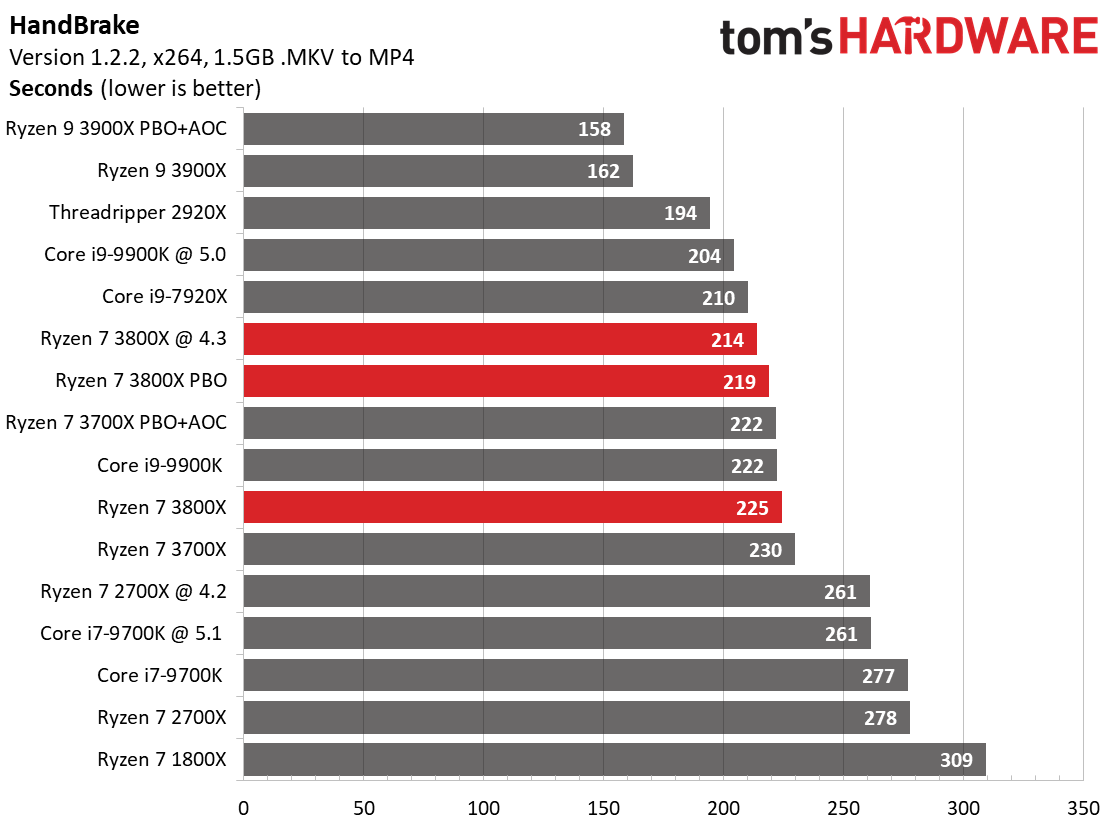
The y-cruncher benchmark computes pi using a heavy multi-threaded AVX workload and also generates a performance measurement that we can use for efficiency metrics. We're also adding in HandBrake in x264 and x265 flavors. The latter uses a heavier distribution of AVX instructions than the former, but both transcoders are great for stressing the processor with a real-world workload.
We see muted increases in the 3800X's power consumption from the PBO option, and as a result, we also see minor performance improvements. Conversely, the all-core overclock consumes much more power but doesn't yield big performance benefits over the PBO settings. It appears that, for stock operation, AMD has tuned the processors right at the point of the voltage/frequency curve that provides the maximum frequency possible that can still provide great efficiency metrics. This PBO configuration also seems to retain some of those same characteristics, but that doesn't leave much headroom for explosive performance gains.
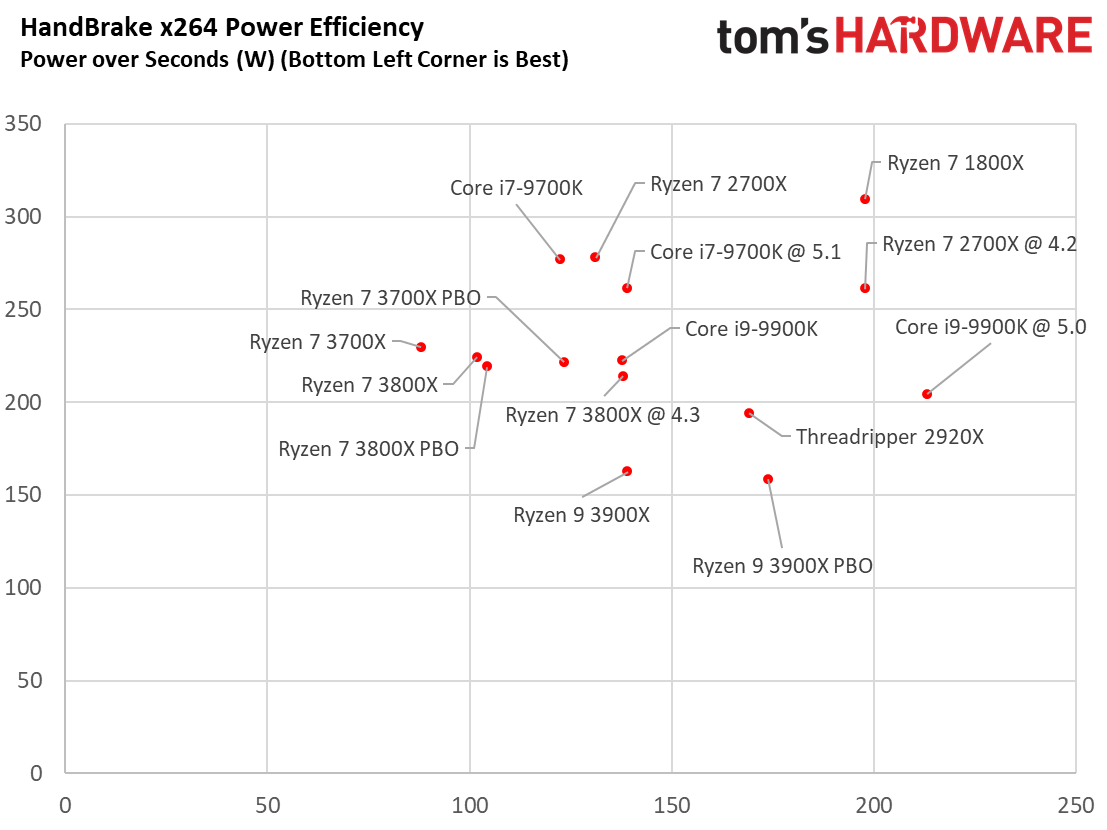
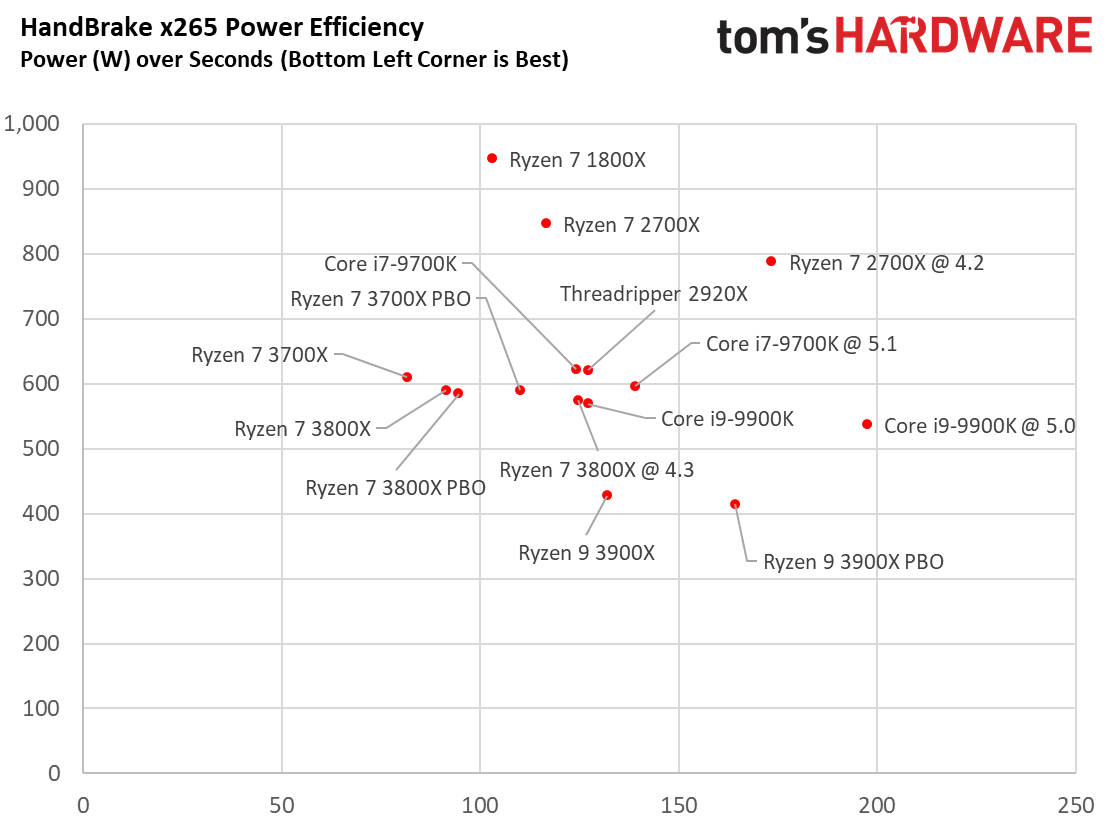
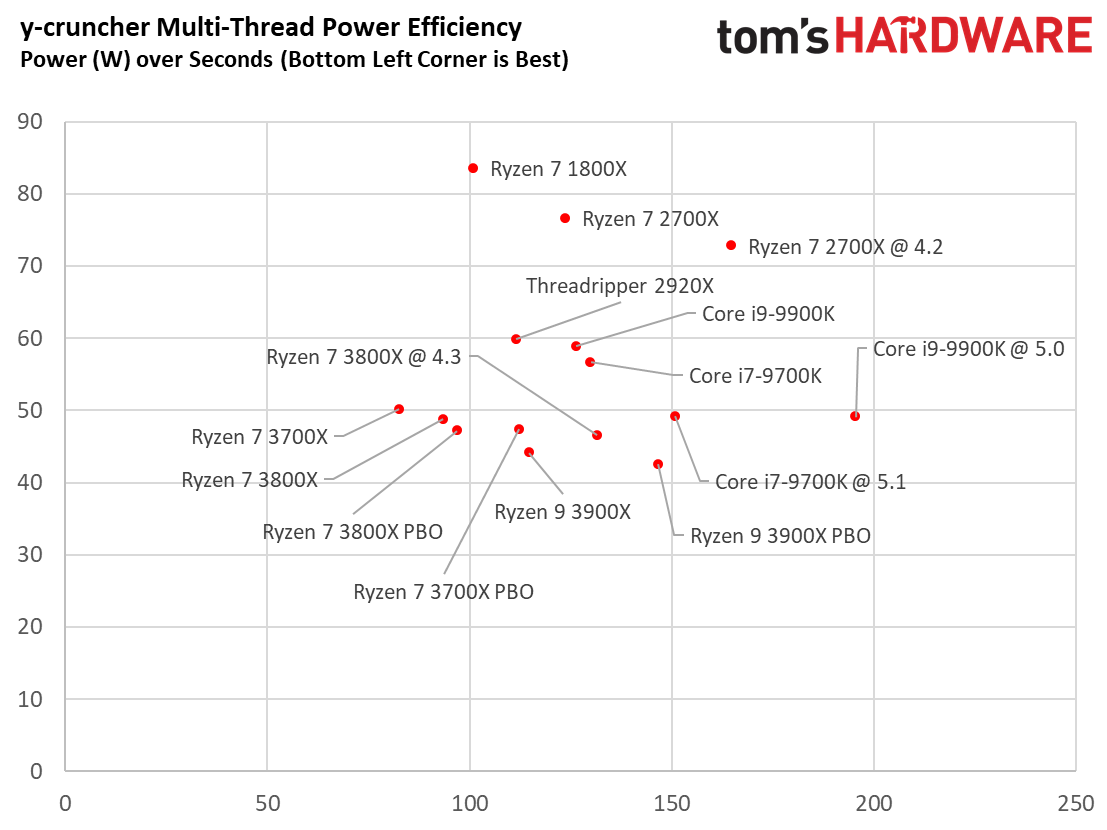
Plotting power consumption over our performance measurements highlights some of the gains we recorded with both overclocked settings. Here we can see the 3800X's 4.3 GHz all-core overclock regularly outperform the stock and PBO configurations, but its performance is very similar to the Ryzen 7 3700X with PBO. The overclocked 3800X's wins over the tuned 3700X weighed in at 1.91% for y-cruncher, 2.6% for x265, and 3.2% with x264 encoding. That shows that the Ryzen 7 3700X, while slower than the 3800X at stock settings by a larger margin, is competitive in threaded workloads after we tune both processors. Let's see how they compare in games.
MORE: Best CPUs
MORE: Intel & AMD Processor Hierarchy
MORE: All CPUs Content
Current page: Power Consumption
Prev Page Boost Clocks, Overclocking, Thermals and Test Setup Next Page VRmark, 3DMark and AotS: Escalation
Paul Alcorn is the Editor-in-Chief for Tom's Hardware US. He also writes news and reviews on CPUs, storage, and enterprise hardware.
-
Math Geek pretty much what i expected from all the Ryzen 3000 series so far. i am not disappointed at all in what i am seeing.Reply
it does look like the 3700x is the better buy. use that $70 savings for better cooling and you got a winner on your hands it looks like. i personally don't care about a few fps at 1080p when both AMD and Intel hit some nice numbers. 140 fps vs 150 fps is pretty much the same thing to me.
but those extra cores/threads from AMD will go a long way with VM's, production software and the other non-game stuff i do regularly. AMD FTW :geek: -
TJ Hooker In light of the 3700X, the 3800X doesn't seem to have much reason to exist to be honest. Not unless boost/OC behavior somehow changes significantly in the future.Reply -
nitrium Given you can get just about the same performance by OCing a 3700X (and the 3800X doesn't OC really at all), I don't really see why AMD even released this chip - especially considering how much more they are asking for it. The value just isn't there.Reply -
mattkiss What command rate are you running your memory kits at? Also, is the memory write speed nerfed like it is on the 3700X?Reply -
JamesSneed Im curious why the 3700x with PBO is pulling considerably more wattage versus the 3800x with PBO. Is binning really making that large of a difference?Reply -
JamesSneed Replynitrium said:Given you can get just about the same performance by OCing a 3700X (and the 3800X doesn't OC really at all), I don't really see why AMD even released this chip - especially considering how much more they are asking for it. The value just isn't there.
If you are going to OC then I mostly agree however the binning looks like it impacts power draw a lot. However you are not guaranteed 3800x performance out of a 3700x. If you do not intend to OC then there are many valid reasons for the 3800x. The 3800x makes a good case for non overclockers especially because it pulls less power than the stock 3700x. However for me I would much rather they had one more tier like a 3850x that was say 4-4.1Ghz base and 4.8 to 4.9 Ghz boost. A higher binned version I would step up for over the 3700x. -
xcomp666 I was waiting for a decent review.Reply
My conclusion:
I am not planning to OC ( I am using an Asrock Fatal1ty B450 Gaming-ITX ) with 105W TDP, I don't think my motherboard's VRM can handle properly ;:coldsweat:
Performance It is just about ~2% over 3700x that has TDP of 65W ;:mad:
PBO is not hitting 4.4 GHz easily ( depends on silicon lottery);:ouimaitre:
70 USD (92 CAD ) over 3700X;
Single Core performance is not that great;So, I am going to buy a Rysen 7 3700X
🤘 -
TJ Hooker Reply
From what I can find that applies to all Ryzen 3K chips with a single compute die, in which case yes it'd be the same for the 3800X.Makaveli said:Does the 3800x have the same memory write limitation as the 3700x
32b vs 16b ?? -
jclaine I just did a 3700x Asrock x470 itx build. I imagine that I will need to use the wifi on it at some point in it's life, that's why I went with the x470 (Intel (1733) ) version over the b450 (Intel 3168 (433) ). I really didn't want a chipset fan because in 8 years I don't want to have to think about that failing in an old abused system, so I passed on x570.Reply
http://www.mustnotsleepgames.com/Comp/A1%2001.jpg
