AMD Ryzen Threadripper 1950X Review
Why you can trust Tom's Hardware
VRMark, 3DMark & AotS: Escalation
Testing Notes
As discussed on page two, Threadripper offers both Creator and Game modes to tailor the processor for different applications. We tested with both to compare the gaming-optimized and out-of-box configurations. Threadripper processors also feature two switches that allow for even more unique configurations, so we also tested with the full complement of cores (legacy off) and memory access set to "local." These “Local/SMT” results provide a nice boost for heavily-threaded games, particularly in overclocked configurations.
Most charts are presented in their entirety. But due to space constraints with our frame time variance graphs, we often include secondary charts with additional Threadripper performance data.
AMD notes that some games prefer different configurations, but we don’t have a detailed list of preferred settings for individual titles. Hopefully our results serve as a guide to gamers looking for the best settings.
Intel also released new microcode for its Skylake-X processors recently, which reduces performance in some titles and lowers the AVX offset by two bins. We also noticed far lower Turbo Boost activation thresholds, though that could separately be the result of MSI's newest BIOS. The changes likely come in response to some of the power and thermal issues we encountered during our extended testing. We consequently retested both Skylake-X processors with the newest microcode.
AMD's Ryzen gaming performance is also a moving target, though it continues to improve over time. Today's story reflects all processors re-tested with the latest chipset, BIOS, GPU drivers, and game patches. We're also deploying a new test image and game suite, so the results contained herein are only directly comparable to our Ryzen 3 1300X review.
VRMark & 3DMark
We aren't big fans of using synthetic benchmarks to measure game performance, but 3DMark's DX11 and DX12 CPU tests provide useful insight into the amount of horsepower available to game engines.
Futuremark's VRMark test lets you gauge your system's suitability for use with the HTC Vive or Oculus Rift, even if you don't currently own an HMD. The Orange Room test is based on the suggested system requirements for current-generation HTC Vive and Oculus Rift HMDs. Futuremark defines a passing score as anything above 109 FPS.
Get Tom's Hardware's best news and in-depth reviews, straight to your inbox.
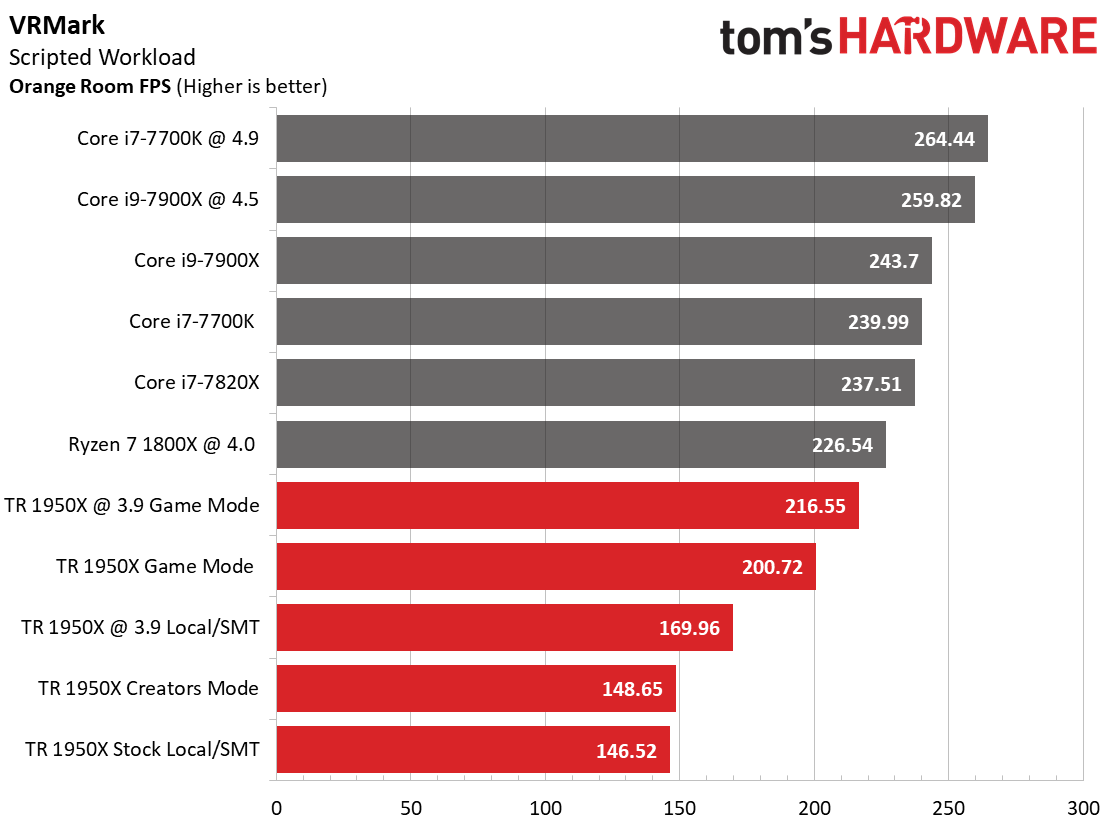
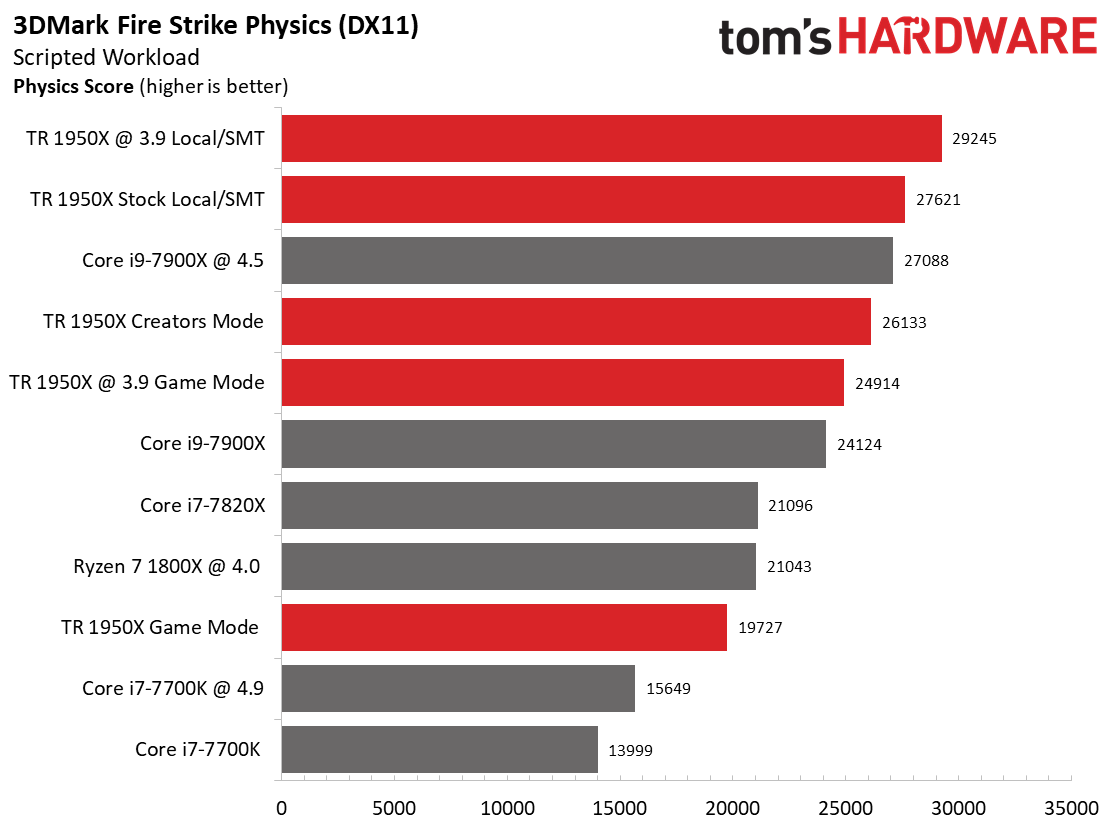
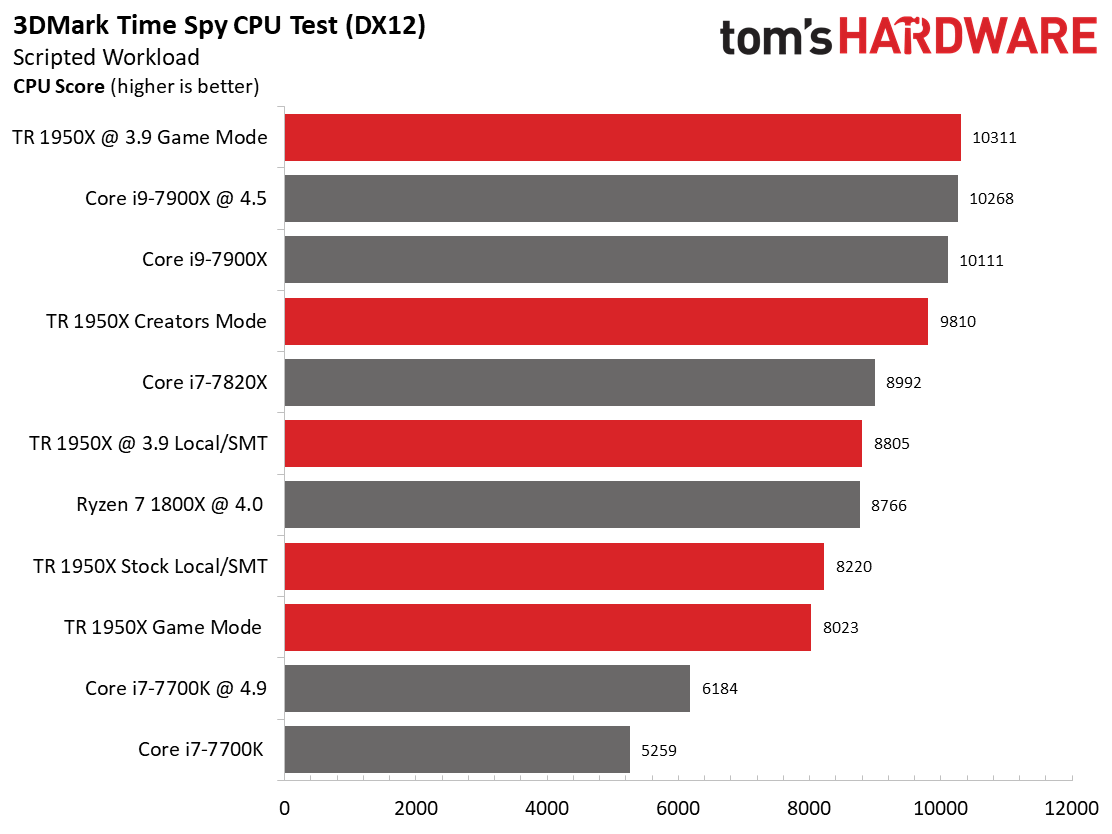
VRMark prizes IPC throughput and frequency. AMD's Ryzen Threadripper processors fall to the bottom of the chart, while the Intel models lead. We suspect that VRMark lacks some of the optimizations incorporated into other games.
The Threadripper 1950X fares much better during the heavily-threaded DX11 physics test, where it leads by a large margin. And it squeezes by the overclocked Core i9-7900X during the DX12 CPU test due to its copious core count. The Core i7-7700K suffers through these two tests due to its quad-core design.
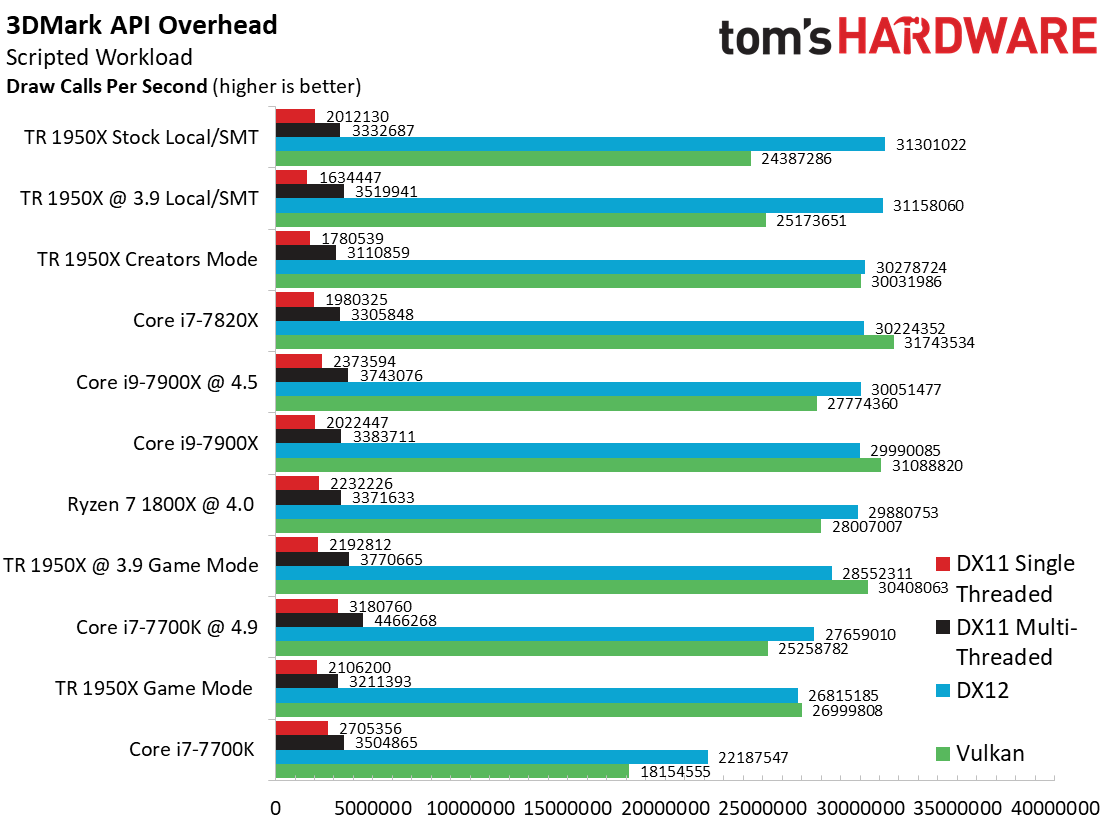
Gaming performance, from a host processing perspective, relies on generating the maximum amount of draw calls (sometimes tens of millions per second) using the relevant API. AMD's Threadripper 1950X shows well in our heavily-threaded DX12 tests. But Vulkan performance suffers with all 32 threads active.
Ashes of the Singularity: Escalation
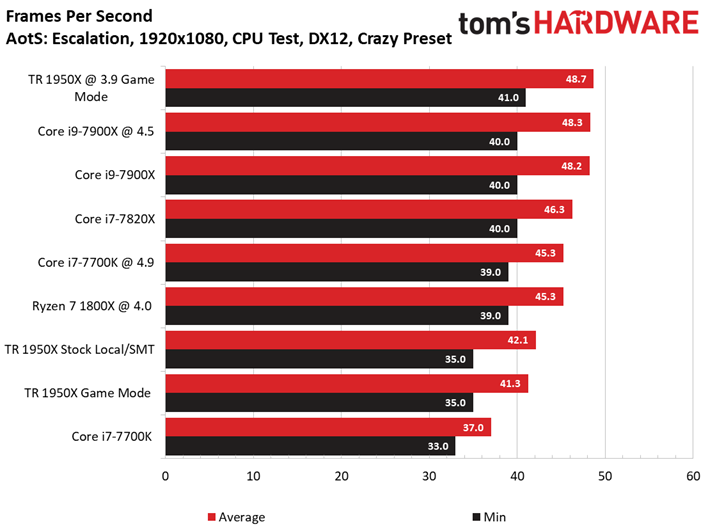
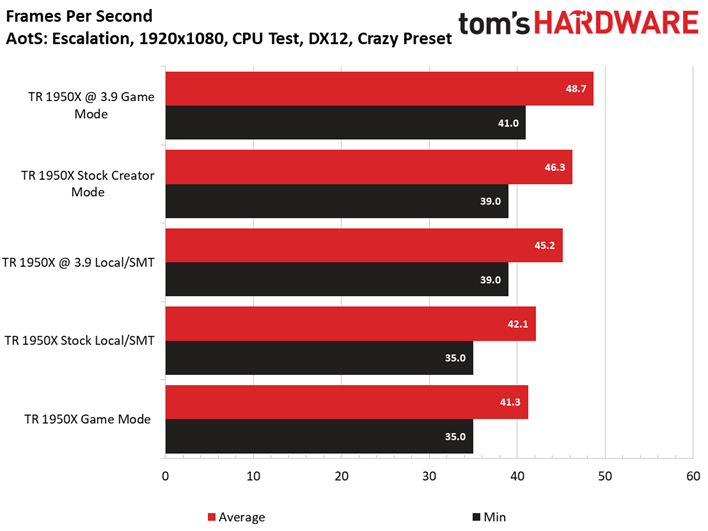
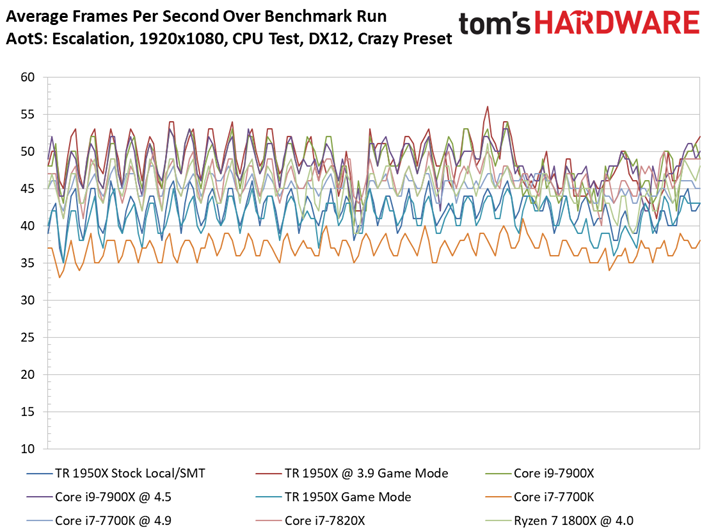
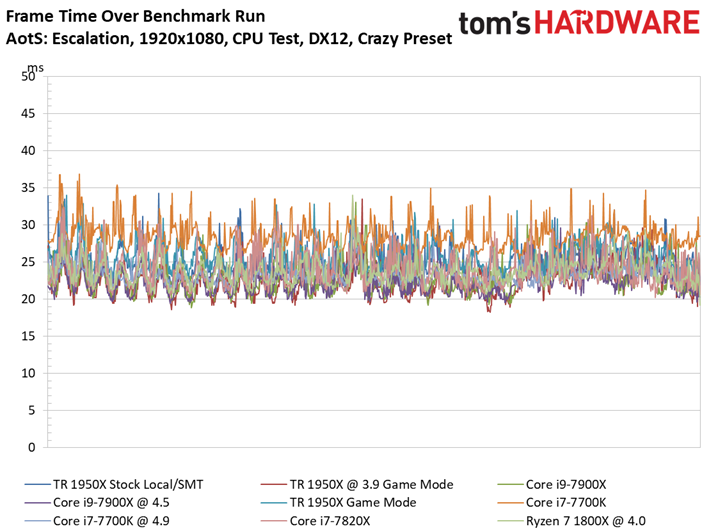
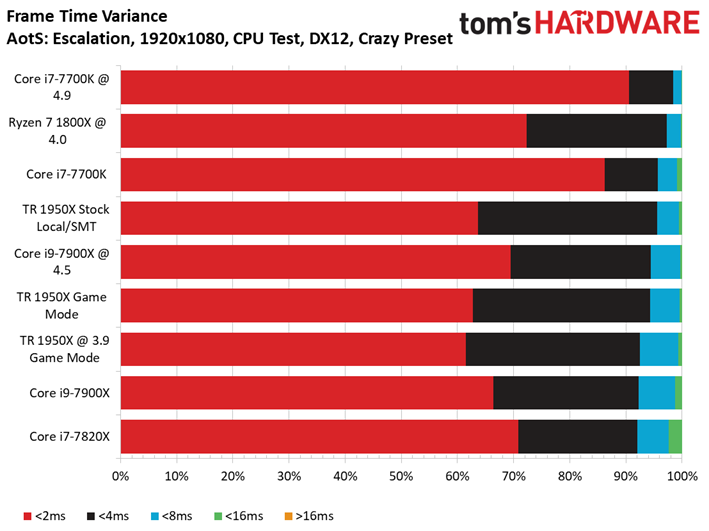
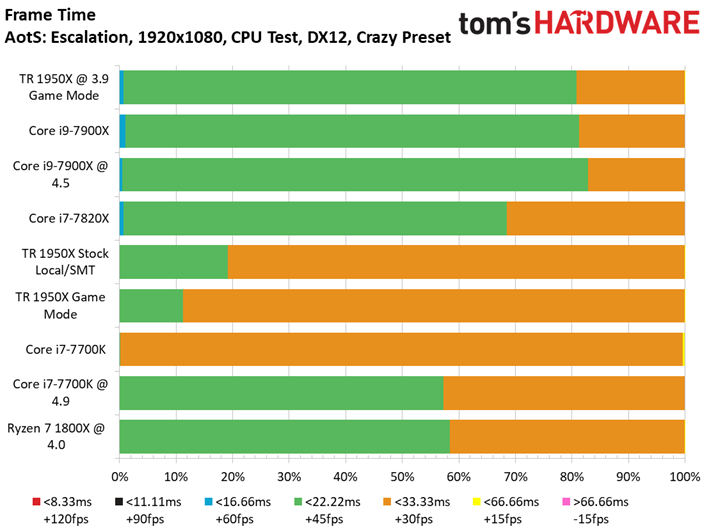
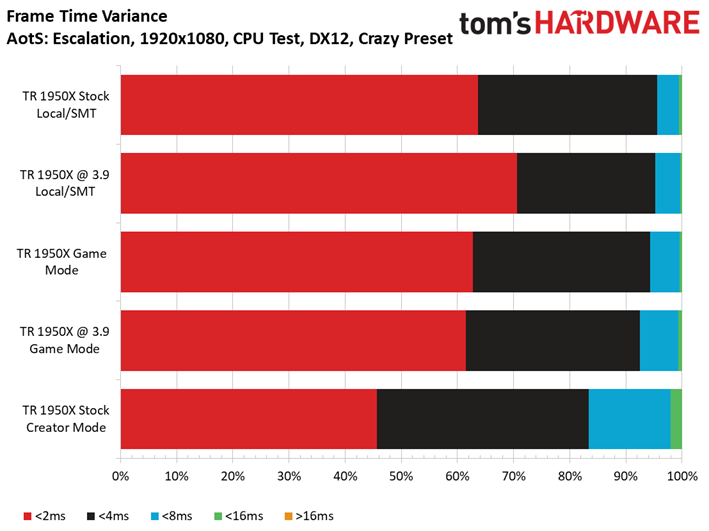
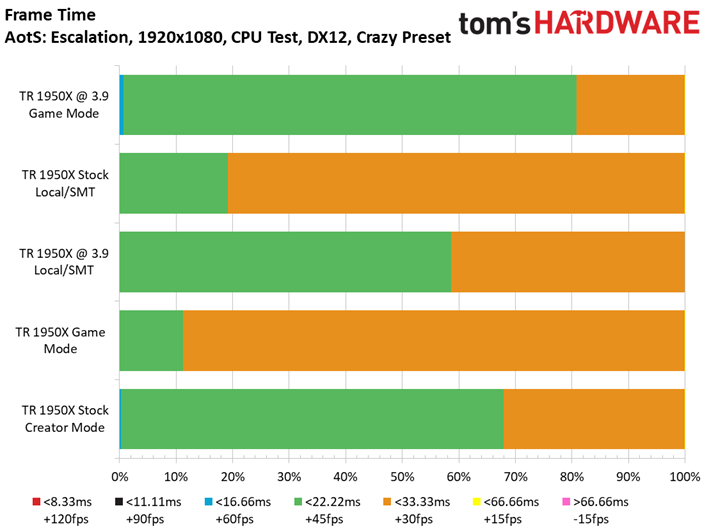
Ashes of the Singularity: Escalation is a computationally intense title that scales well with thread count. That’s music to Threadripper’s ears as the overclocked configuration leads. Intel's 10-core -7900X puts up a stout defense with 60% fewer cores, though.
The 1950X doesn’t fare as well out of the box; an eight-core i7-7820X manages to beat the 16-core contender.
MORE: Best CPUs
MORE: Intel & AMD Processor Hierarchy
MORE: All CPUs Content
Current page: VRMark, 3DMark & AotS: Escalation
Prev Page TR4 Socket, X399 Chipset & Test Setup Next Page Civilization VI, Battlefield 1 & Dawn of War III
Paul Alcorn is the Editor-in-Chief for Tom's Hardware US. He also writes news and reviews on CPUs, storage, and enterprise hardware.
-
I just looked at gaming benchmark and stopped reading there because as i thought Intel CPUs are killing Thread Ripper in gaming. As far as content creation, naturally having 16/32 setup will be faster than Intel 10/20 but again do you really need more than 10/20 cores. I don't and i heavily use PC for gaming, programming, web design, video/audio encoding. Overall Intel 7900x is better value and all around CPU. But if you are just in gaming 7700k is just enough.Reply
Thanks for review, and hello x299 platform.
Gaming vs. Content Creation mode through Software is just another big NO NO to me knowing how crappy AMD software is. I assume the most people will keep it in Game Mode and leave it as it is.
I appreciate that AMD brought this CPU for $999 with so many cores, helps competition but again there is nothing to drool over here in my book. AMD didn't bring any significant performance bump core vs. core basis. In fact AMD single core performance still sucks which means when Intel releases 10+ core CPU it is going to fun to watch.
Two things i am interested the most is Coffee Lake product and IPC improvement there and possible price adjustment with Core i9.
-
Kai Dowin I'm truly impressed to see 16 Zen cores consuming as much power as only 10 Skylake-X ones. Bravo, AMD!Reply -
Reply20045233 said:I'm truly impressed to see 16 Zen cores consuming as much power as only 10 Skylake-X ones. Bravo, AMD!
I am not knowing that Intel is running higher frequency.
-
JamesSneed Reply20045197 said:I just looked at gaming benchmark and stopped reading there because as i thought Intel CPUs are killing Thread Ripper in gaming. As far as content creation, naturally having 16/32 setup will be faster than Intel 10/20 but again do you really need more than 10/20 cores. I don't and i heavily use PC for gaming, programming, web design, video/audio encoding. Overall Intel 7900x is better value and all around CPU. But if you are just in gaming 7700k is just enough.
Thanks for review, and hello x299 platform.
Gaming vs. Content Creation mode through Software is just another big NO NO to me knowing how crappy AMD software is.
I love Intel even more...all you have to do pop CPU in and shit works and it works well.
I guess if gaming is why you were reading the Threadripper review then you are right it isn't as good as Intel's offerings but did you honestly expect any other result? I don't know why reviewers even do gaming tests on any CPU over 8 cores as it is mostly pointless. If you are doing scientific, encoding, professional tasks in just about every use case that is multi threaded it is blowing away every Intel offering. Of course that may change once there are 12-18 core Intel parts. However spending $1000 for a CPU is a bargain for those than can use it and never in history could you get a 16 core consumer part with this type of multi-threaded performance.
-
Lyden Thank you for this review. I was seriously considering Threadripper. Looks like the 7700k is still the sensible choice for the price when gaming.Reply -
Kai Dowin @FREAK777POWER And delivering higher multi-threaded performance with these lower clocked cores. Do you know what that's called? Efficiency.Reply -
redgarl This chip is designed for heavy calculation multithreading, it is not made for gaming, however it is working well with 1440p and 2160p.Reply
By the way, who in their mind will buy a 16 core CPU and play at 1080p with a 1080 TI... seriously, these 1080p bench are a joke and don't represent reality...
"A standard or point of reference against which things may be compared." Oxford
1080p with 1080 TI with a 16 core processor is not a point of reference at all. -
Pompompaihn Who are you people that come here and <ModEdit> about gaming performance on these chips??Reply
Threadripper is the F250 of CPUs. It's not the fastest, but it's plenty fast for 99% of your tasks, and if you need to haul a 12,000 pound trailer it'll do that, too. This is for people who do a lot of WORK on their machine but also game on the side.
<Moderator Warning: Watch your language in these forums>