AMD vs. Intel: Which PC Build is Better for Under $500
Benchmark Results
Before we get into our test results, note that, in order to take full advantage of the AMD system’s abilities, we overclocked the Vega 11 graphics silicon to 1,550MHz (up from the stock 1,250MHz) for our gaming tests, though we left the CPU cores at stock speed in order to assure the best possible cooling and stability for gaming.
For the CPU-specific Cinebench and Geekbench tests, we reverted the AMD machine to stock settings, because overclocking the graphics speed lowers CPU performance under some conditions. This is dead-simple to do with AMD’s Ryzen Master software, with just a few clicks and a reboot required to switch between stock and overclocked settings.
If you invest in a more powerful cooler, you could probably achieve higher clocks and better performance with the AMD machine. But again, doing that would break our budget and likely put you into pricing territory where it would make more sense to buy a dedicated card that delivers better performance out of the box.
To test our budget gaming PCs, we put them through a series of CPU and gaming benchmarks.
As we expected, the GTX 1050 outclassed the Vega graphics in every game and graphics test we ran, but the Ryzen held its own on CPU tests, making it better if you also want to use your PC for productivity.
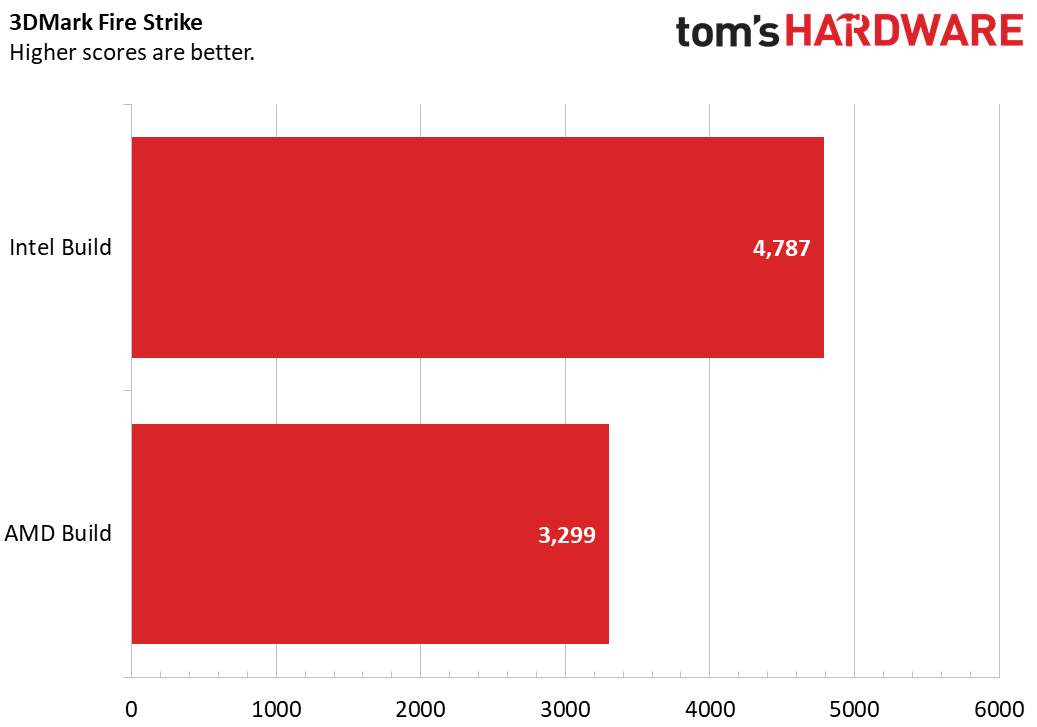
3DMark Fire Strike
The Intel build with the GTX 1050 took an early graphics lead in our testing. On 3DMark Fire Strike, it earned a score of 4,787, beating the AMD machine at 3,299.
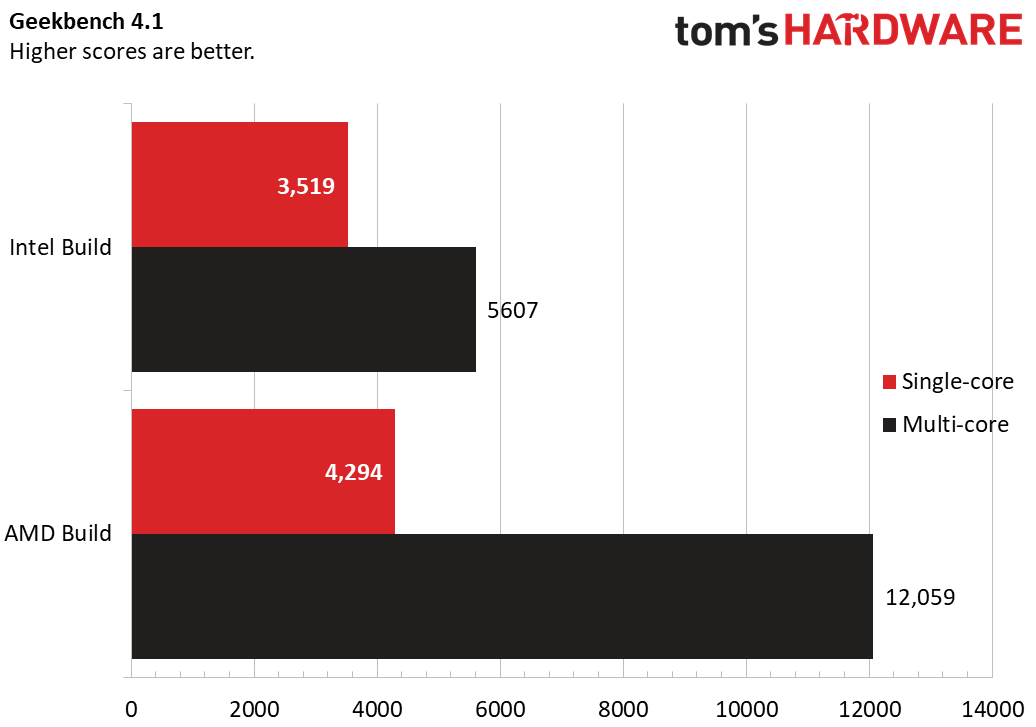
Geekbench 4.1
Our Ryzen-based build dominated in the Geekbench 4.1 face-off with a single-core score of 4,294 and a multi-core score of 12,059. The Pentium earned a single-core score of 3,519 and a multi-core score of 5,607.
Get Tom's Hardware's best news and in-depth reviews, straight to your inbox.
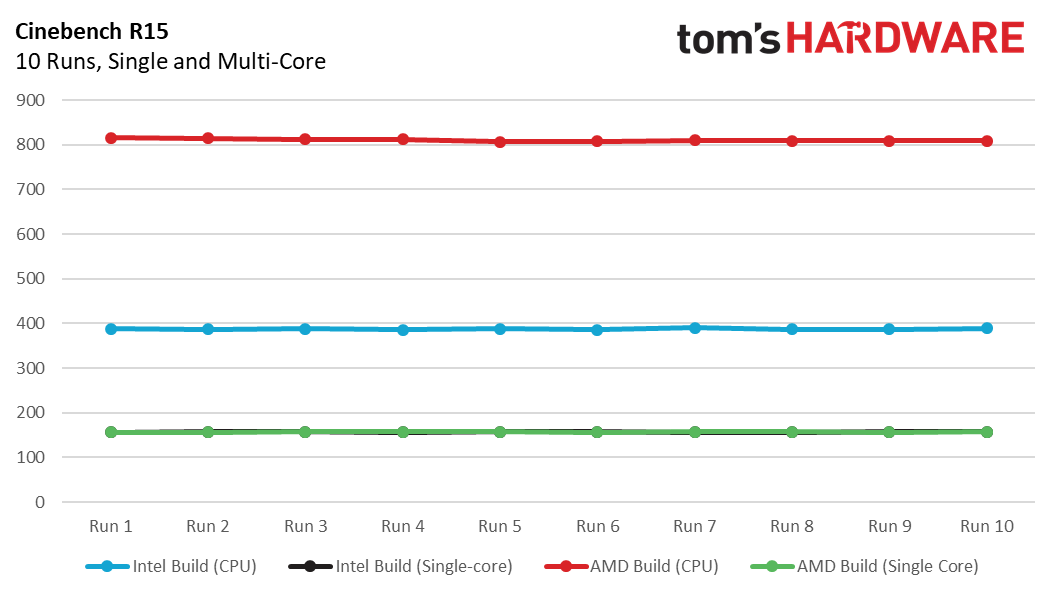
Cinebench R15
We got our most fascinating results when we ran Cinebench R15 ten times in a loop. The Ryzen again beat the Pentium in multi-core performance, notching an average CPU score of 810.7 vs Intel’s 387.7.
But in single core performance, they were roughly equal. They ended up with the same average score of 157.6 after ten runs, so they overlap on our chart.
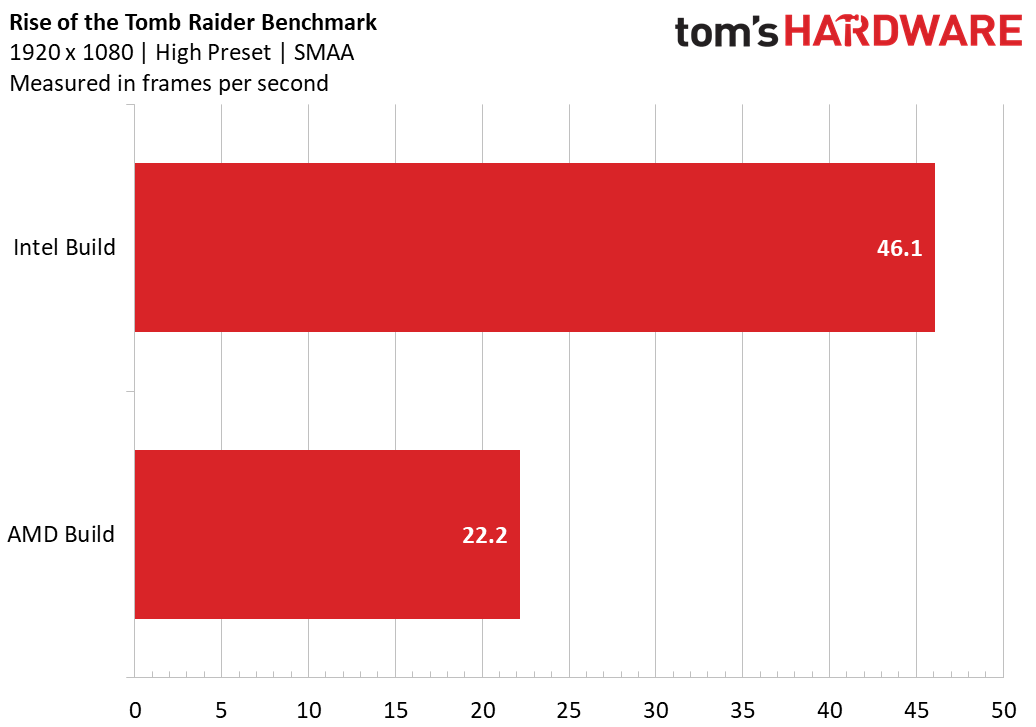
Rise of the Tomb Raider
We ran the Rise of the Tomb Raider benchmark with our standard test for budget gaming machines. We had exclusive fullscreen on, switched on SMAA anti-aliasing and used the high graphics preset. Our Intel build averaged 46.1 frames per second, but on the AMD machine you’d need lower settings, as it came in at just 22.2 fps.
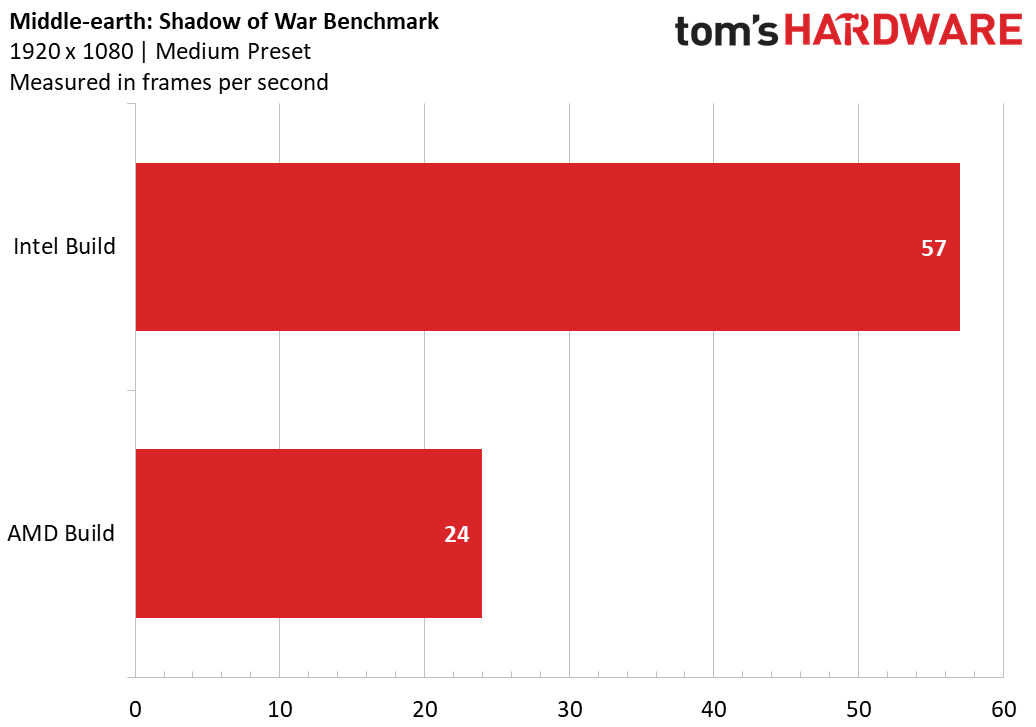
Middle-earth: Shadow of War
Both games earned playable scores on the Middle-earth: Shadow of War benchmark, which we ran on the medium preset at 1920 x 1080. The AMD machine ran at 24 fps and the Intel build ran at 57 fps.
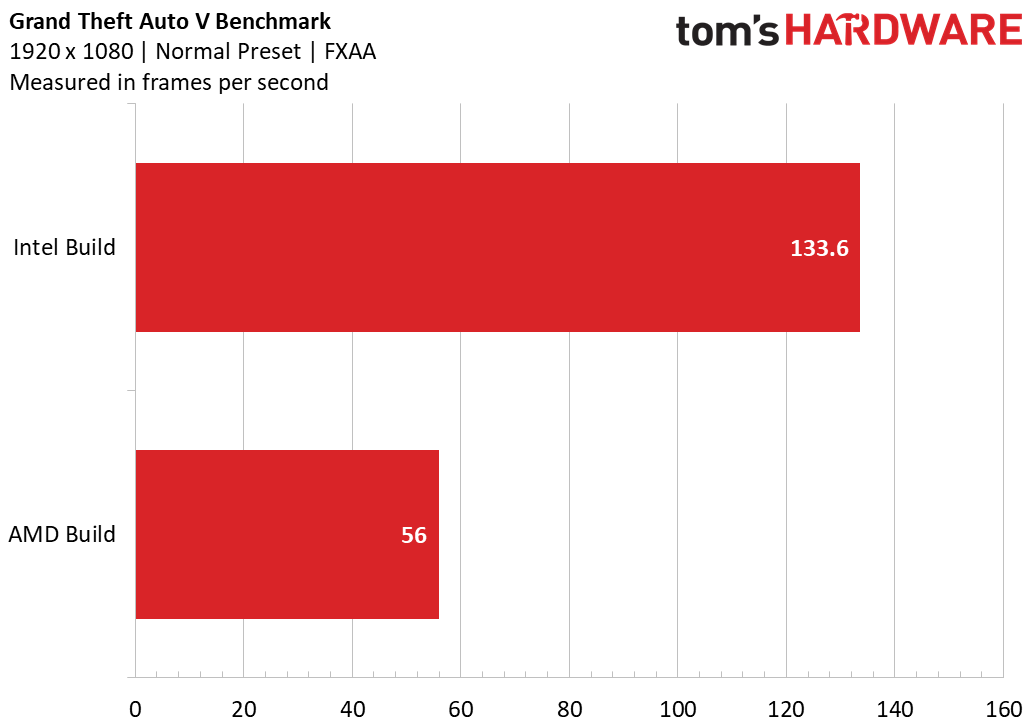
Grand Theft Auto V
On the Grand Theft Auto V benchmark with DirectX 11, 1920 x 1080 resolution, FXAA anti-aliasing and normal presets, the AMD notched a respectable average frame rate of 56 fps, but our Intel build with its discrete graphics again beat it at 133.6 fps. Note that you may be able to eke out slightly higher frame rates from the AMD build via overclocking. But on our system at least, the GTA V benchmark would only run at stock settings, so we had to dial back our overclock for this title.
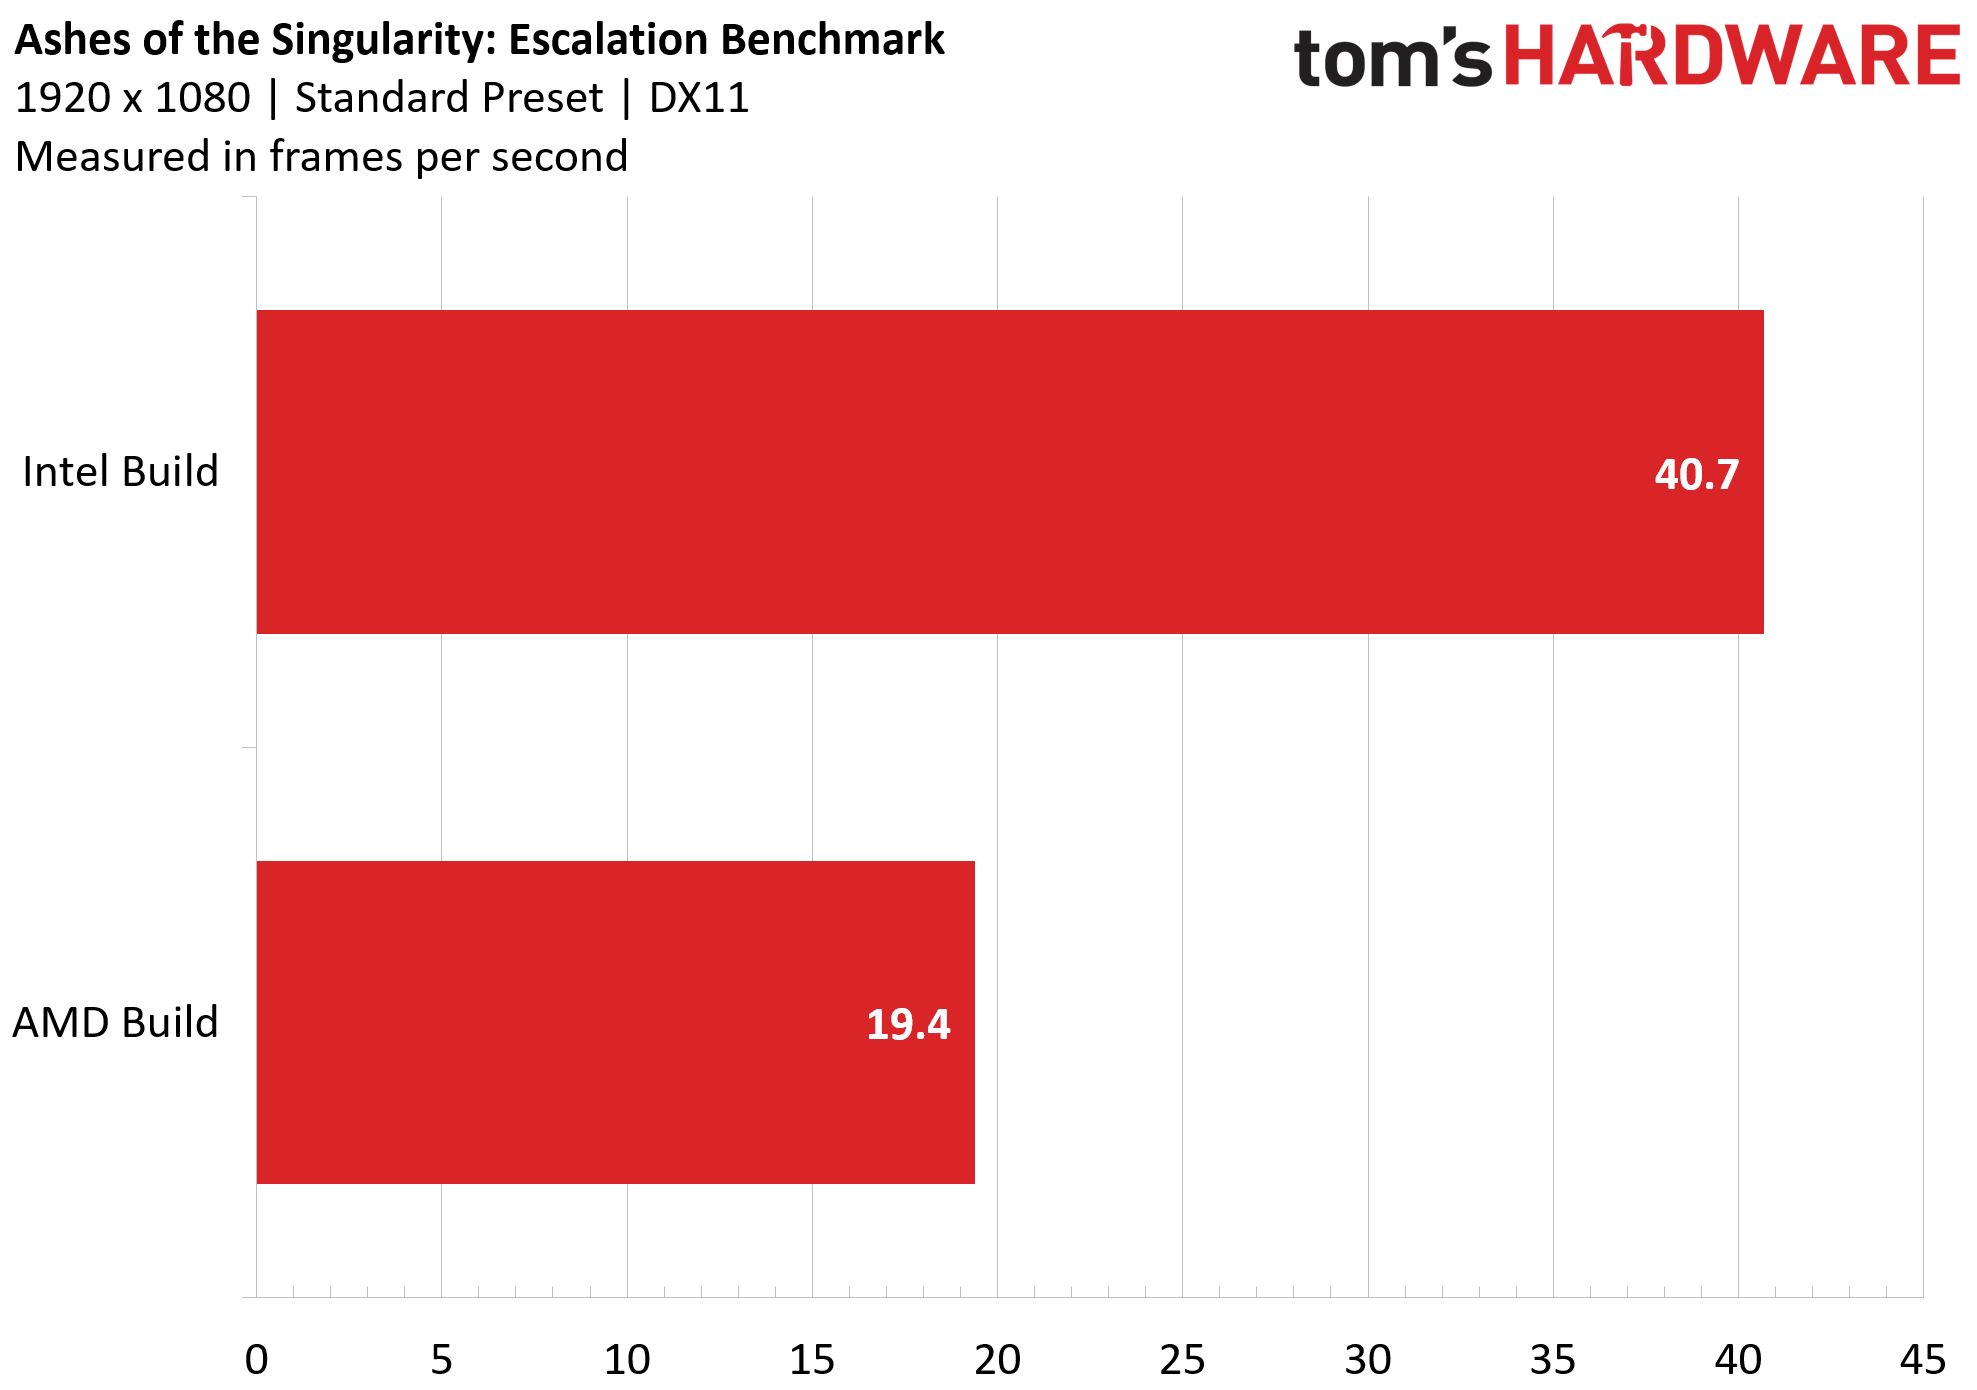
Ashes of the Singularity: Escalation
On Ashes of the Singularity: Escalation, we ran the benchmark at 1920 x 1080 with standard settings and DirectX 11. Our Intel build with GTX 1050 ran the game at 40.7 fps, but the AMD build stuttered at 19.4 fps.
MORE: Best PC Builds
MORE: How To Build A PC
MORE: All PC Builds Content
Current page: Benchmark Results
Prev Page Intel/Nvidia Build: Pentium Gold G5400 & Nvidia GTX 1050 Next Page ConclusionAfter a rough start with the Mattel Aquarius as a child, Matt built his first PC in the late 1990s and ventured into mild PC modding in the early 2000s. He’s spent the last 15 years covering emerging technology for Smithsonian, Popular Science, and Consumer Reports, while testing components and PCs for Computer Shopper, PCMag and Digital Trends.
-
ikaz I think most people who frequent this site already knew the answer igpu vs gpu. I think what would be an interesting would be to see how cheap you can make AMD vs Intel. Trying to keep them as close as possible with cost, maybe a 2200G vs pentium+1030 GT (though probably still faster) and what the cost difference would be. Then say put in a high end card to see which one bottlenecks quicker. That way if some one is building a PC now but doesn't have the money for say 1060/580 but plan to add one later they can see which is a better long term CPU build or if it even matters if they plan on upgrading the CPU long with the GPU.Reply -
Math Geek very interesting article.Reply
i like the extra space of the AMD build for sure over the intel build. but i also know that an ssd is not essential to me at lower budgets and i'd easily drop a large hdd in place of it to stay on budget with the intel build. little bit of load time loss would be well worth fixing the anemic amount of storage space currently in there. dropping 1-2 tb hdd in there for the same money makes the system much more viable. the ssd can come later when some extra cash is on hand to add the upgrade :)
also like to see about the future upgrade path when better gpu is added in down the line. perhaps something like a 1060 or so would be interesting to see how it performs with the budget cpu's for that person thinking down the line but also wants to get started now.
but the rest seems like good choices made for the low budget builder. -
tikal Such a useless and biased article. And to have the never to write INTEL vs AMD on the chart, when INTEL based PC and dedicated GPU. Are you paid for this kind of reporting?Reply -
WildCard999 Why go with a 500gb SSD anyways when you can easily go 240/250gb with a 1TB HDD for the same price? Most of your games won't benefit from being on a SSD.Reply
https://pcpartpicker.com/list/KGtLfH -
Math Geek Reply21369691 said:Such a useless and biased article. And to have the never to write INTEL vs AMD on the chart, when INTEL based PC and dedicated GPU. Are you paid for this kind of reporting?
care to elaborate on how it is biased? budget was set, parts were picked within that budget and compromises were made on both systems to stay on budget. so how exactly is it biased? i prefer AMD myself but can't find fault other than storage choice for the intel build, which is more a personal preference than anything. -
Krazie_Ivan Reply
the smaller SSD+HDD argument makes even more sense with the AMD platform due to StoreMI... it uses so little SSD space, while making games & apps stored on the HDD load at about the same speed they would if stored on the SSD alone. huge value in that software, but not often noted by the tech press.21369700 said:Why go with a 500gb SSD anyways when you can easily go 240/250gb with a 1TB HDD for the same price? -
SkyBill40 Good lord, Matt. Who proofed this before it was published?Reply
That said, naturally the machine with the discrete graphics solution is going to win out against an iGPU even as good as the one on the 2400G. Unless you're comparing like for like, this doesn't make much sense to me. Come on, man. You guys can and should do better than this. -
Paul Alcorn Reply21369746 said:Good lord, Matt. Who proofed this before it was published?
That said, naturally the machine with the discrete graphics solution is going to win out against an iGPU even as good as the one on the 2400G. Unless you're comparing like for like, this doesn't make much sense to me. Come on, man. You guys can and should do better than this.
I think quantifying the difference between the two builds is important. How much do you give up with integrated graphics, but also, what do you gain if you use them?
Do these tests answer a question that directly impacts the readers' purchasing decision? I think they do. -
SkyBill40 Reply21369766 said:21369746 said:Good lord, Matt. Who proofed this before it was published?
That said, naturally the machine with the discrete graphics solution is going to win out against an iGPU even as good as the one on the 2400G. Unless you're comparing like for like, this doesn't make much sense to me. Come on, man. You guys can and should do better than this.
I think quantifying the difference between the two builds is important. How much do you give up by using integrated graphics, but also, what do you gain? Are these tests useful and answer a question that directly impacts the readers' purchasing decision? I think they do.
I get that, Paul. If that is the case, then why not build four systems? Two each using integrated solutions and two using discrete cards. That seems a more fair and complete test in my opinion. Meh, what do I know. :/ -
Paul Alcorn Reply21369785 said:21369766 said:21369746 said:Good lord, Matt. Who proofed this before it was published?
That said, naturally the machine with the discrete graphics solution is going to win out against an iGPU even as good as the one on the 2400G. Unless you're comparing like for like, this doesn't make much sense to me. Come on, man. You guys can and should do better than this.
I think quantifying the difference between the two builds is important. How much do you give up by using integrated graphics, but also, what do you gain? Are these tests useful and answer a question that directly impacts the readers' purchasing decision? I think they do.
I get that, Paul. If that is the case, then why not build four systems? Two each using integrated solutions and two using discrete cards. That seems a more fair and complete test in my opinion. Meh, what do I know. :/
You know a lot, eight badges! You make a fair point about testing multiple systems. I am working on the Athlon review, though. It has pretty decent Vega graphics for its price point, so you know we'll be testing them. Also, I'll test it with a GPU so we can see how it fares against the rest of our recommended cheap chips. The 2400G, 2200G, and Pentiums are in the test pool. We'll be testing both integrated and discrete there, too, so maybe that will help.
