Asus ROG Thor 1200W PSU Review: Asus Brings a Screen to the PSU Party
Why you can trust Tom's Hardware
Protection Features, DC Power Sequencing, Cross-Load Tests and Infrared Images
Protection Features
| Protection Features | |
| OCP | 12V: 142A (142%), 12.147V 5V: 35.6A (142.4%), 4.994V 3.3V: 30.7A (122.8%), 3.323V 5VSB: 3.8A (126.67%), 5.051V |
| OPP | 1719.7W (143.31%) |
| OTP | ✓ (178°C @ 12V Heat Sink) |
| SCP | 12V: ✓ 5V: ✓ 3.3V: ✓ 5VSB: ✓ -12V: ✓ |
| PWR_OK | Proper Operation |
| NLO | ✓ |
| SIP | Surge: MOV Inrush: NTC Thermistor & Bypass Relay |
The OPP is set higher than 130 percent, allowing the PSU to deliver almost 1720W before it shuts it down. Given that it is destined for enthusiast users who most likely will use it along with highly overclocked systems, this OPP setting makes sense. It should cope well with power spikes coming from various components, especially GPUs and CPUs.
DC Power Sequencing
According to Intel’s most recent Power Supply Design Guide (revision 1.4), the +12V and 5V outputs must be equal to or greater than the 3.3V rail at all times. Unfortunately, Intel doesn't mention why it's so important to always keep the 3.3V rail's voltage lower than the levels of the other two outputs.
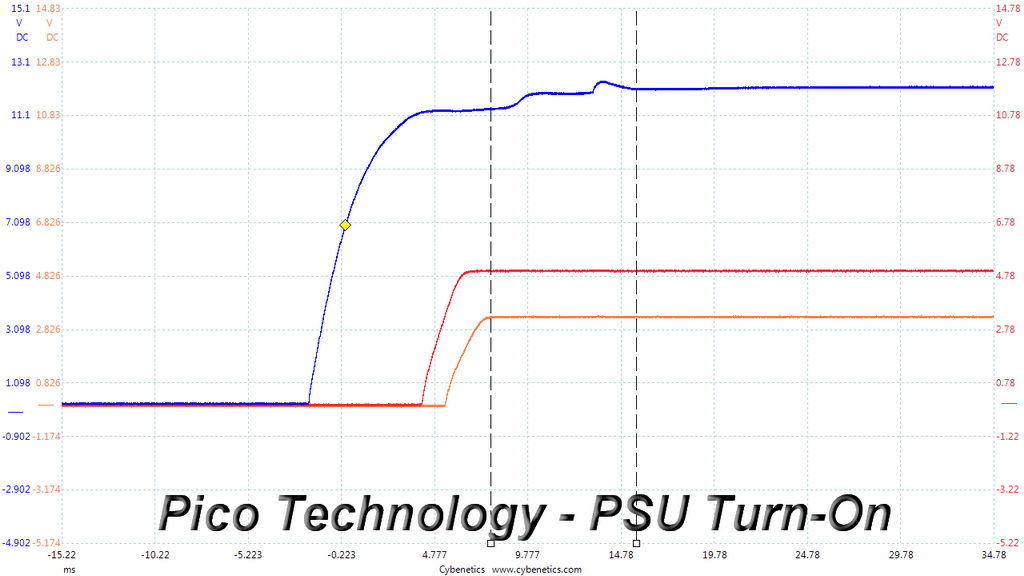
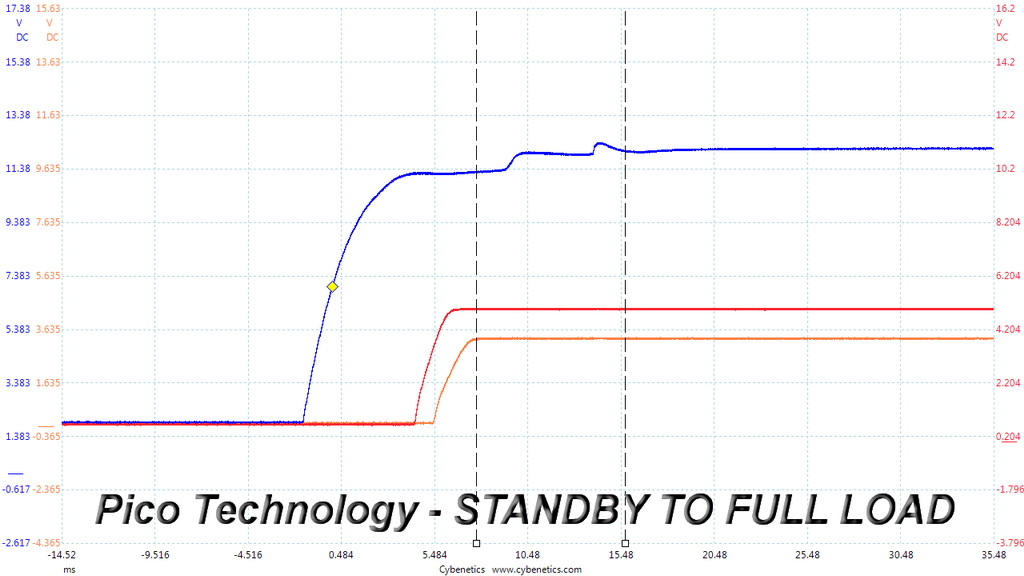
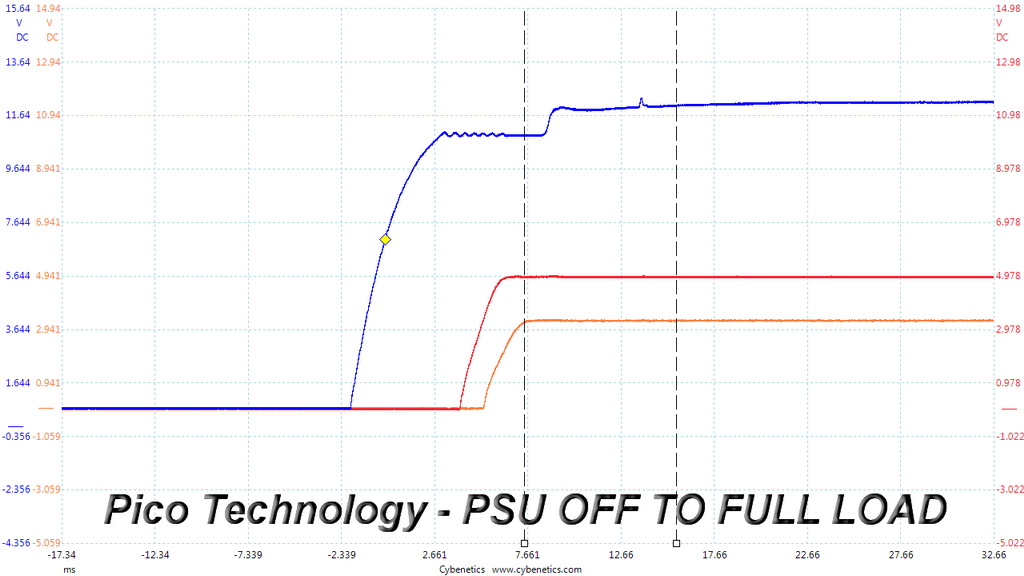
There are no problems here since the 3.3V rail's voltage is always lower than the other two rails. We would like to see smoother waveforms, though, at +12V.
Cross Load Tests
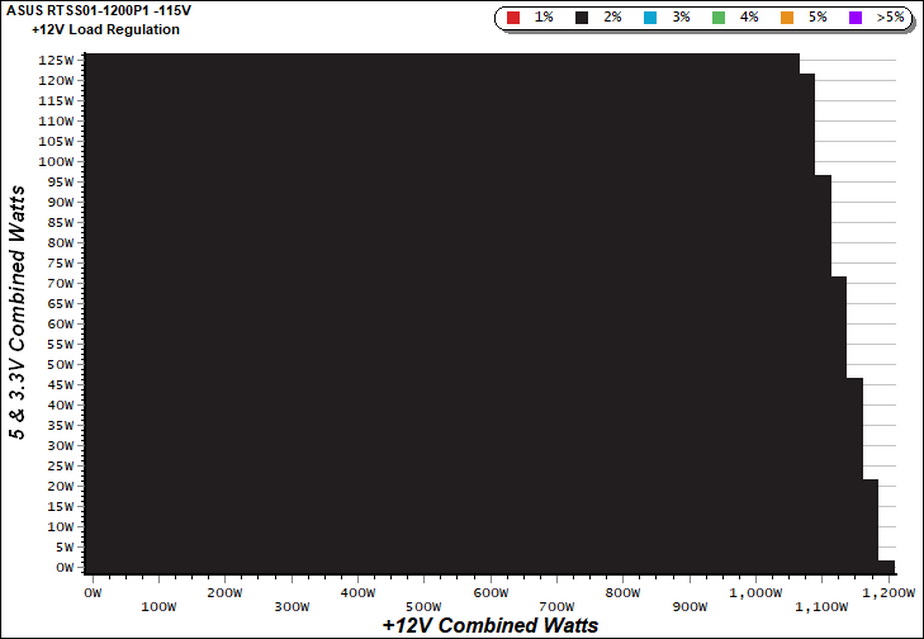
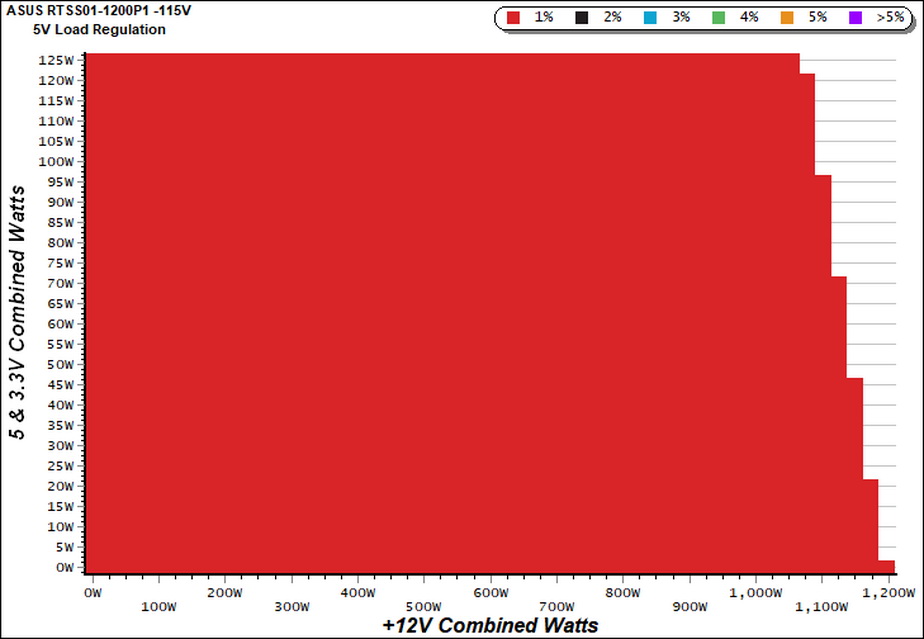
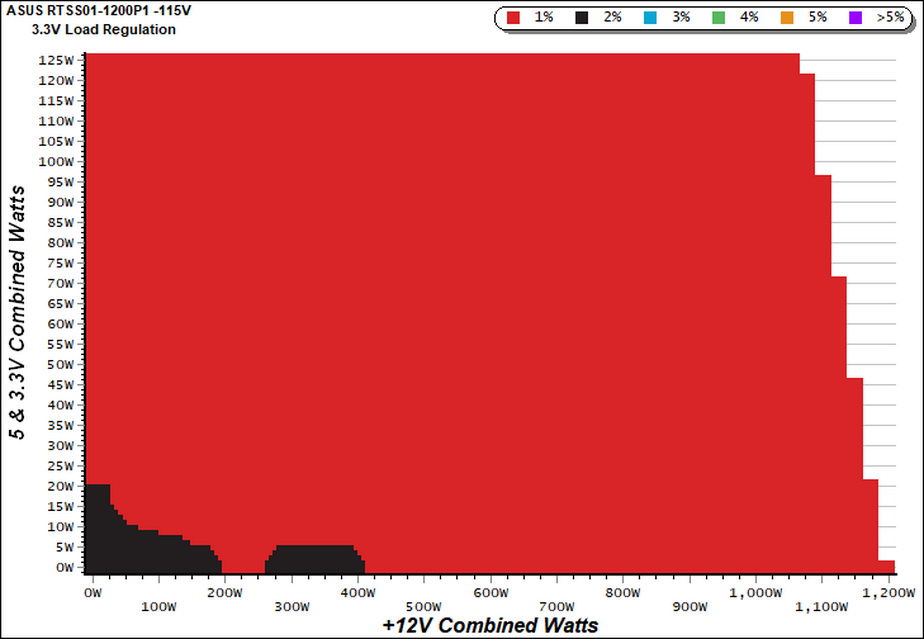
To generate the following charts, we set our loaders to auto mode through custom-made software before trying more than 25,000 possible load combinations with the +12V, 5V, and 3.3V rails. The deviations in each of the charts below are calculated by taking the nominal values of the rails (12V, 5V, and 3.3V) as point zero. The ambient temperature during testing was between 30°C (86°F) and 32°C (89.6°F).
Load Regulation Charts
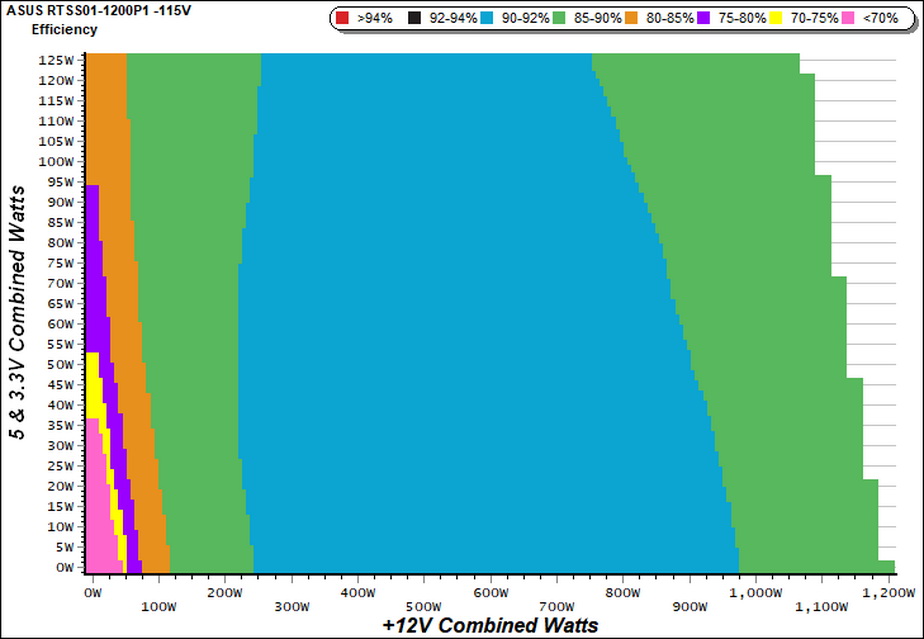
Efficiency Chart
Normally in very high-end power supplies we see a region where efficiency surpasses 92%, but as you can see this is not the case here.
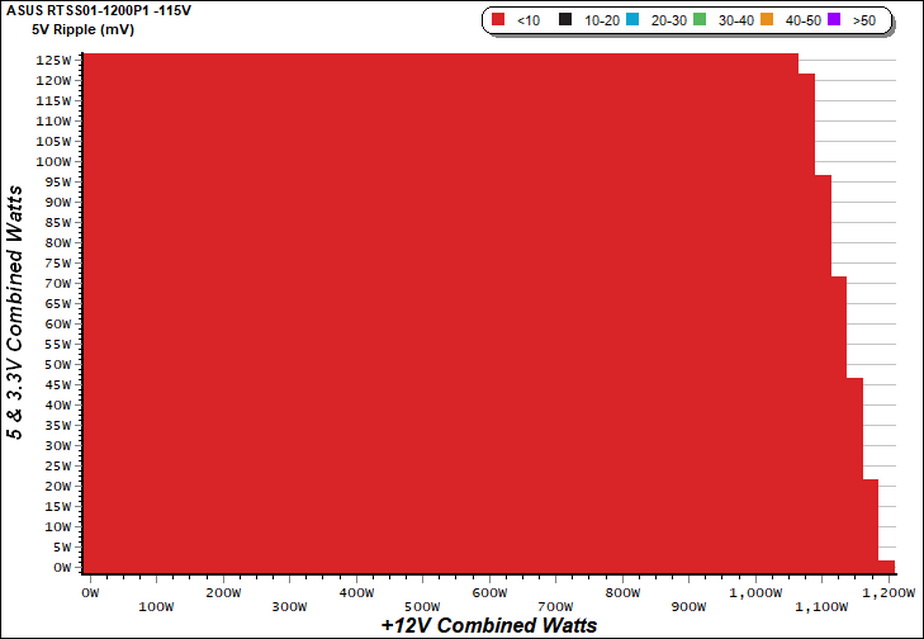
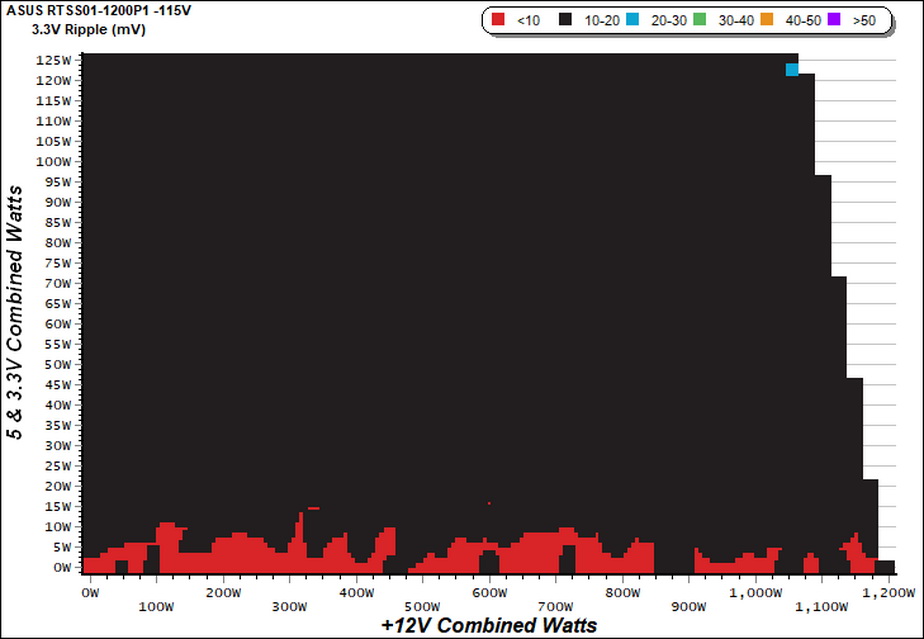
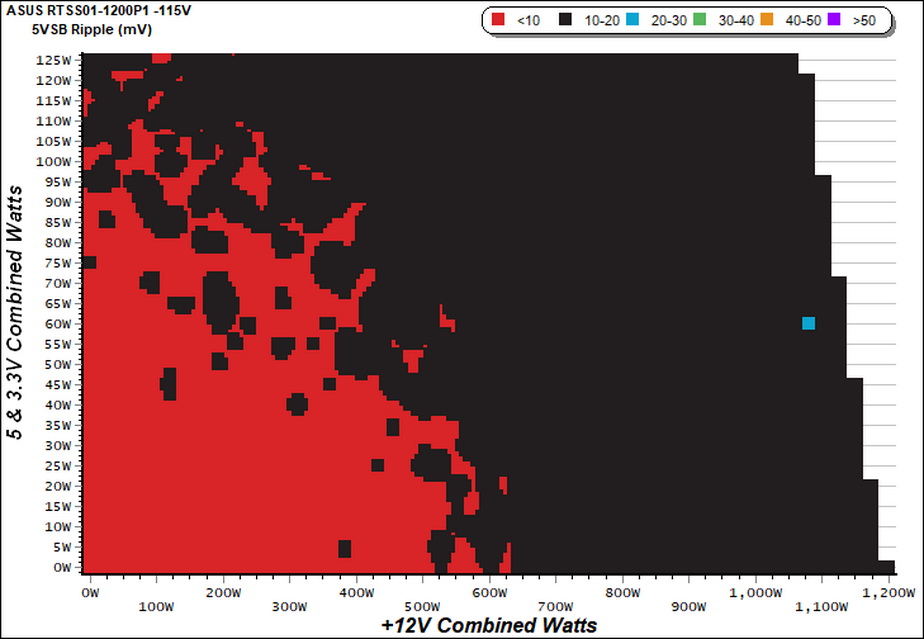
Ripple Charts
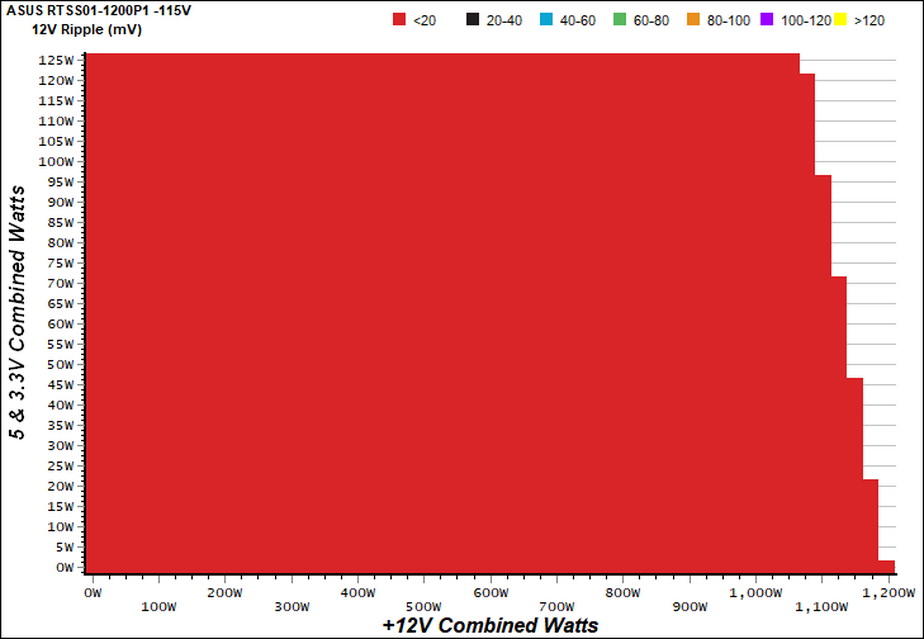
The lower the power supply's ripple the more stable the system will be and less stress will be also applied to its components.
Infrared Images
We apply a half-load for 10 minutes with the PSU's top cover and cooling fan removed before taking photos with a modified FLIR E4 camera able to deliver an IR resolution of 320x240 (76,800 pixels).
Get Tom's Hardware's best news and in-depth reviews, straight to your inbox.
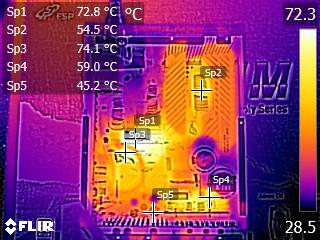
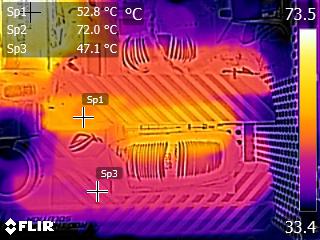
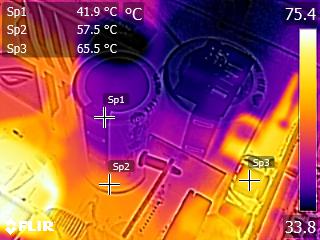
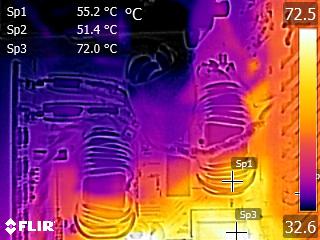
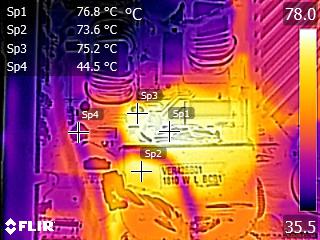
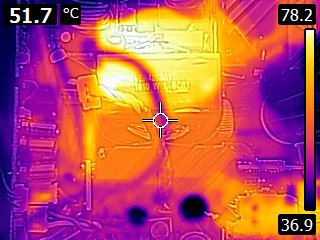
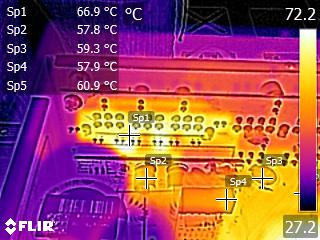
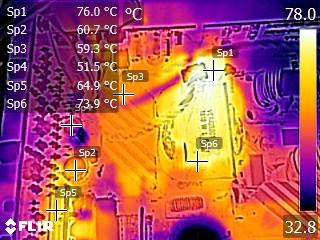
The temperatures are kept low in general here. However, there are some sensitive parts (capacitors) in the secondary side that get quite hot because they are installed close to circuits that generate increased thermal loads. For example, a polymer cap near the main transformer operates at 75 degrees C under the applied conditions. And although those caps are more tolerant to heat than electrolytic ones, such high temperatures are not ideal. A large electrolytic cap close to the modular board also gets fairly hot, at 61 degrees C. This is why the semi-passive operation doesn't last long even under normal ambient temperatures.
MORE: Best Power Supplies
MORE: How We Test Power Supplies
MORE: All Power Supply Content
Current page: Protection Features, DC Power Sequencing, Cross-Load Tests and Infrared Images
Prev Page Load Regulation, Hold-Up Time, Inrush Current, Efficiency and Noise Next Page Transient Response Tests, Ripple Measurements and EMC Pre-Compliance Testing
Aris Mpitziopoulos is a contributing editor at Tom's Hardware, covering PSUs.
