Corsair CX650M PSU Review
Corsair's CX series consists of both non-modular and semi-modular units. It was recently upgraded with new members and improved versions of older ones. The CX650M is the third strongest member of the line, featuring 650W capacity and a 40°C rating.
Why you can trust Tom's Hardware
Cross-Load Tests And Infrared Images
Our cross-load tests are described in detail here.
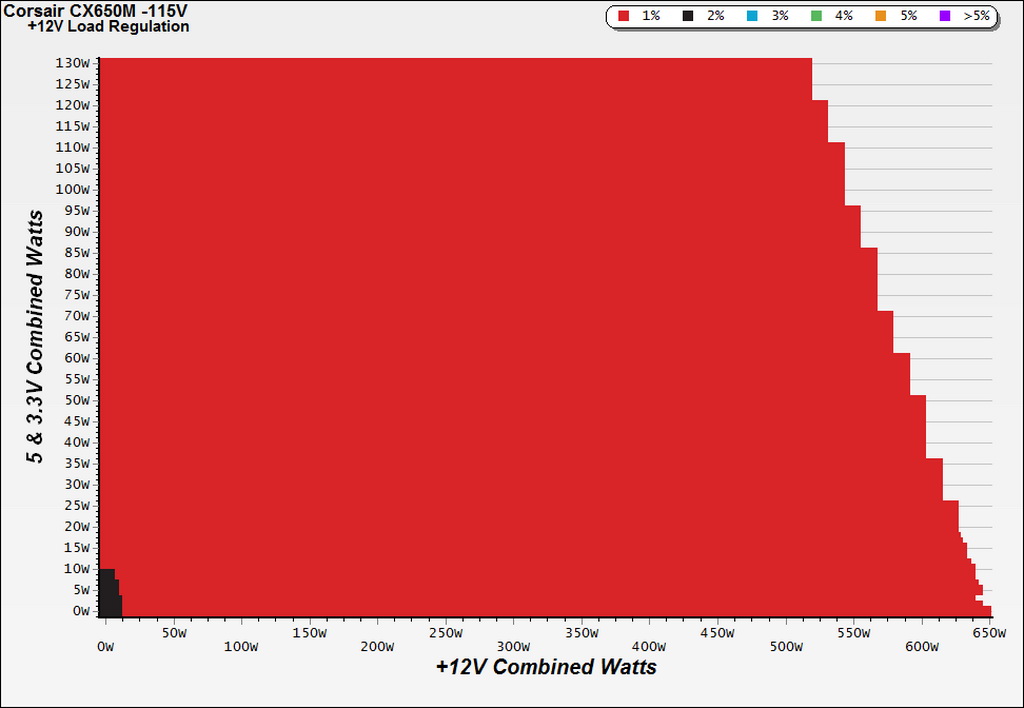
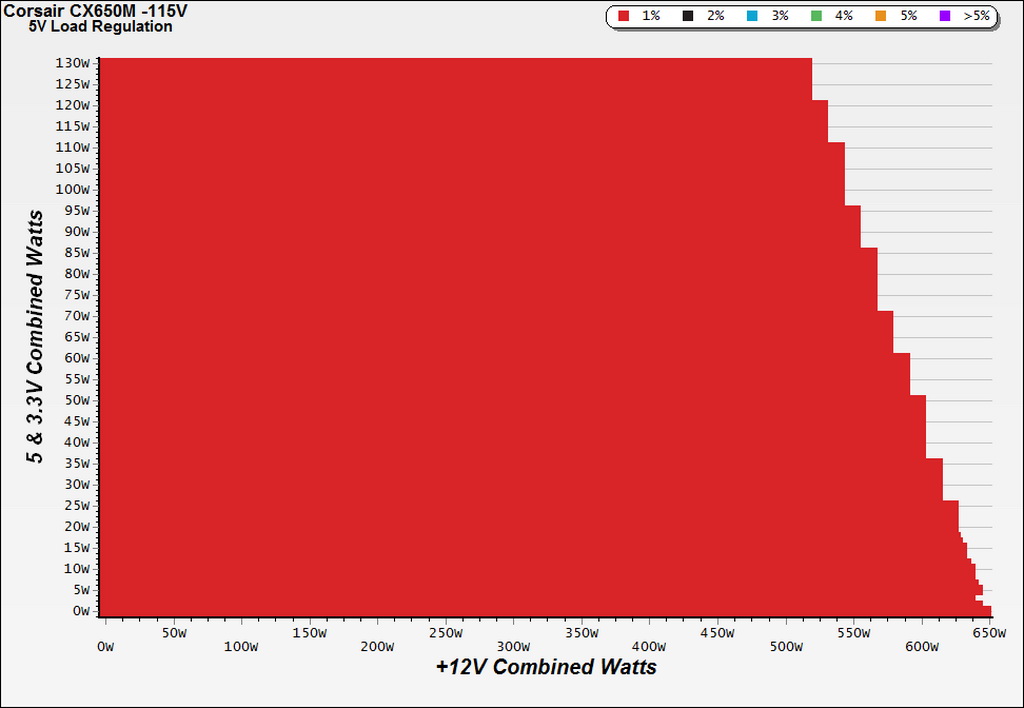
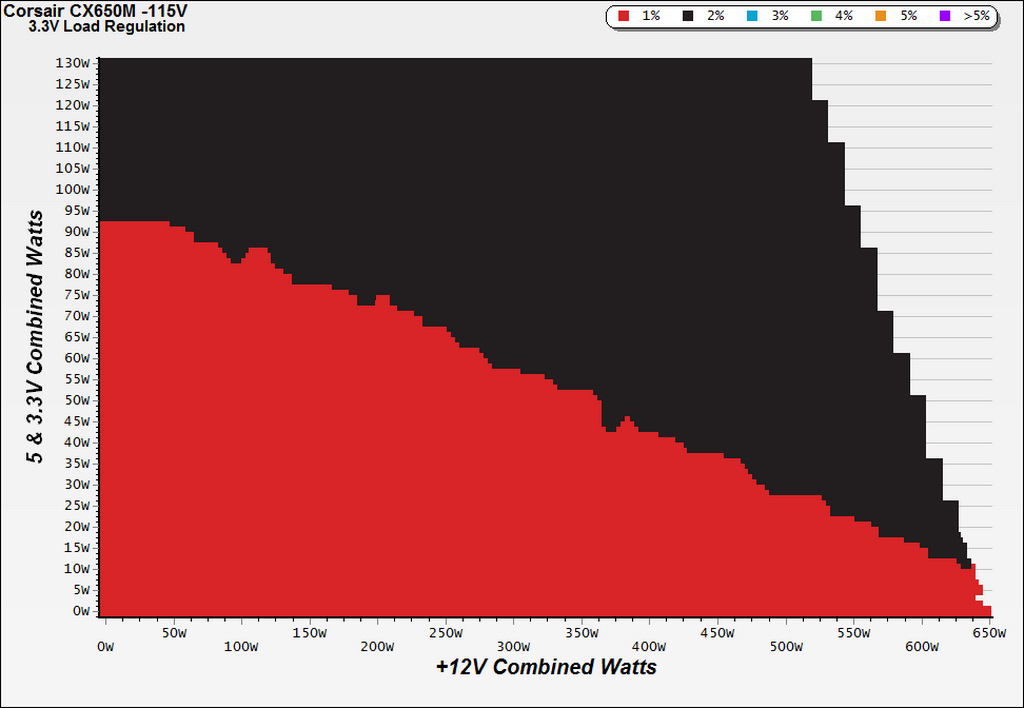
To generate the following charts, we set our loaders to auto mode through our custom-made software before trying more than 25,000 possible load combinations with the +12V, 5V, and 3.3V rails. The load regulation deviations in each of the charts below were calculated by taking the nominal values of the rails (12V, 5V, and 3.3V) as point zero.
Load Regulation Charts
Efficiency Chart
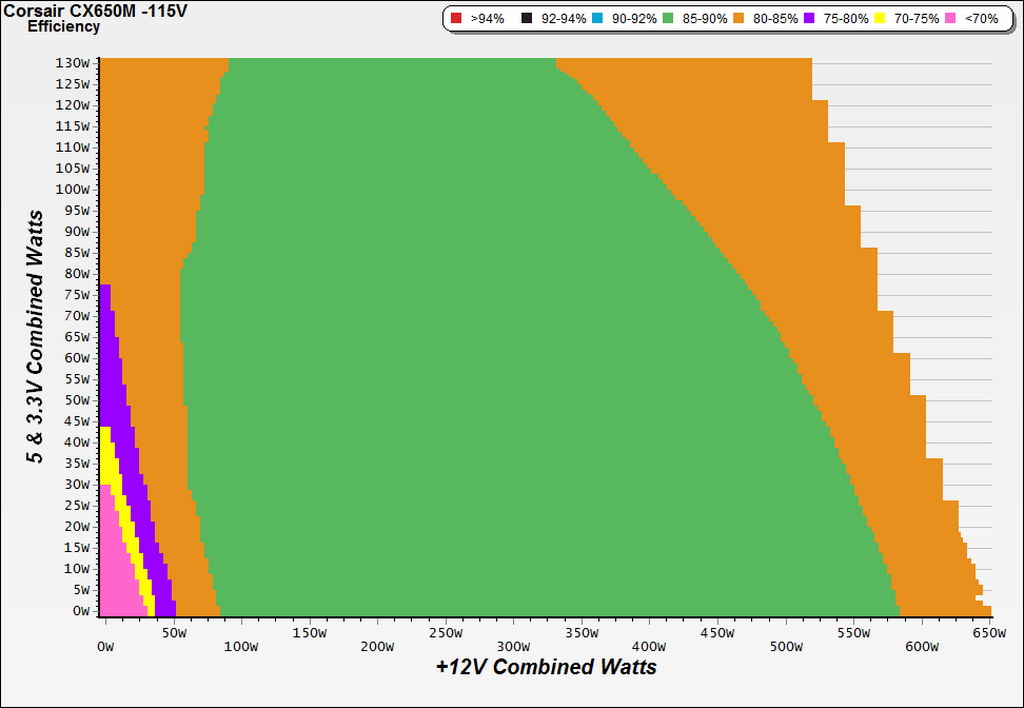
For a Bronze-class power supply, the efficiency graph is pretty good. In the 90 to 590W region, efficiency is higher than 85%. That's 100% satisfactory for a PSU that costs $65. If you need higher efficiency, you'll have to spend more for an 80 PLUS Gold or Platinum model. Or, if you're prepared to pay a premium for Titanium-class efficiency, consider Seasonic's Prime 650W model.
Ripple Charts
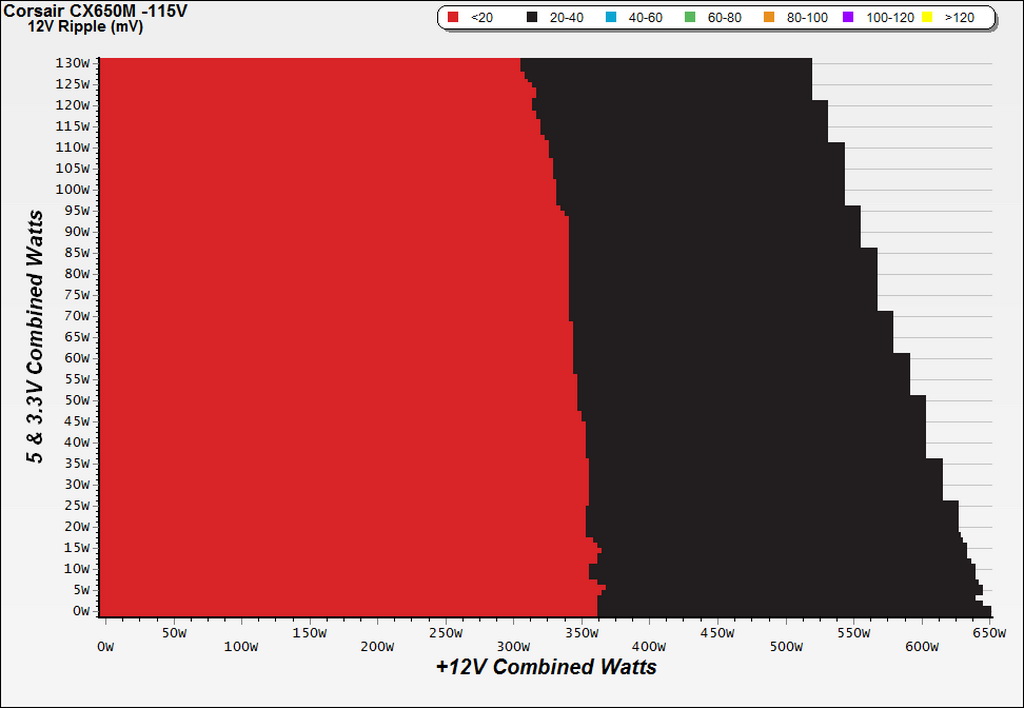
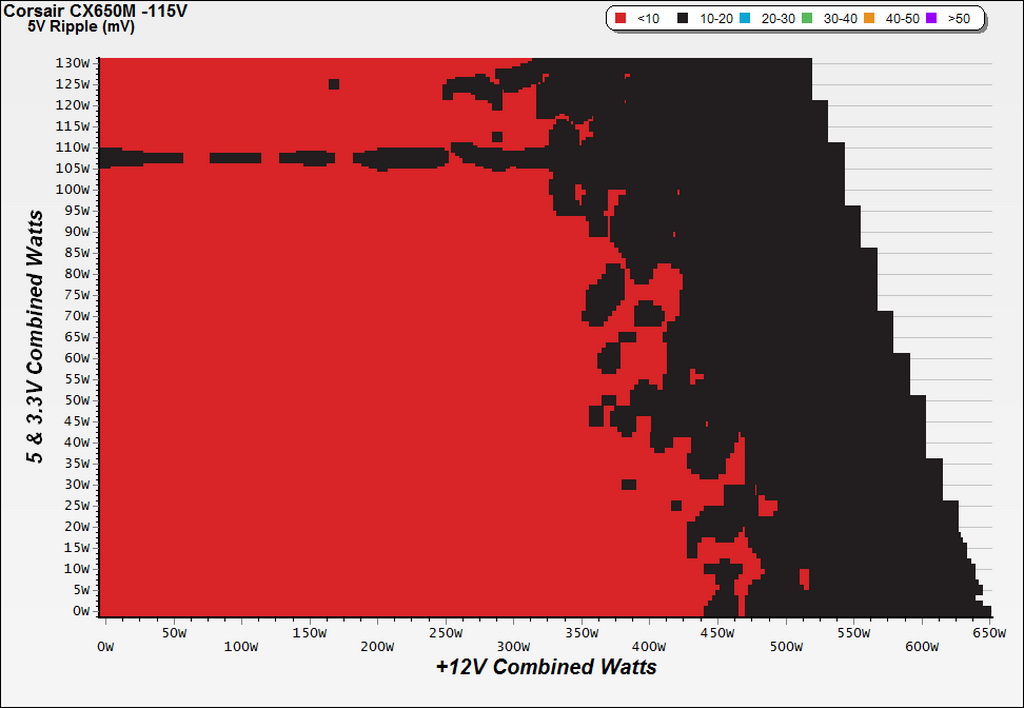
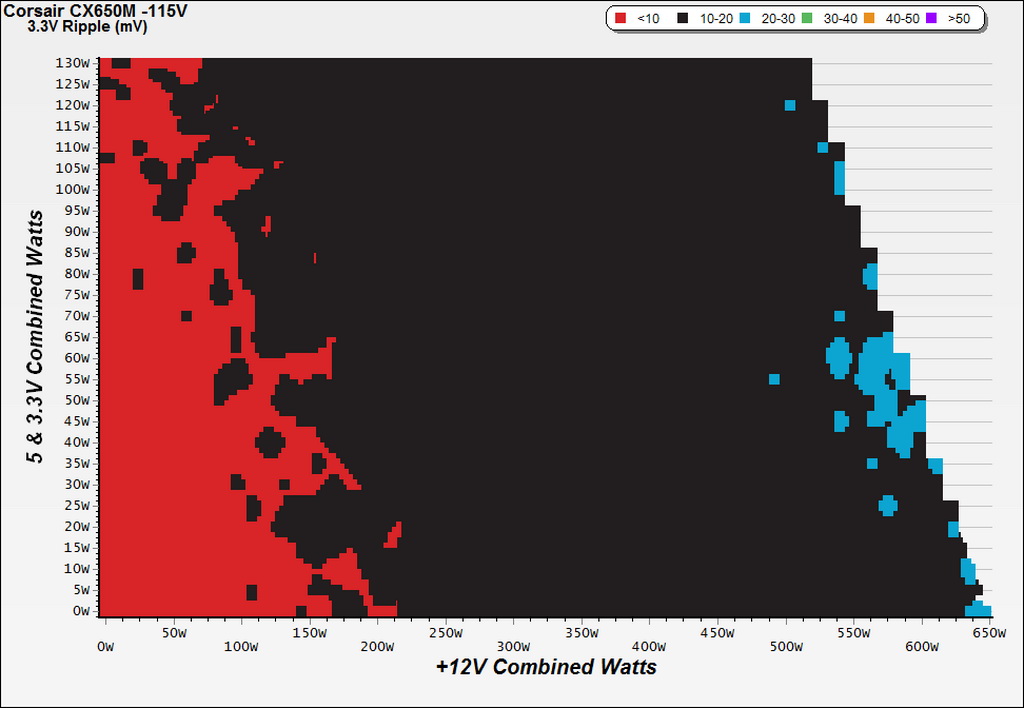
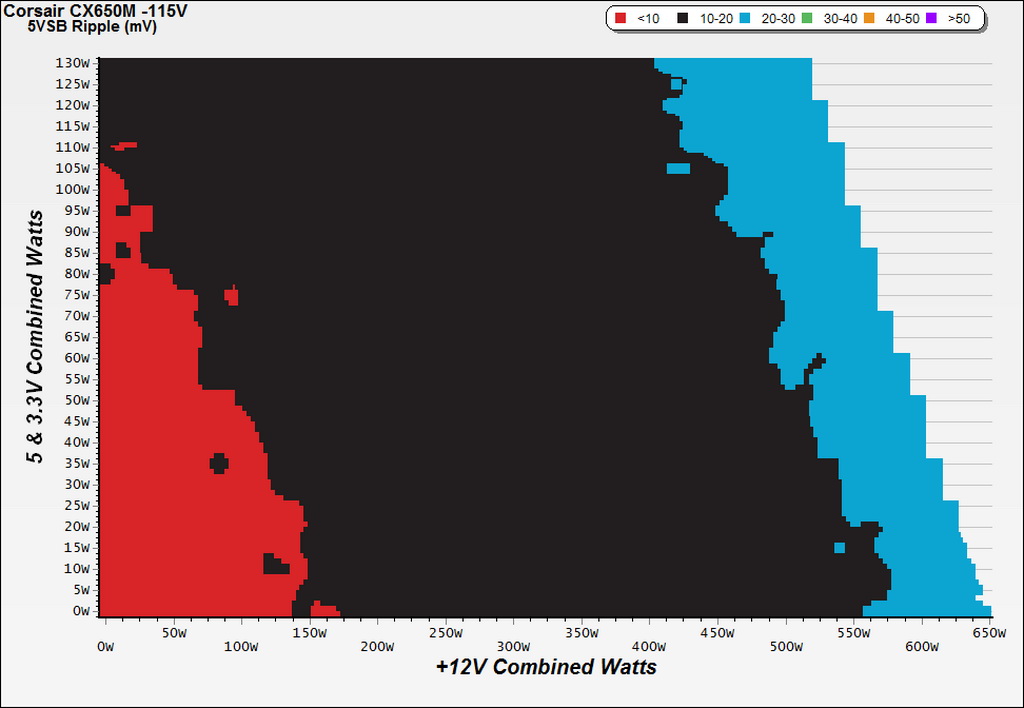
Infrared Images
Toward the end of the cross-load tests, we took some photos of the PSU with our modified FLIR E4 camera that delivers 320x240 IR resolution (76,800 pixels).
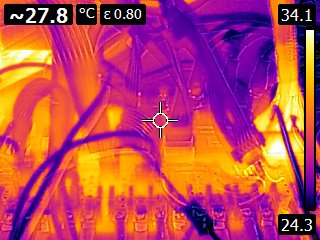
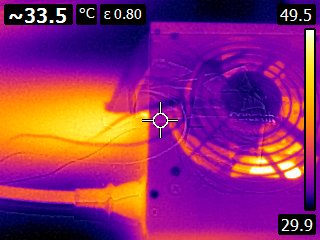
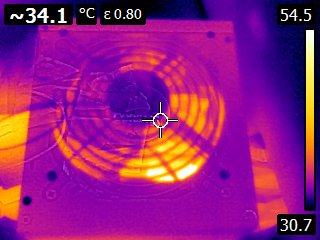
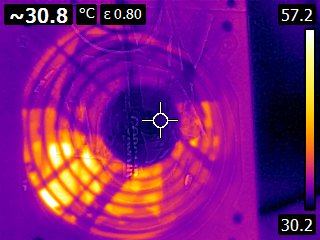
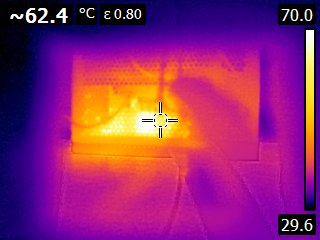
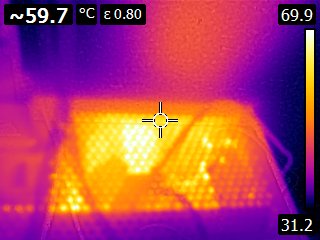
The temperature levels inside the CX650M are much lower than we expected. Obviously the thermal loads are lower than other Bronze-rated PSUs and the cooling fan does a pretty good job.
Get Tom's Hardware's best news and in-depth reviews, straight to your inbox.
Current page: Cross-Load Tests And Infrared Images
Prev Page Protection Features, Evaluated Next Page Transient Response Tests
Aris Mpitziopoulos is a contributing editor at Tom's Hardware, covering PSUs.
-
turkey3_scratch Onus why would Corsair produce me?Reply
Anyway I think the price/performance page shows all. This thing rocks!
Also Jonnyguru claims it is a rifle bearing fan that has the same model # as the sleeve variant. -
benedict78 Does the CX650 perform the same as the CX650M? I'm not interested in modularity anyway.Reply -
Aris_Mp I have several CM and CX-M units, which I plan to fully evaluate. So far I figured that there are differences (something natural of course) in their performance.Reply -
Dark Lord of Tech Could you put the newer CXM 750W OR 850W on deck soon , as they are widely use for DUAL CARD configurations.Reply -
turkey3_scratch The 750W and 850W CXM units are basically unchanged except for a bridge rectifier upgrade. Everything else is the same. Only the CX450-650M got the major revisions.Reply -
Dark Lord of Tech Yeah I know that , but want to see one reviewed , to compare top older generations.Reply
