Corsair VS650 Power Supply Review: Affordable Yet Capable
Why you can trust Tom's Hardware
Protection Features, DC Power Sequencing, Cross-Load Tests and Infrared Images
Protection Features
Check out our PSUs 101 article to learn more about PSU protection features.
| Protection Features | |
| OCP | 12V: >69A (>132.69%), <11.076V 5V: 22A (110%), 4.391V 3.3V: 28.5A (118.75%), 3.32V 5VSB: 4.6A (153.33%), 4.943V |
| OPP | >841.3W (>129.43%) |
| OTP | ✓ (157°C @ 12V Heat Sink) |
| SCP | 12V: ✓ 5V: ✓ 3.3V: ✓ 5VSB: ✓ -12V: ✓ |
| PWR_OK | Proper Operation (<16ms) |
| NLO | ✓ |
| SIP | Surge: MOV Inrush: 2x NTC Thermistors |
The over current protection at +12V is not properly set, since it allows this rail to drop close to 11.1V and still the PSU is kept in operation instead of shutting down. We strongly suspect that the bogus +12V OCP setting is the reason behind the very over power protection triggering point; again the unit didn't shut down so we had to abort this test, to avoid a failure.
The rest protection features are present and work well. It is nice to see over temperature protection in a budget power supply, since we believe that this is a crucial protection. The majority of PSU failures is due to high temperatures, so OTP is of high importance.
DC Power Sequencing
According to Intel’s most recent Power Supply Design Guide (revision 1.4), the +12V and 5V outputs must be equal to or greater than the 3.3V rail at all times. Unfortunately, Intel doesn't mention why it is so important to always keep the 3.3V rail's voltage lower, than the levels of the other two outputs.
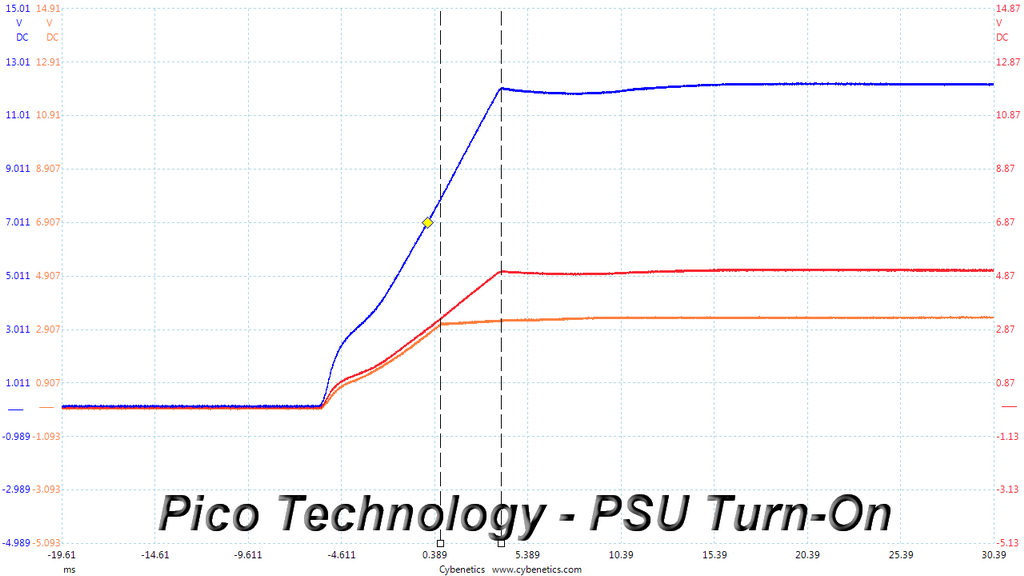
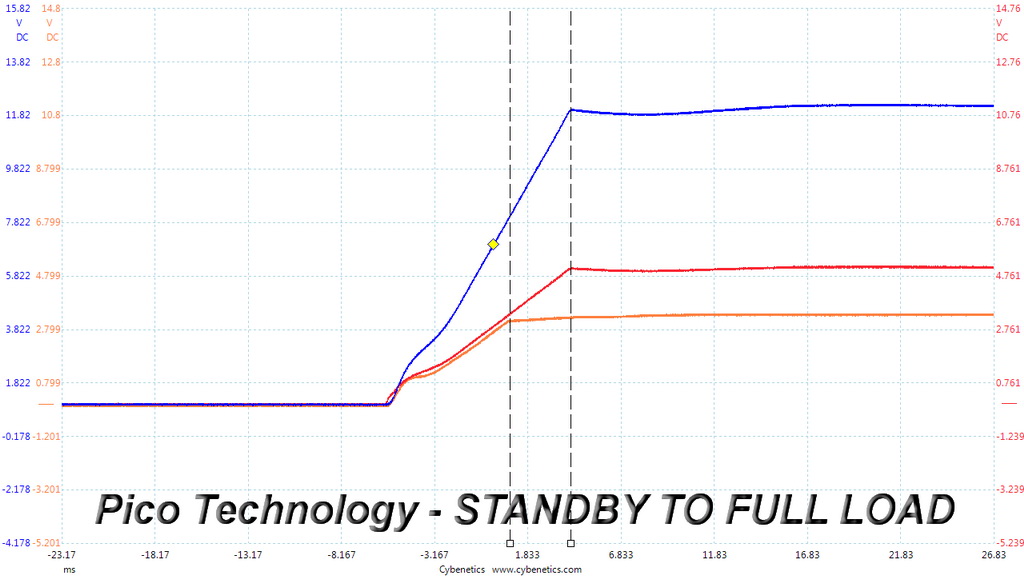
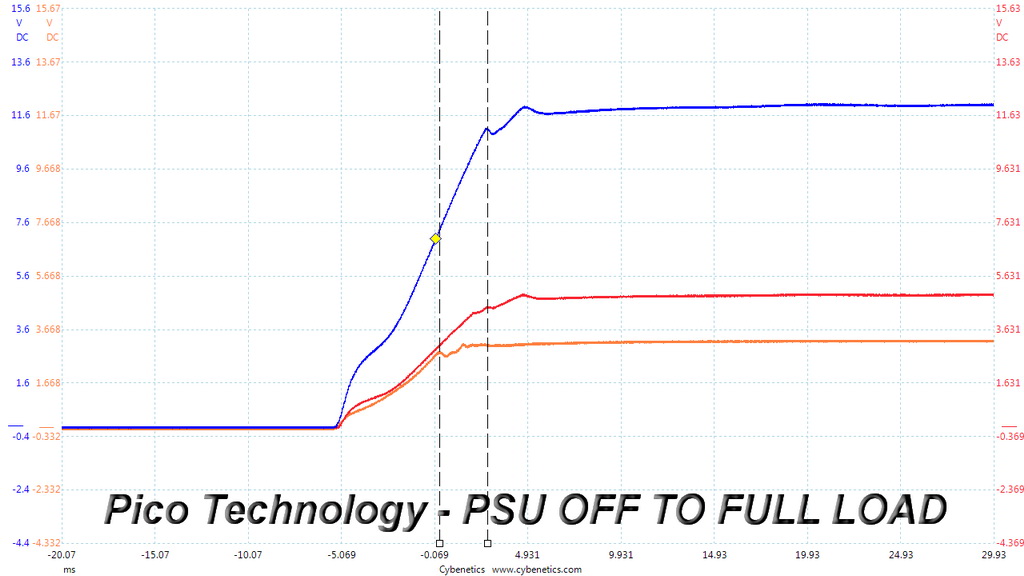
The 3.3V rail is always lower than 12V and 5V, so the VS650 passes these tests with success.
Cross Load Tests
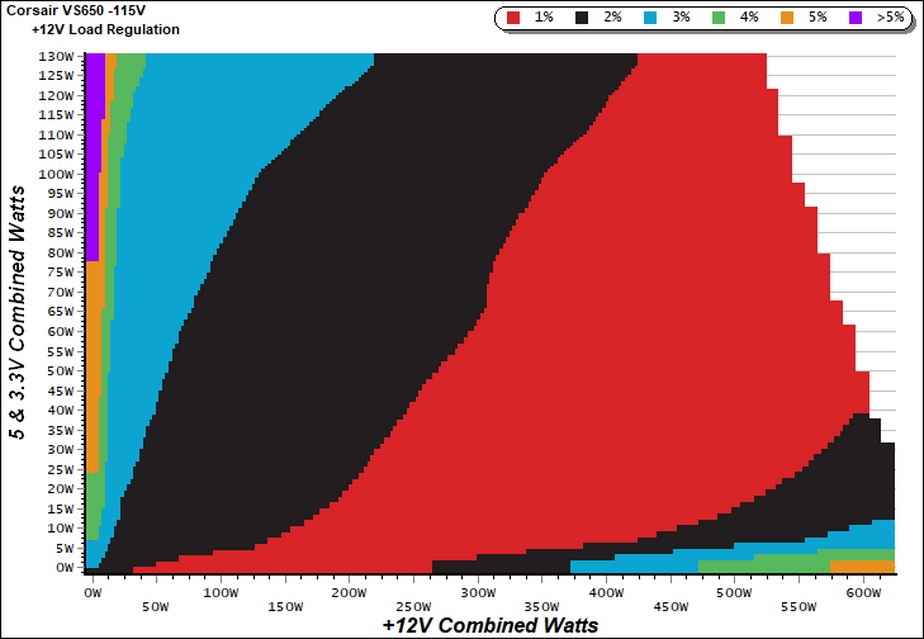
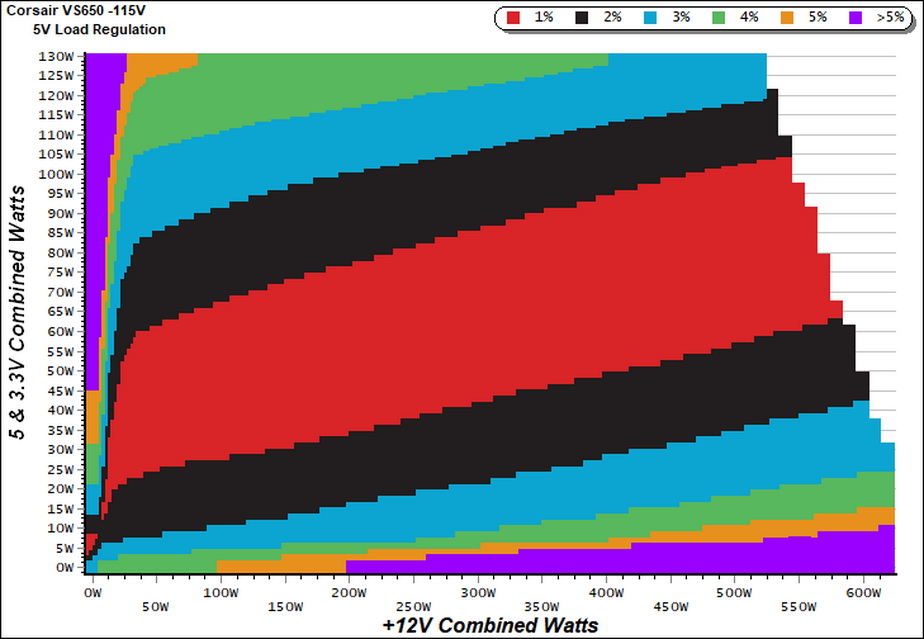
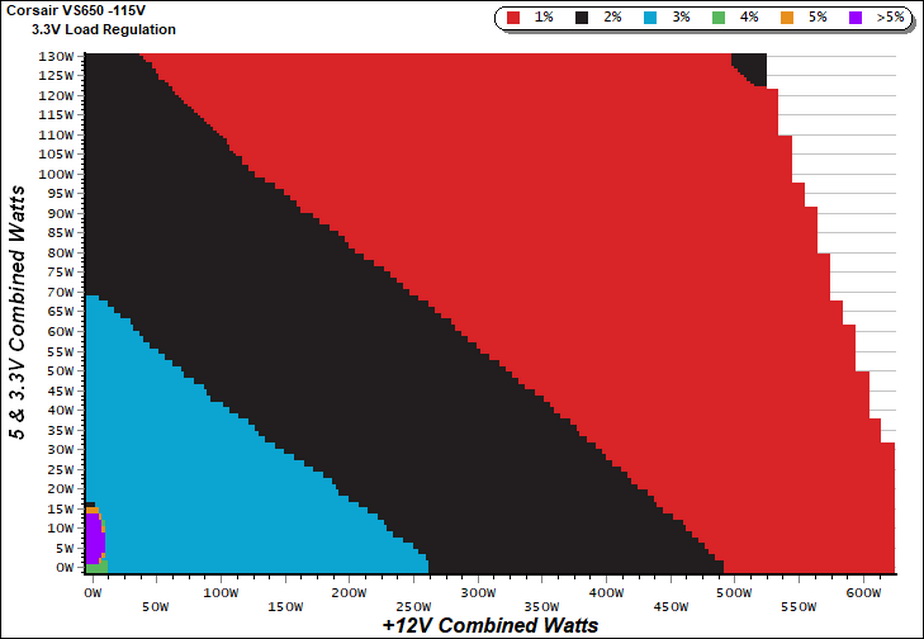
To generate the following charts, we set our loaders to auto mode through custom-made software before trying more than 25,000 possible load combinations with the +12V, 5V, and 3.3V rails. The deviations in each of the charts below are calculated by taking the nominal values of the rails (12V, 5V, and 3.3V) as point zero. The ambient temperature during testing was between 30°C (86°F) and 32°C (89.6°F).
Load Regulation Charts
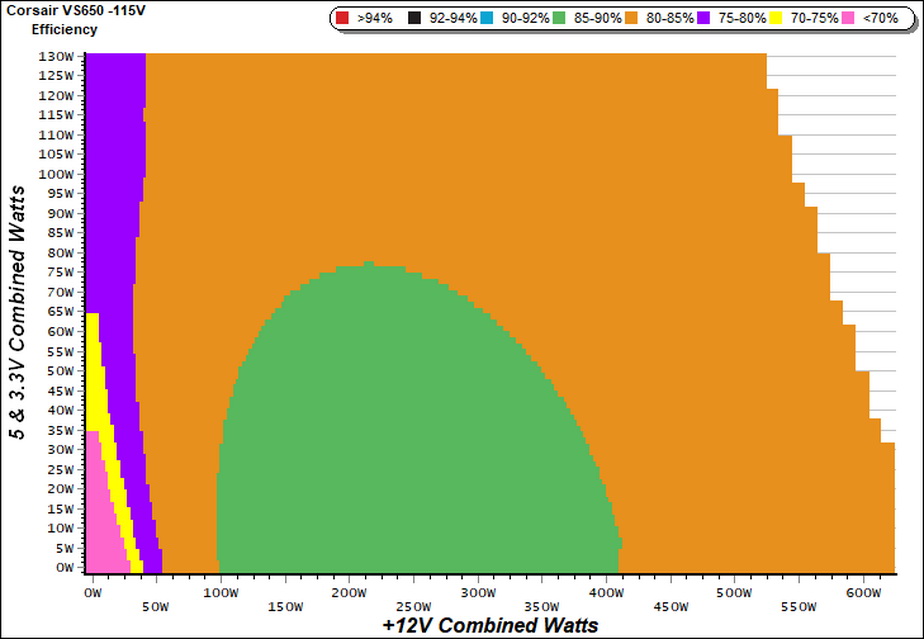
Efficiency Chart
The best efficiency region (85-90%) is from 100W to 400W, with the load on the minor rails staying below 75W. For the best part of its operation range the unit delivers 80-85% efficiency, which is pretty low for today's standards.
Get Tom's Hardware's best news and in-depth reviews, straight to your inbox.
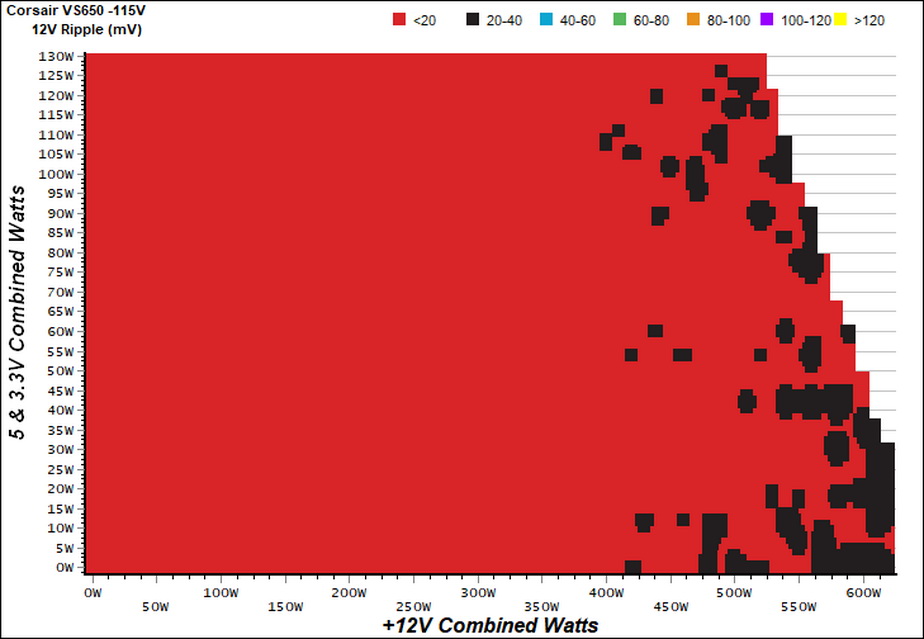
Ripple Charts
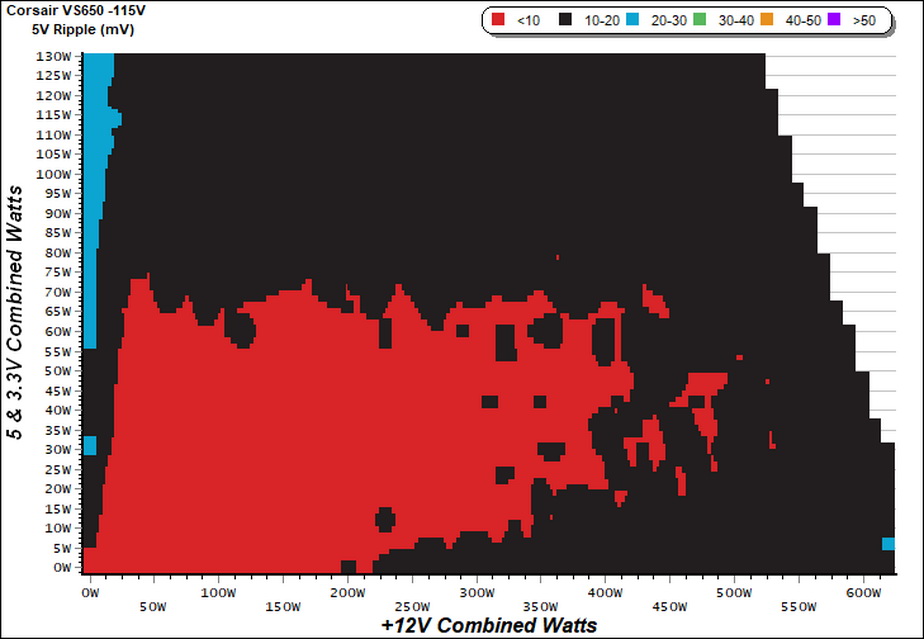
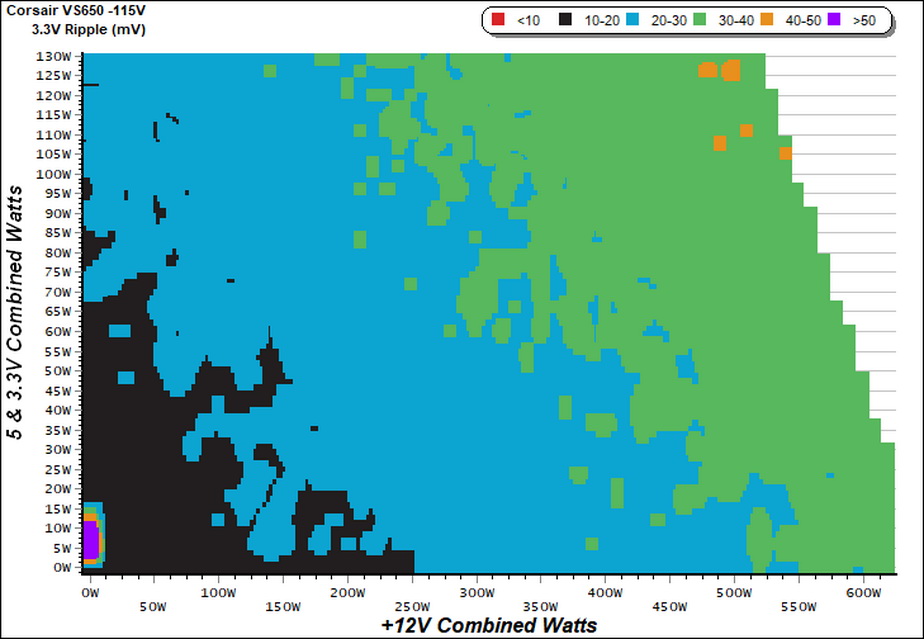
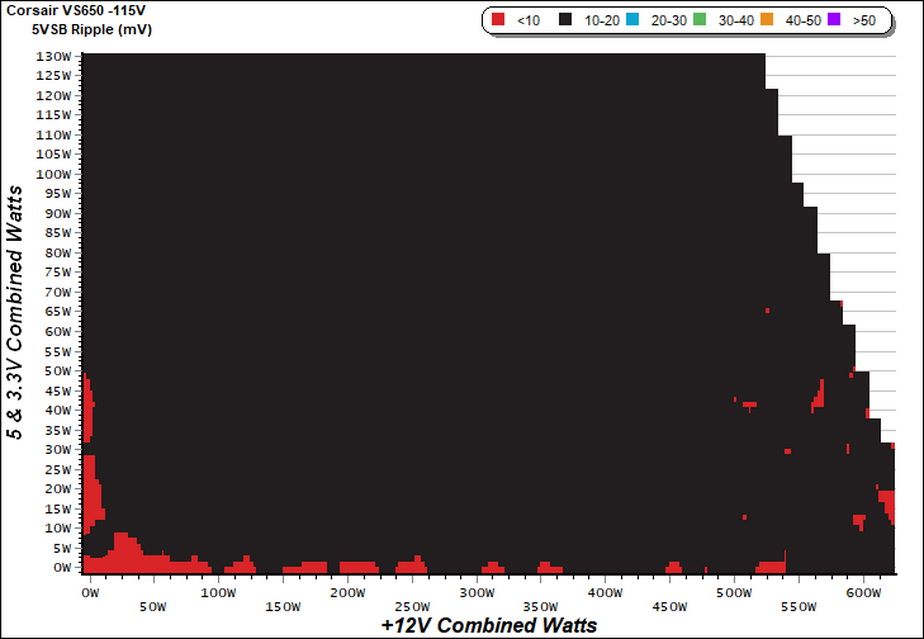
The lower the power supply's ripple the more stable the system will be and less stress will be also applied to its components.
Infrared Images
We apply a half-load for 10 minutes with the PSU's top cover and cooling fan removed before taking photos with a modified FLIR E4 camera able to deliver an IR resolution of 320x240 (76,800 pixels).
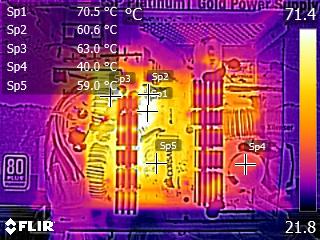
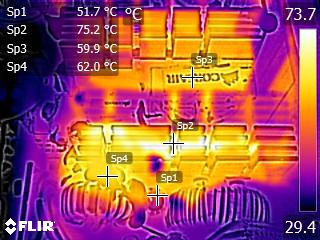
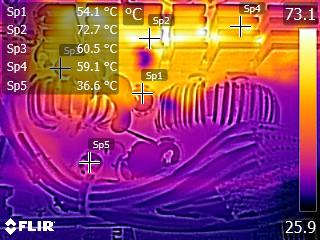
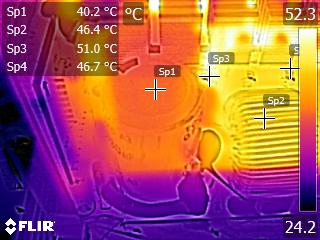
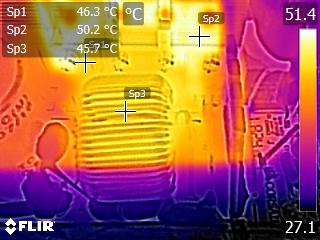
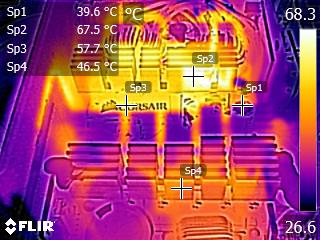
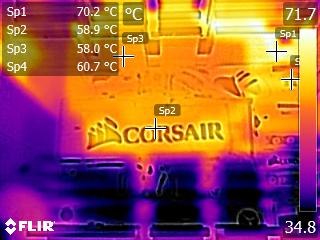
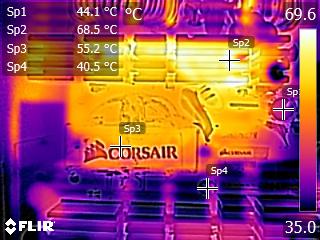
Despite the low efficiency, the VS650's platform doesn't get so hot with 50% of its max-rated output and with the cooling fan removed. This is why the fan profile is relaxed at lower loads.
MORE: Best Power Supplies
MORE: How We Test Power Supplies
MORE: All Power Supply Content
Current page: Protection Features, DC Power Sequencing, Cross-Load Tests and Infrared Images
Prev Page Load Regulation, Hold-Up Time, Inrush Current, Efficiency and Noise Next Page Transient Response Tests, Ripple Measurements and EMC Pre-Compliance Testing
Aris Mpitziopoulos is a contributing editor at Tom's Hardware, covering PSUs.
