Why you can trust Tom's Hardware
Protection Features
Check out our PSUs 101 article to learn more about PSU protection features.
|
OCP (Cold @ 24°C) | 12V: 119.6A (143.58%), 12.087V 5V: 32.8A (131.2%), 4.903V 3.3V: 32.5A (130%), 3.251V 5VSB: 6.2A (206.67%), 4.954V |
|
OCP (Hot @ 43°C) |
12V: 119.8A (143.82%), 12.101V |
|
OPP (Cold @ 25°C) |
1445.92W (144.59%) |
|
OPP (Hot @ 43°C) |
1449.96W (145%) |
|
OTP |
✓ (144°C @ 12V Heat Sink) |
|
SCP |
12V to Earth: ✓ |
|
PWR_OK |
Proper operation |
|
NLO |
✓ |
|
SIP |
Surge: MOV |
This PSU is supposed to have two different OPP triggering points. Nonetheless, we only managed to trigger one of them, most likely the one that EVGA calls hardware OPP, although we raise the load slowly during OCP and OPP evaluation. OCP is adequately set on the minor rails, but it is quite high at 12V. OPP has a high triggering point, too. Most likely, EVGA wanted to make sure that no power spike could shut down this unit.
DC Power Sequencing
According to Intel’s most recent Power Supply Design Guide (revision 1.4), the +12V and 5V outputs must be equal to or greater than the 3.3V rail at all times. Unfortunately, Intel doesn't mention why it is so important to always keep the 3.3V rail's voltage lower than the levels of the other two outputs.
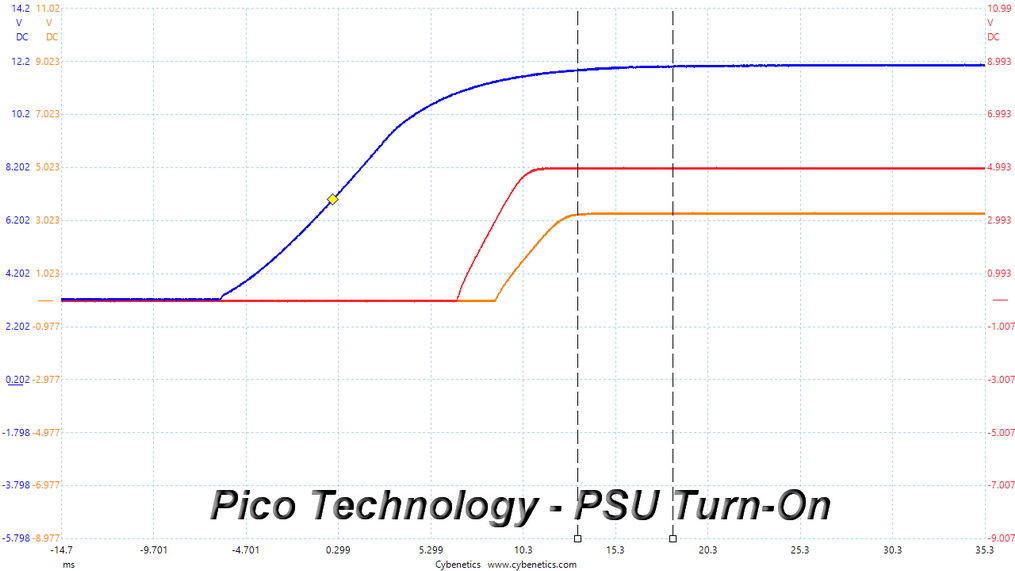
DC Power Sequencing Scope Shots
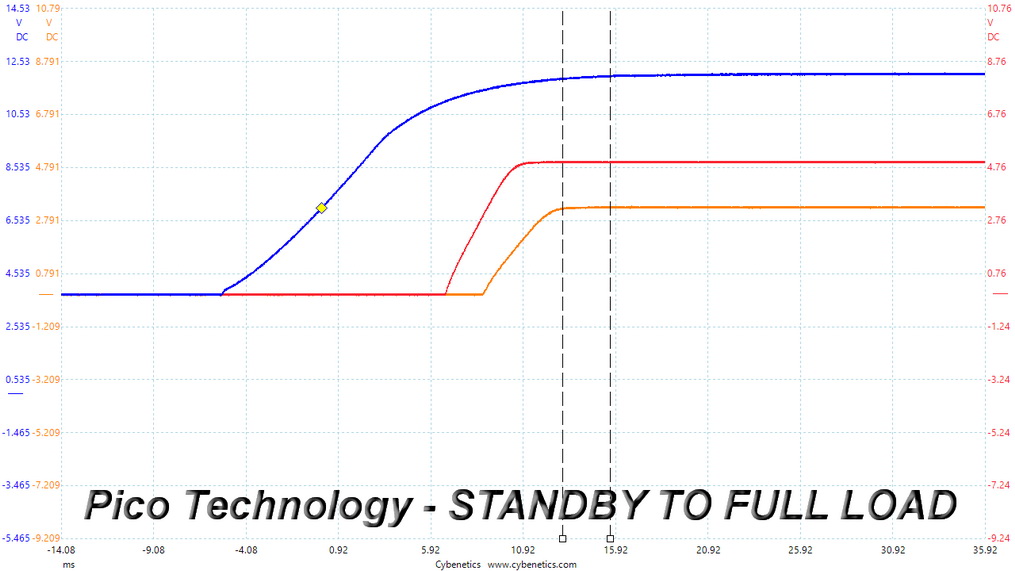
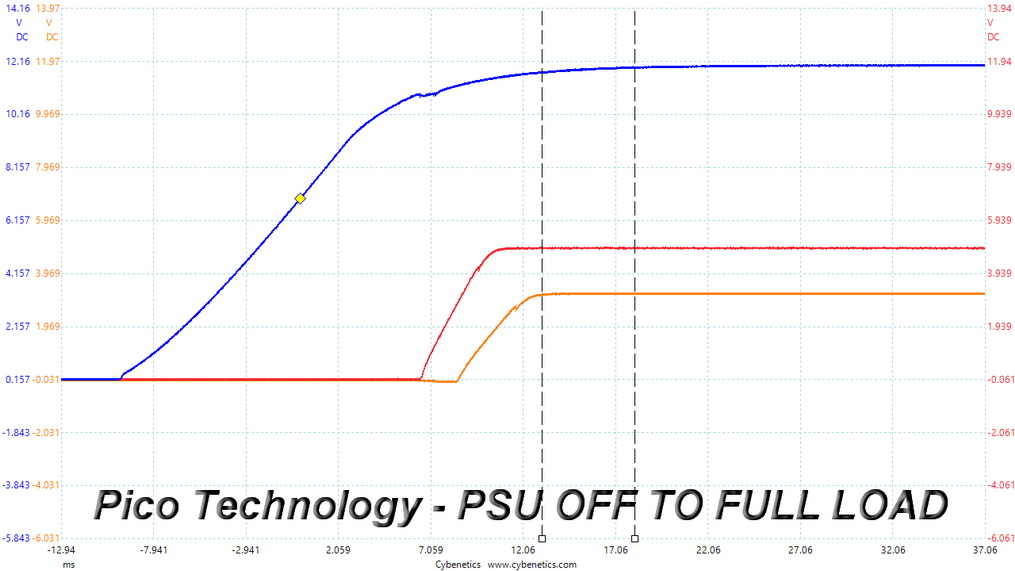
There are no problems here, since the 3.3V rail is always at a lower voltage level than the other two rails.
Cross Load Tests
To generate the following charts, we set our loaders to auto mode through custom-made software before trying more than 25,000 possible load combinations with the +12V, 5V, and 3.3V rails. The deviations in each of the charts below are calculated by taking the nominal values of the rails (12V, 5V, and 3.3V) as point zero. The ambient temperature during testing was between 30 to 32 degrees Celsius (86 to 89.6 degrees Fahrenheit).
Load Regulation Charts
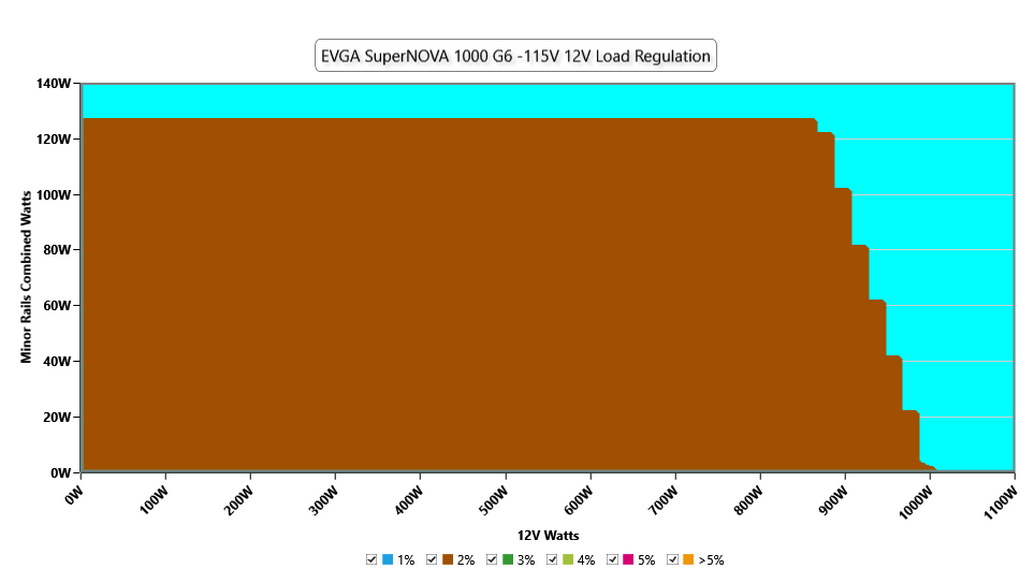
Load Regulation Graphs
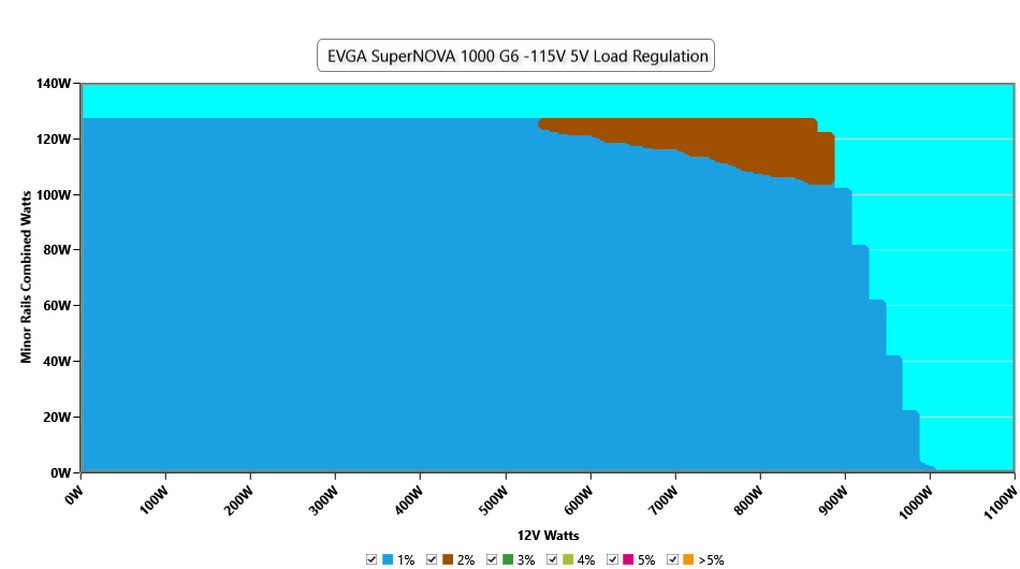
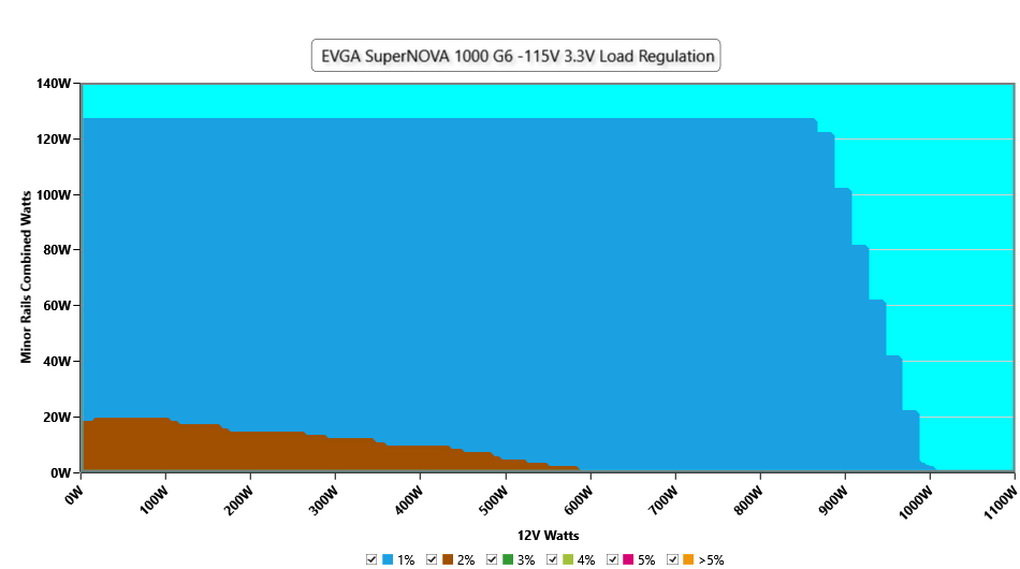
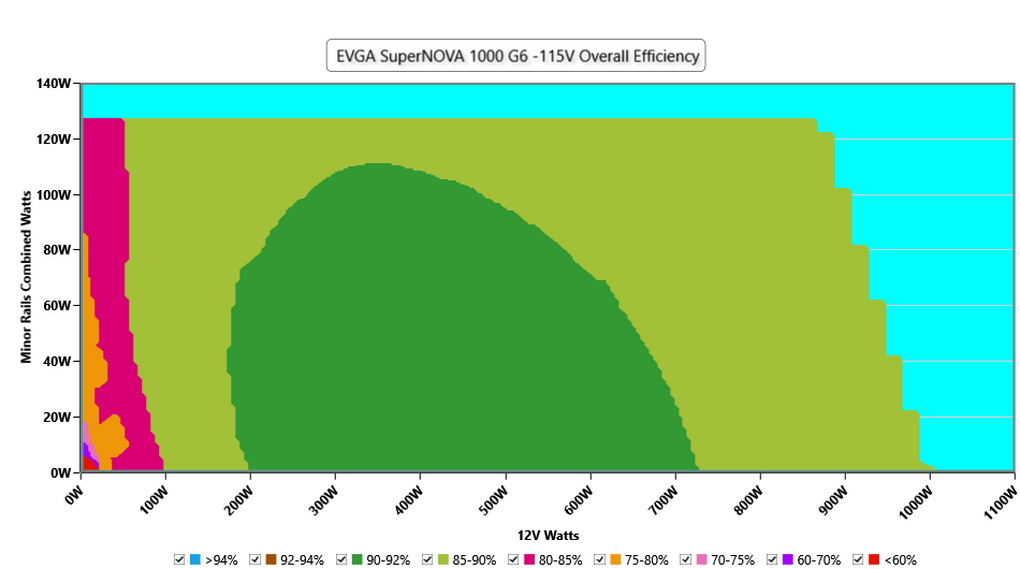
Efficiency Graph
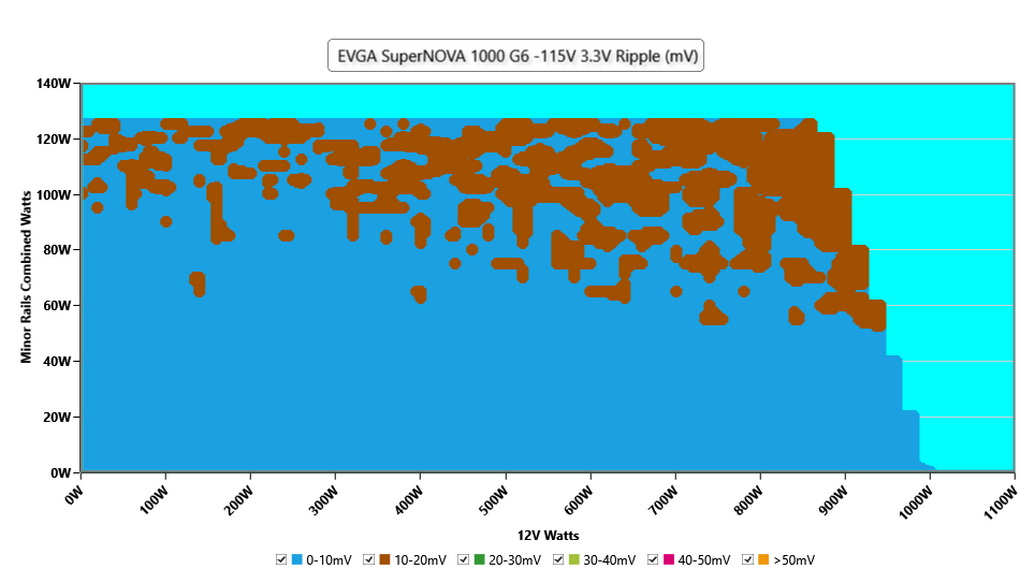
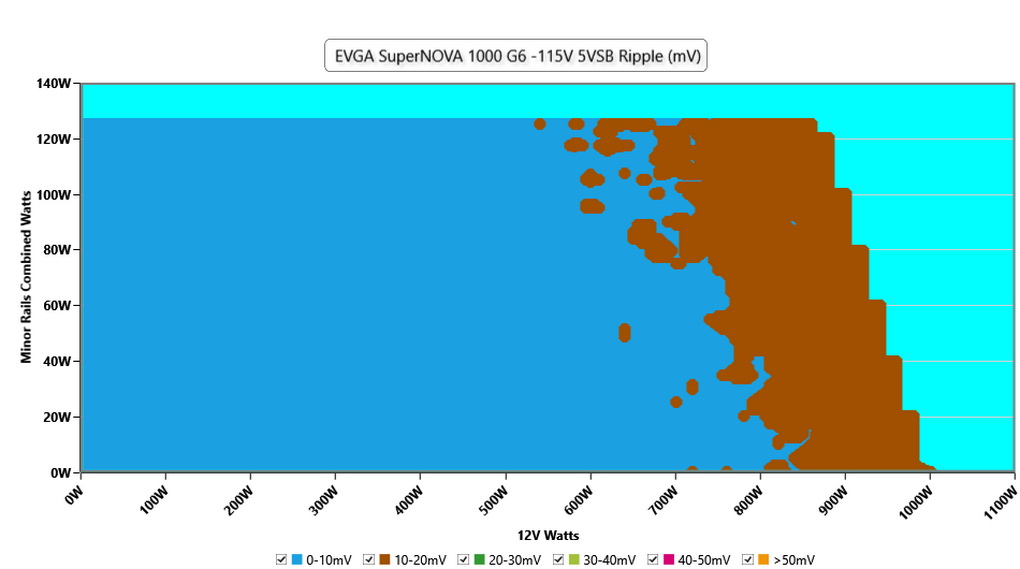
Ripple Graphs
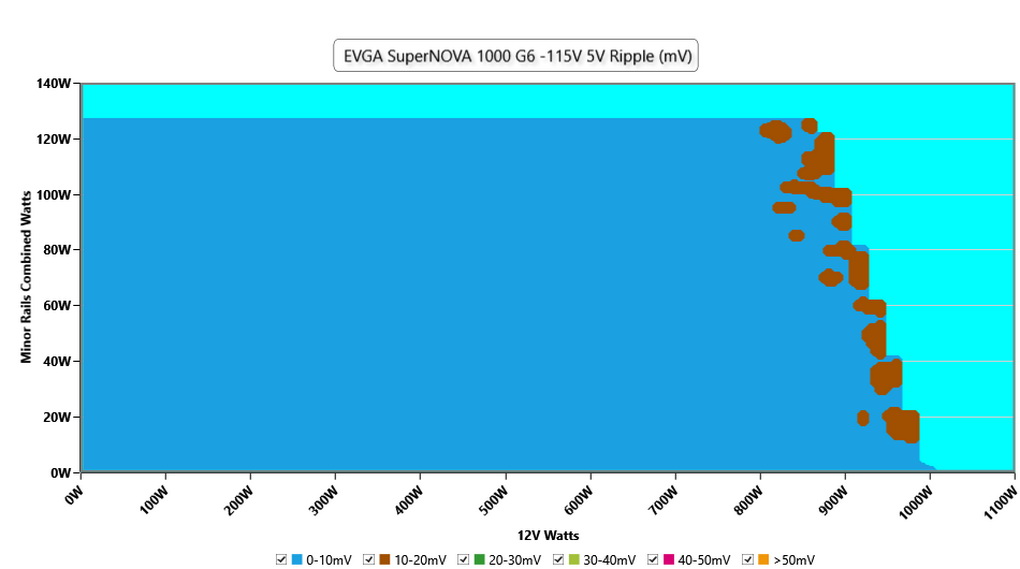
The lower the power supply's ripple, the more stable the system. Less stress will also be applied to its components.

Ripple Suppression Graphs
Infrared Images
We apply a half-load for 10 minutes with the PSU's top cover and cooling fan removed before taking photos with a modified FLIR E4 camera able to deliver an IR resolution of 320x240 (76,800 pixels).
Get Tom's Hardware's best news and in-depth reviews, straight to your inbox.
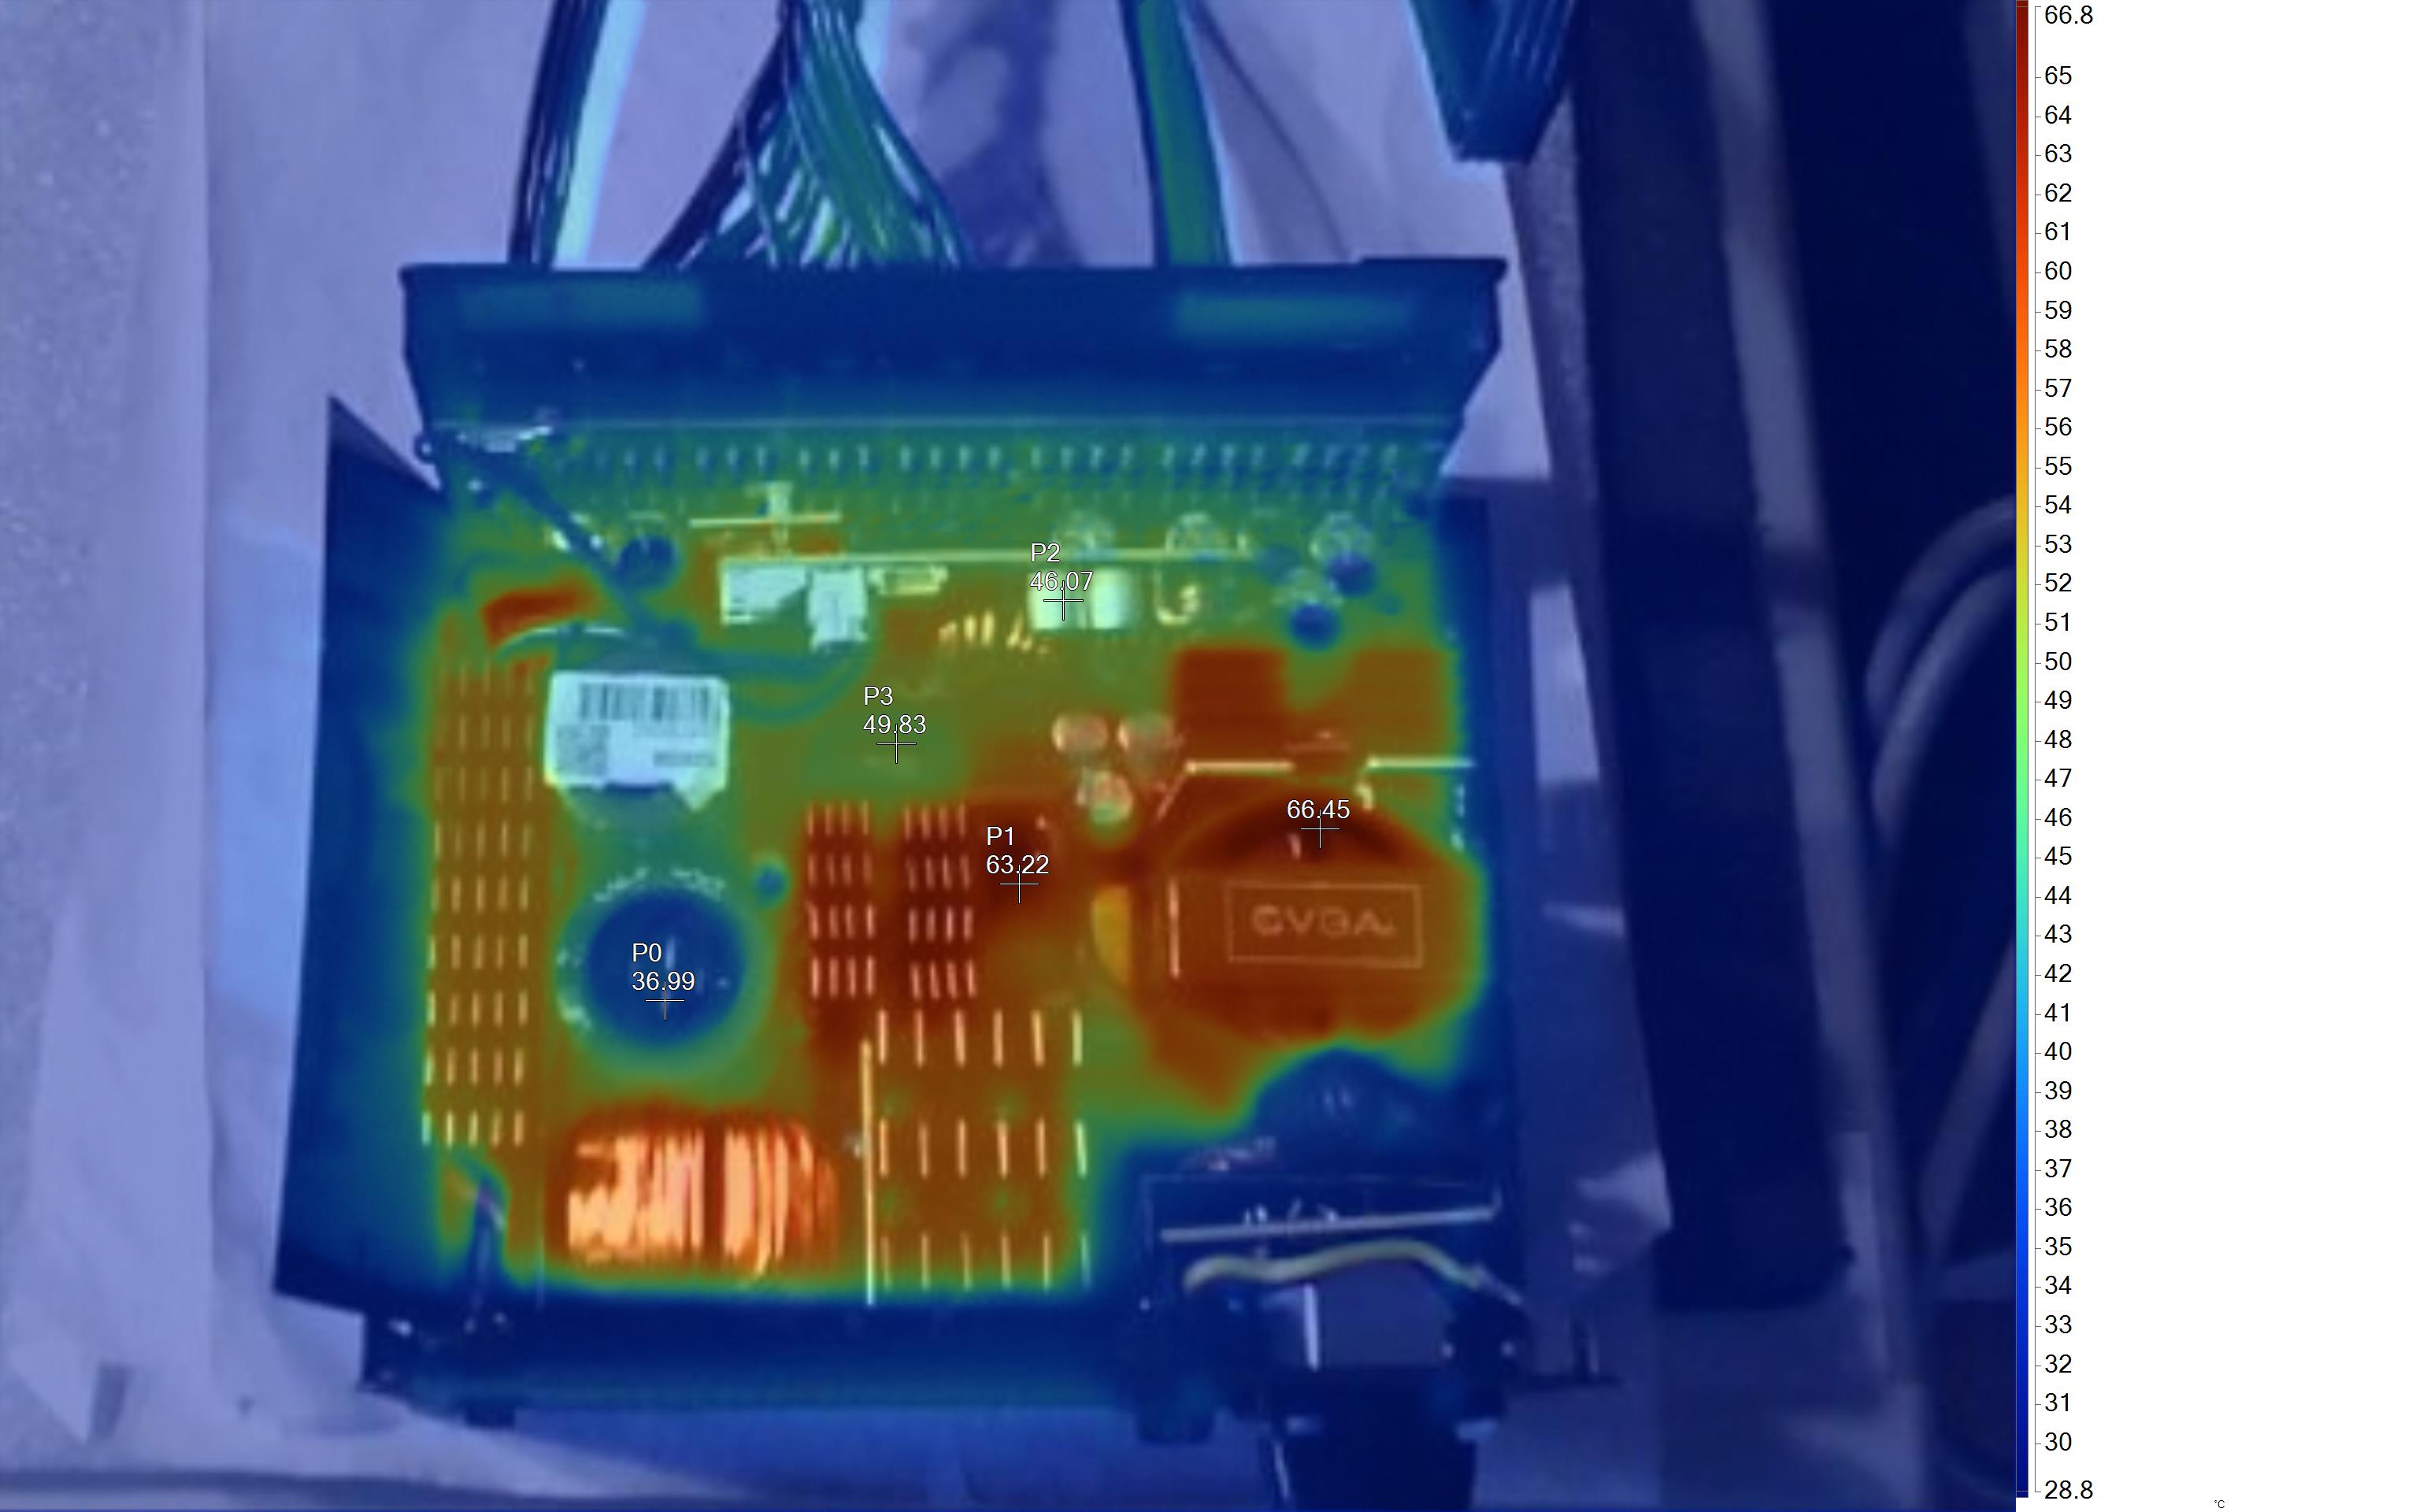
IR Images
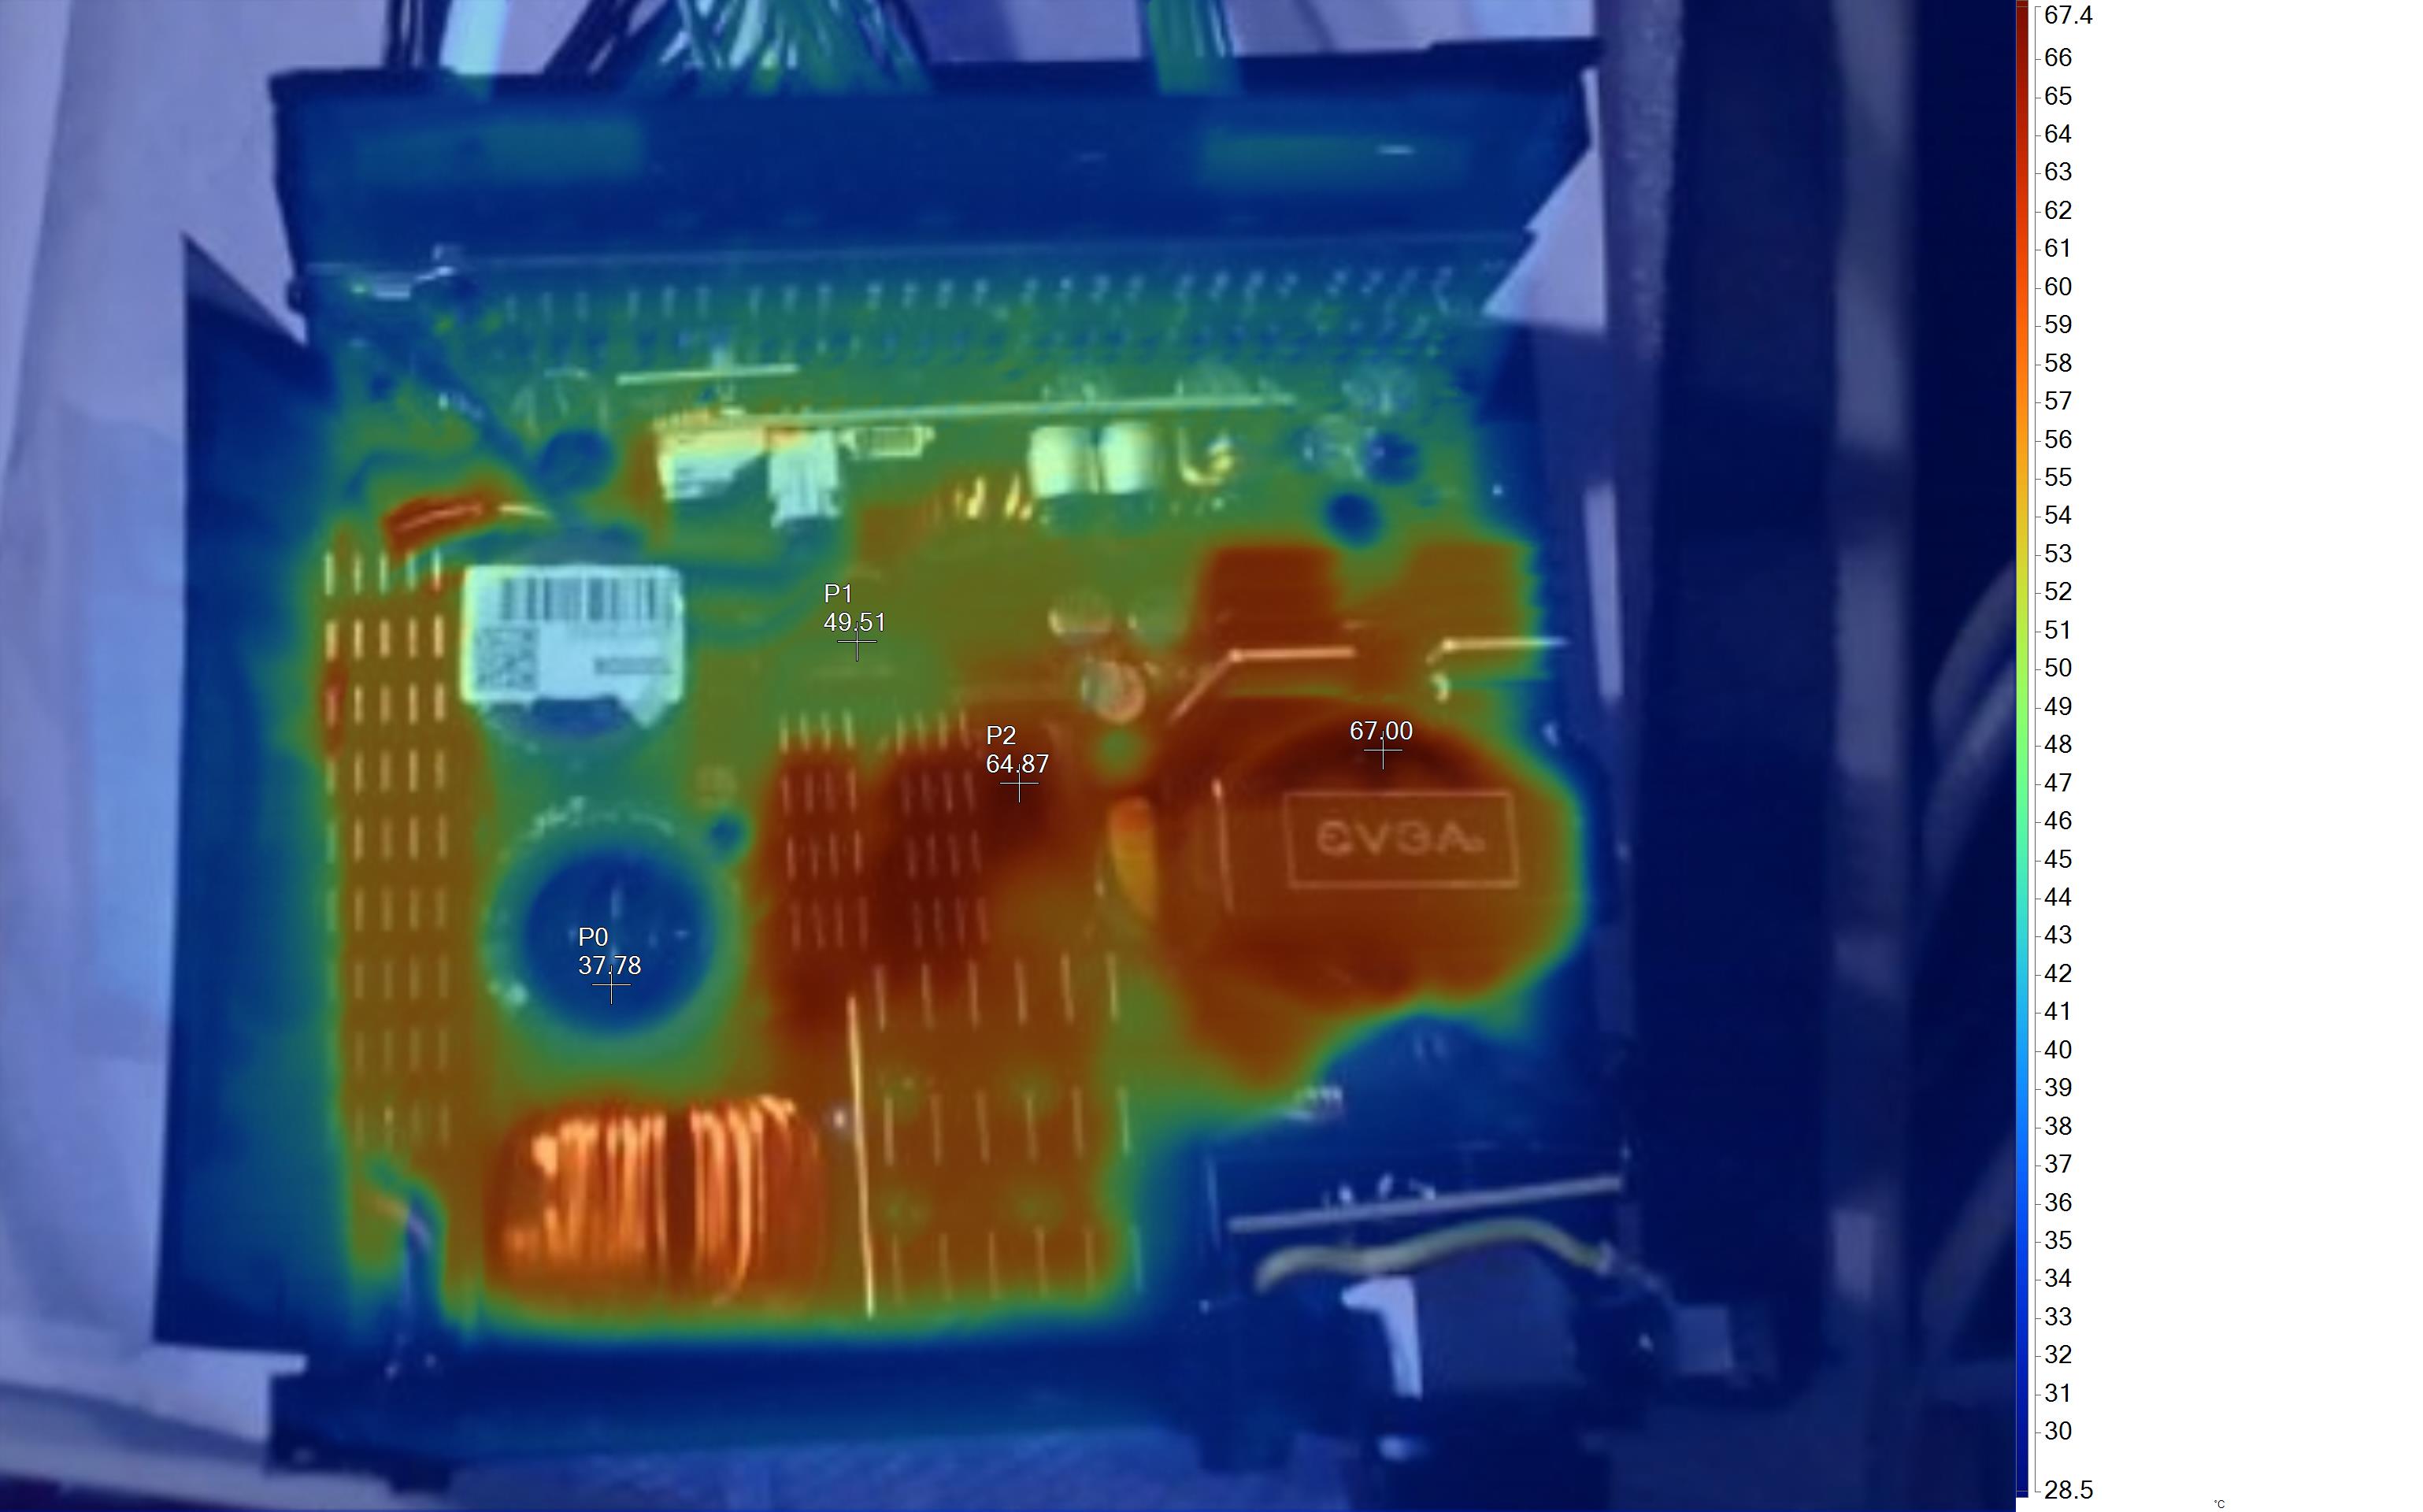
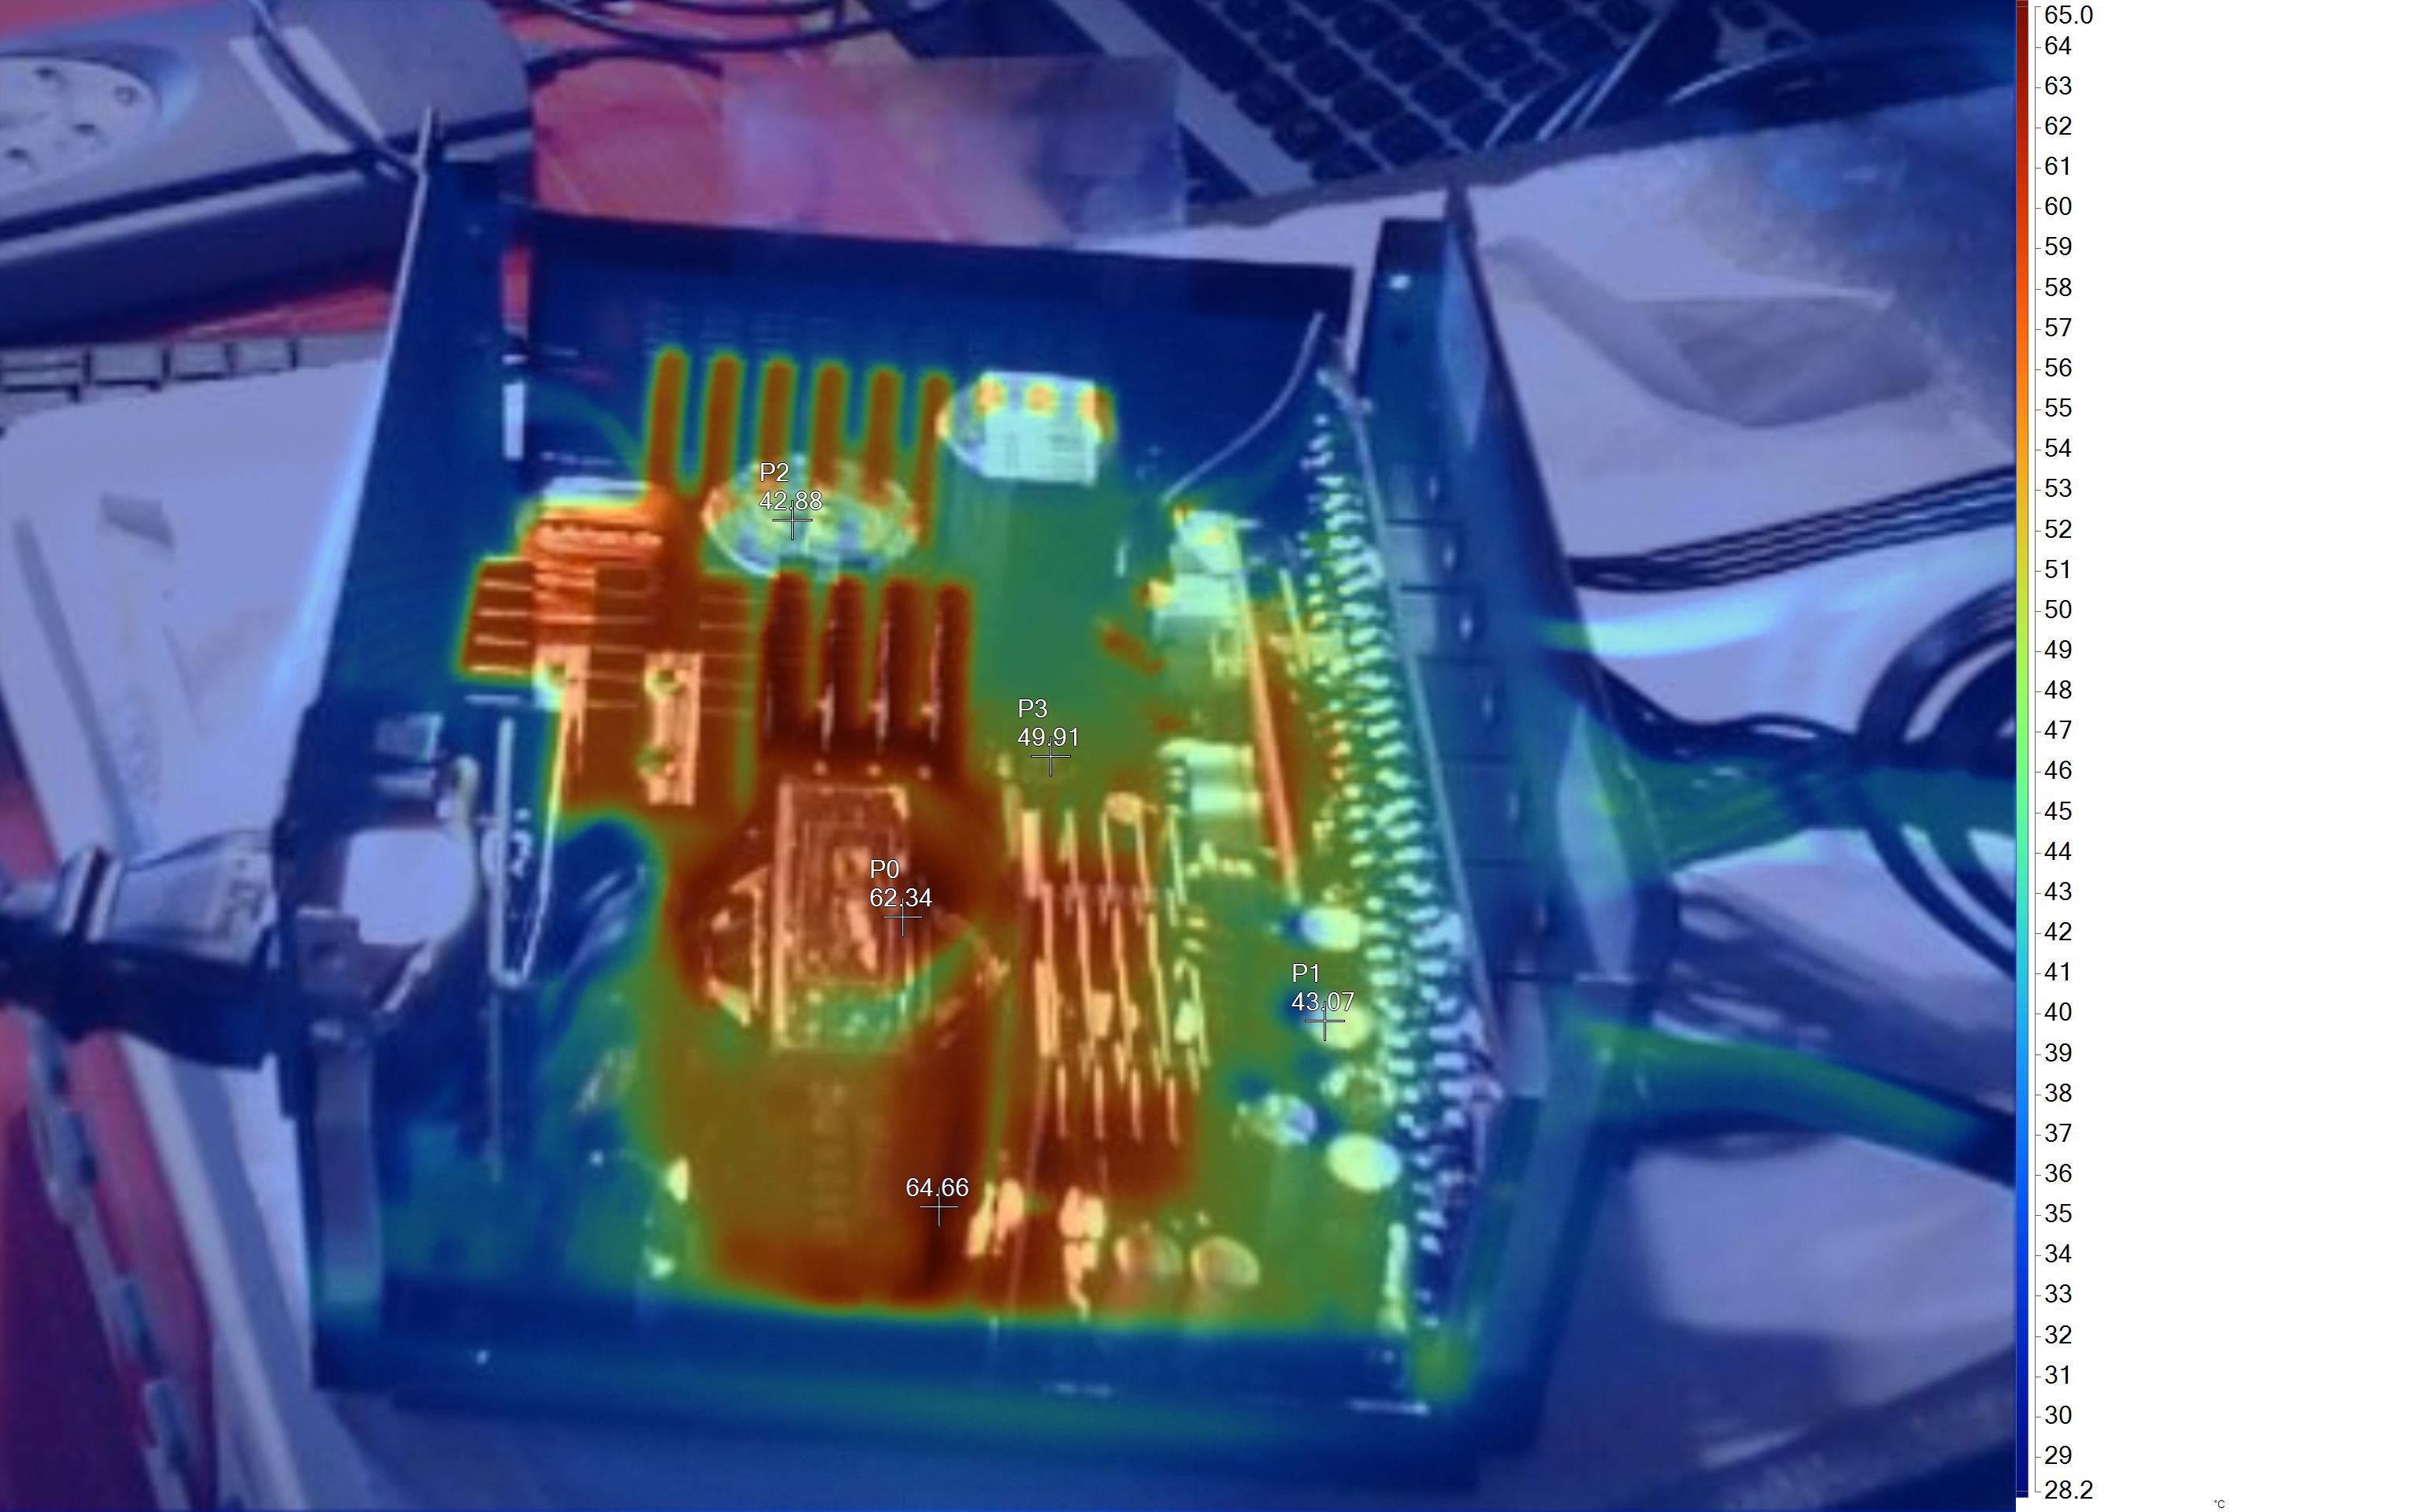
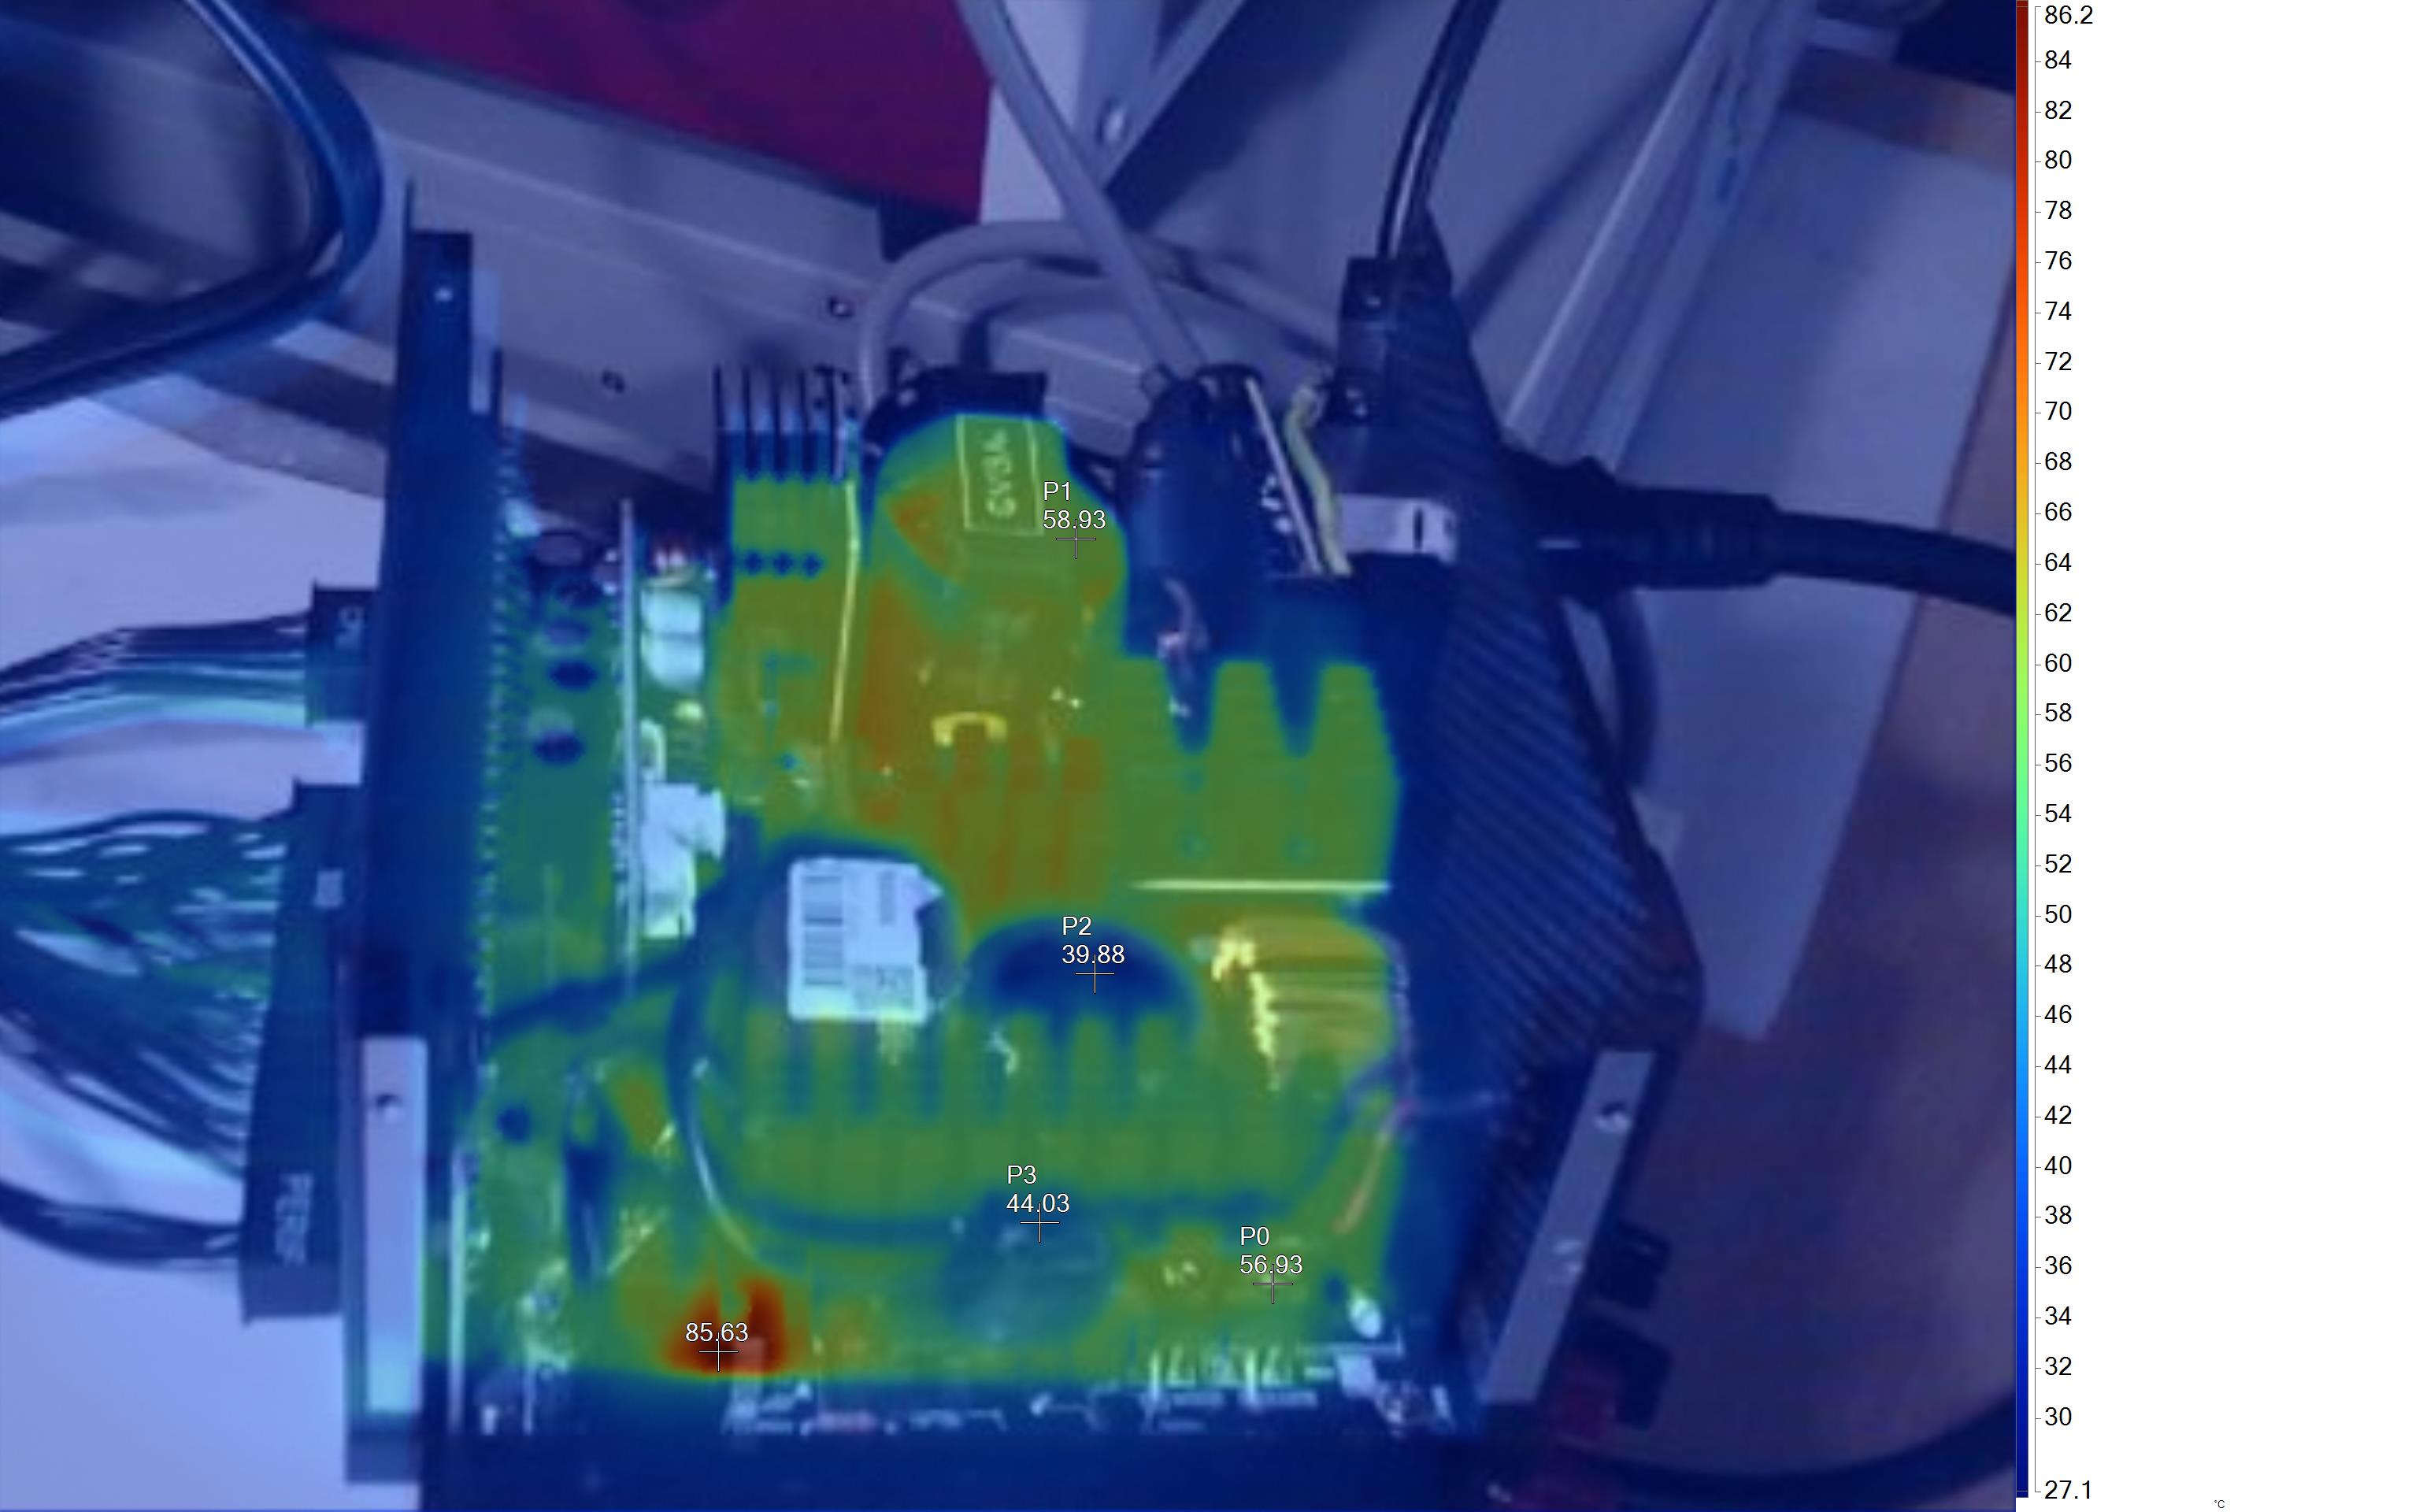
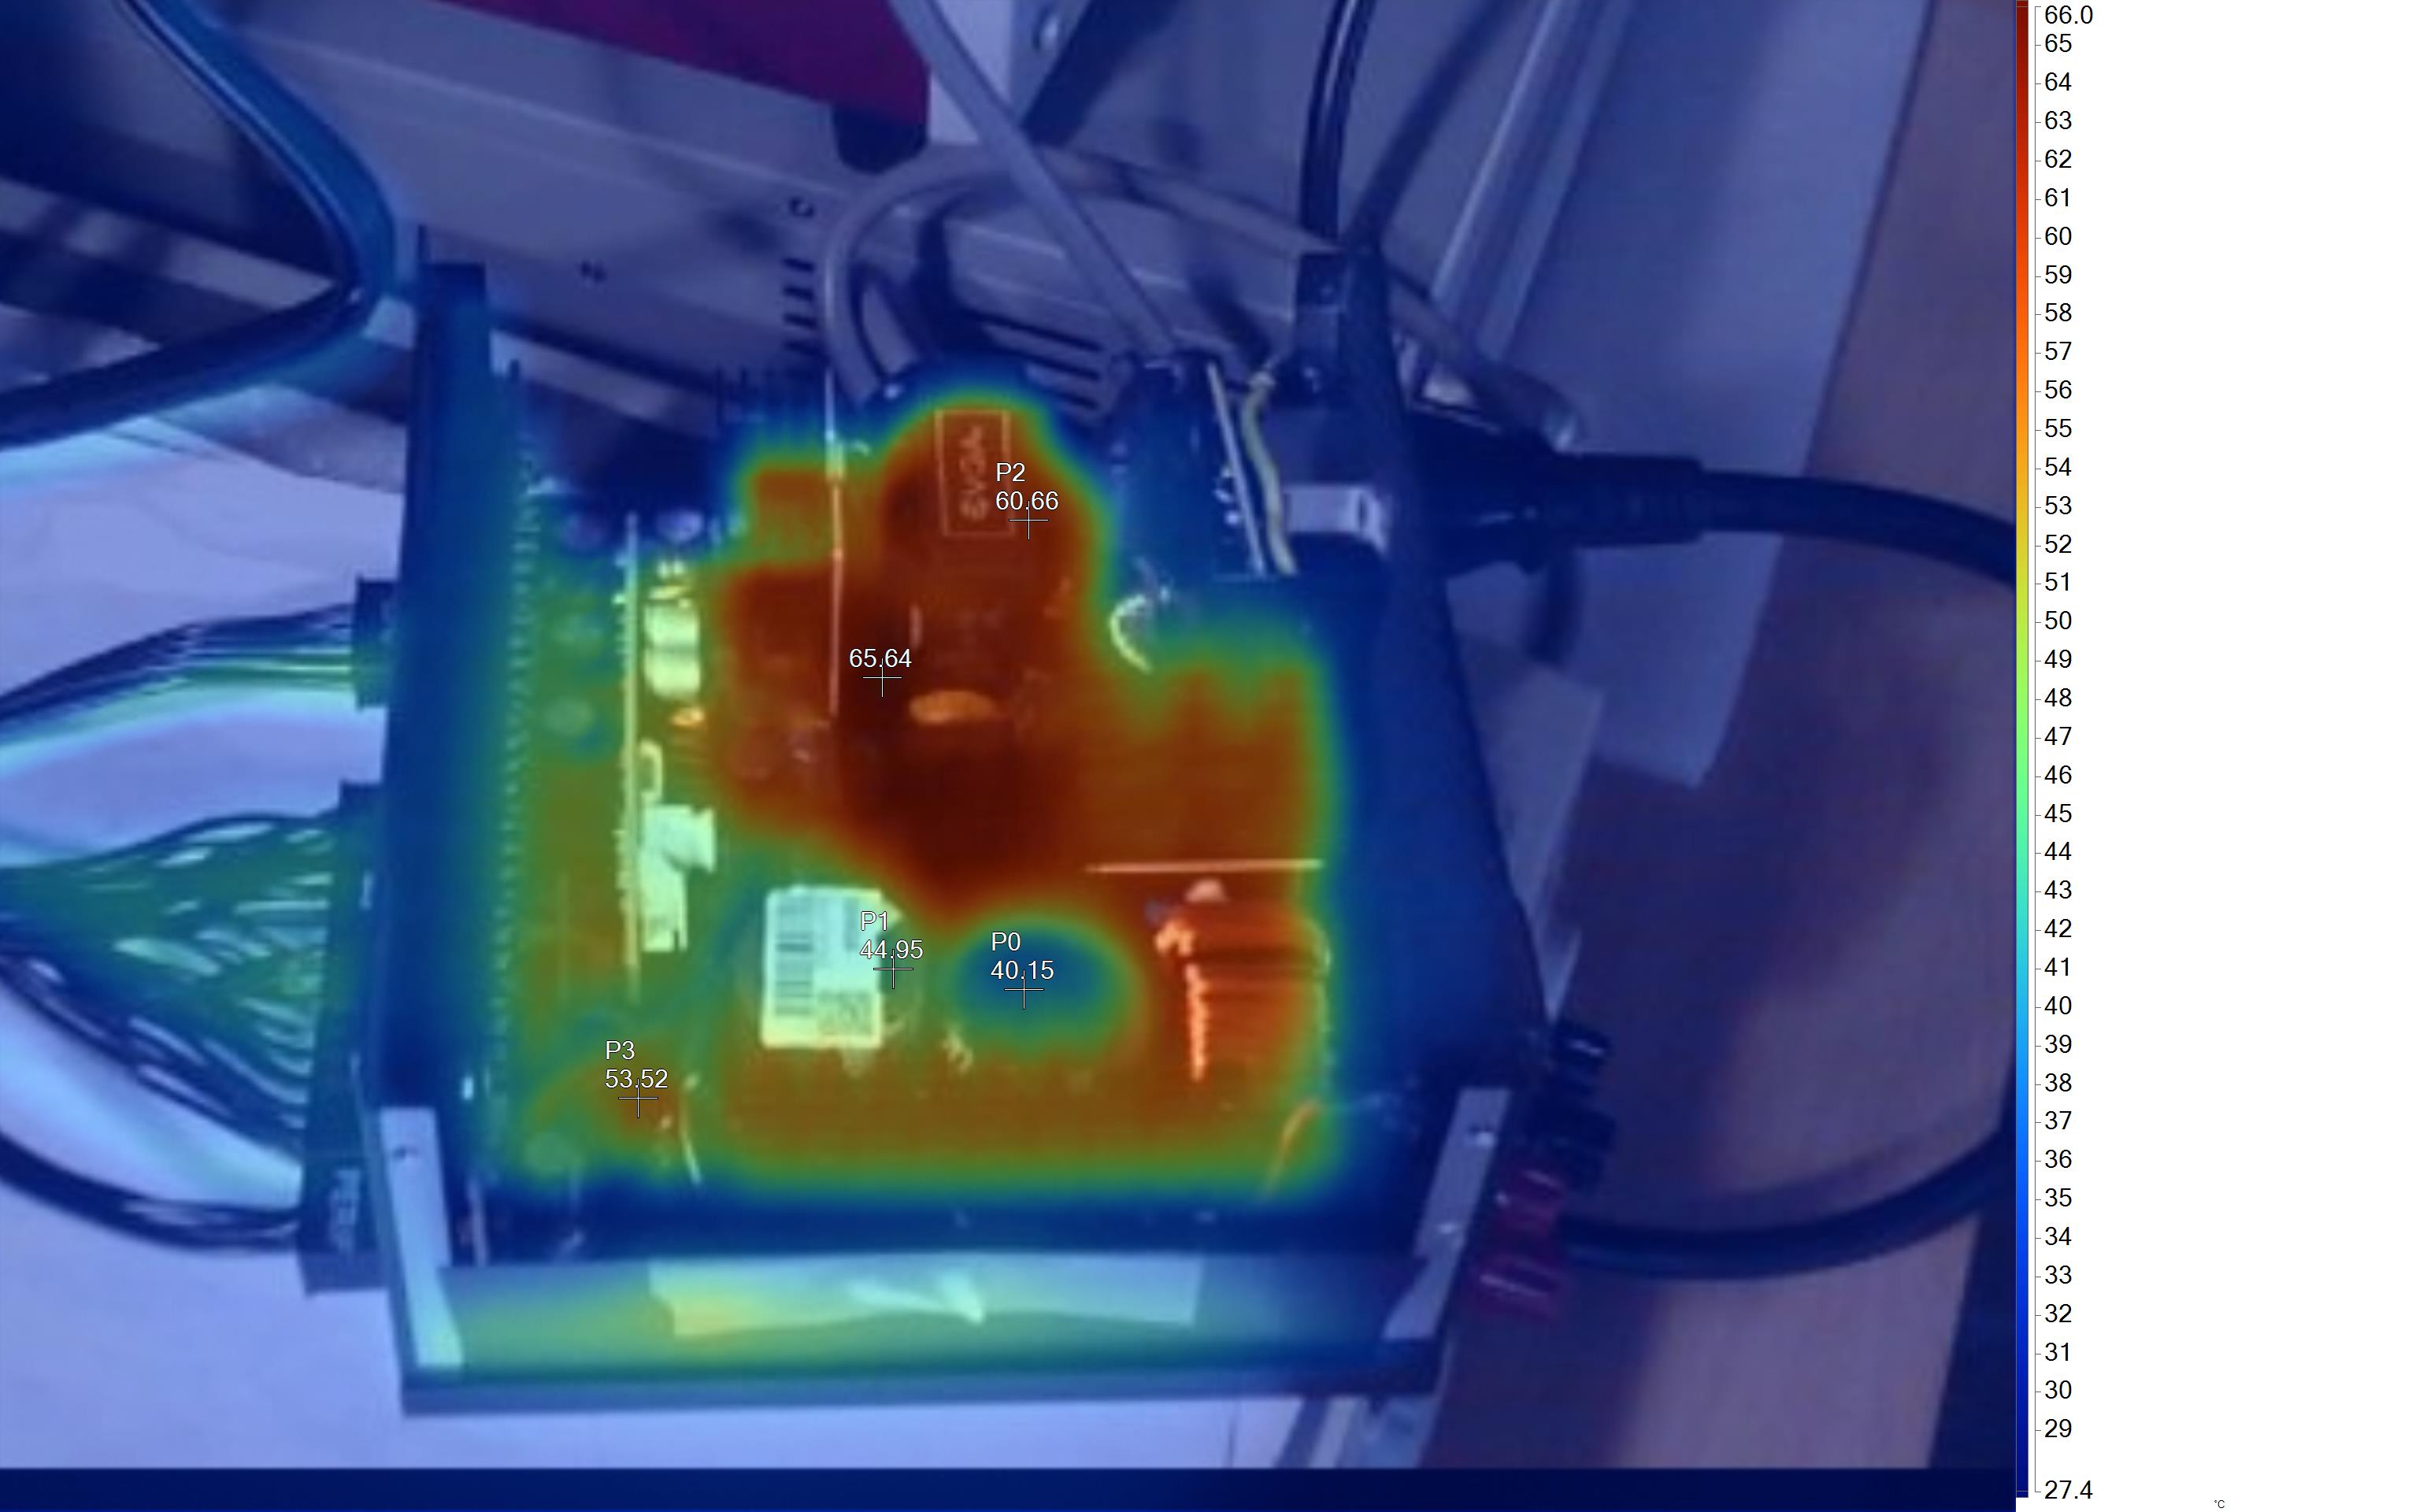
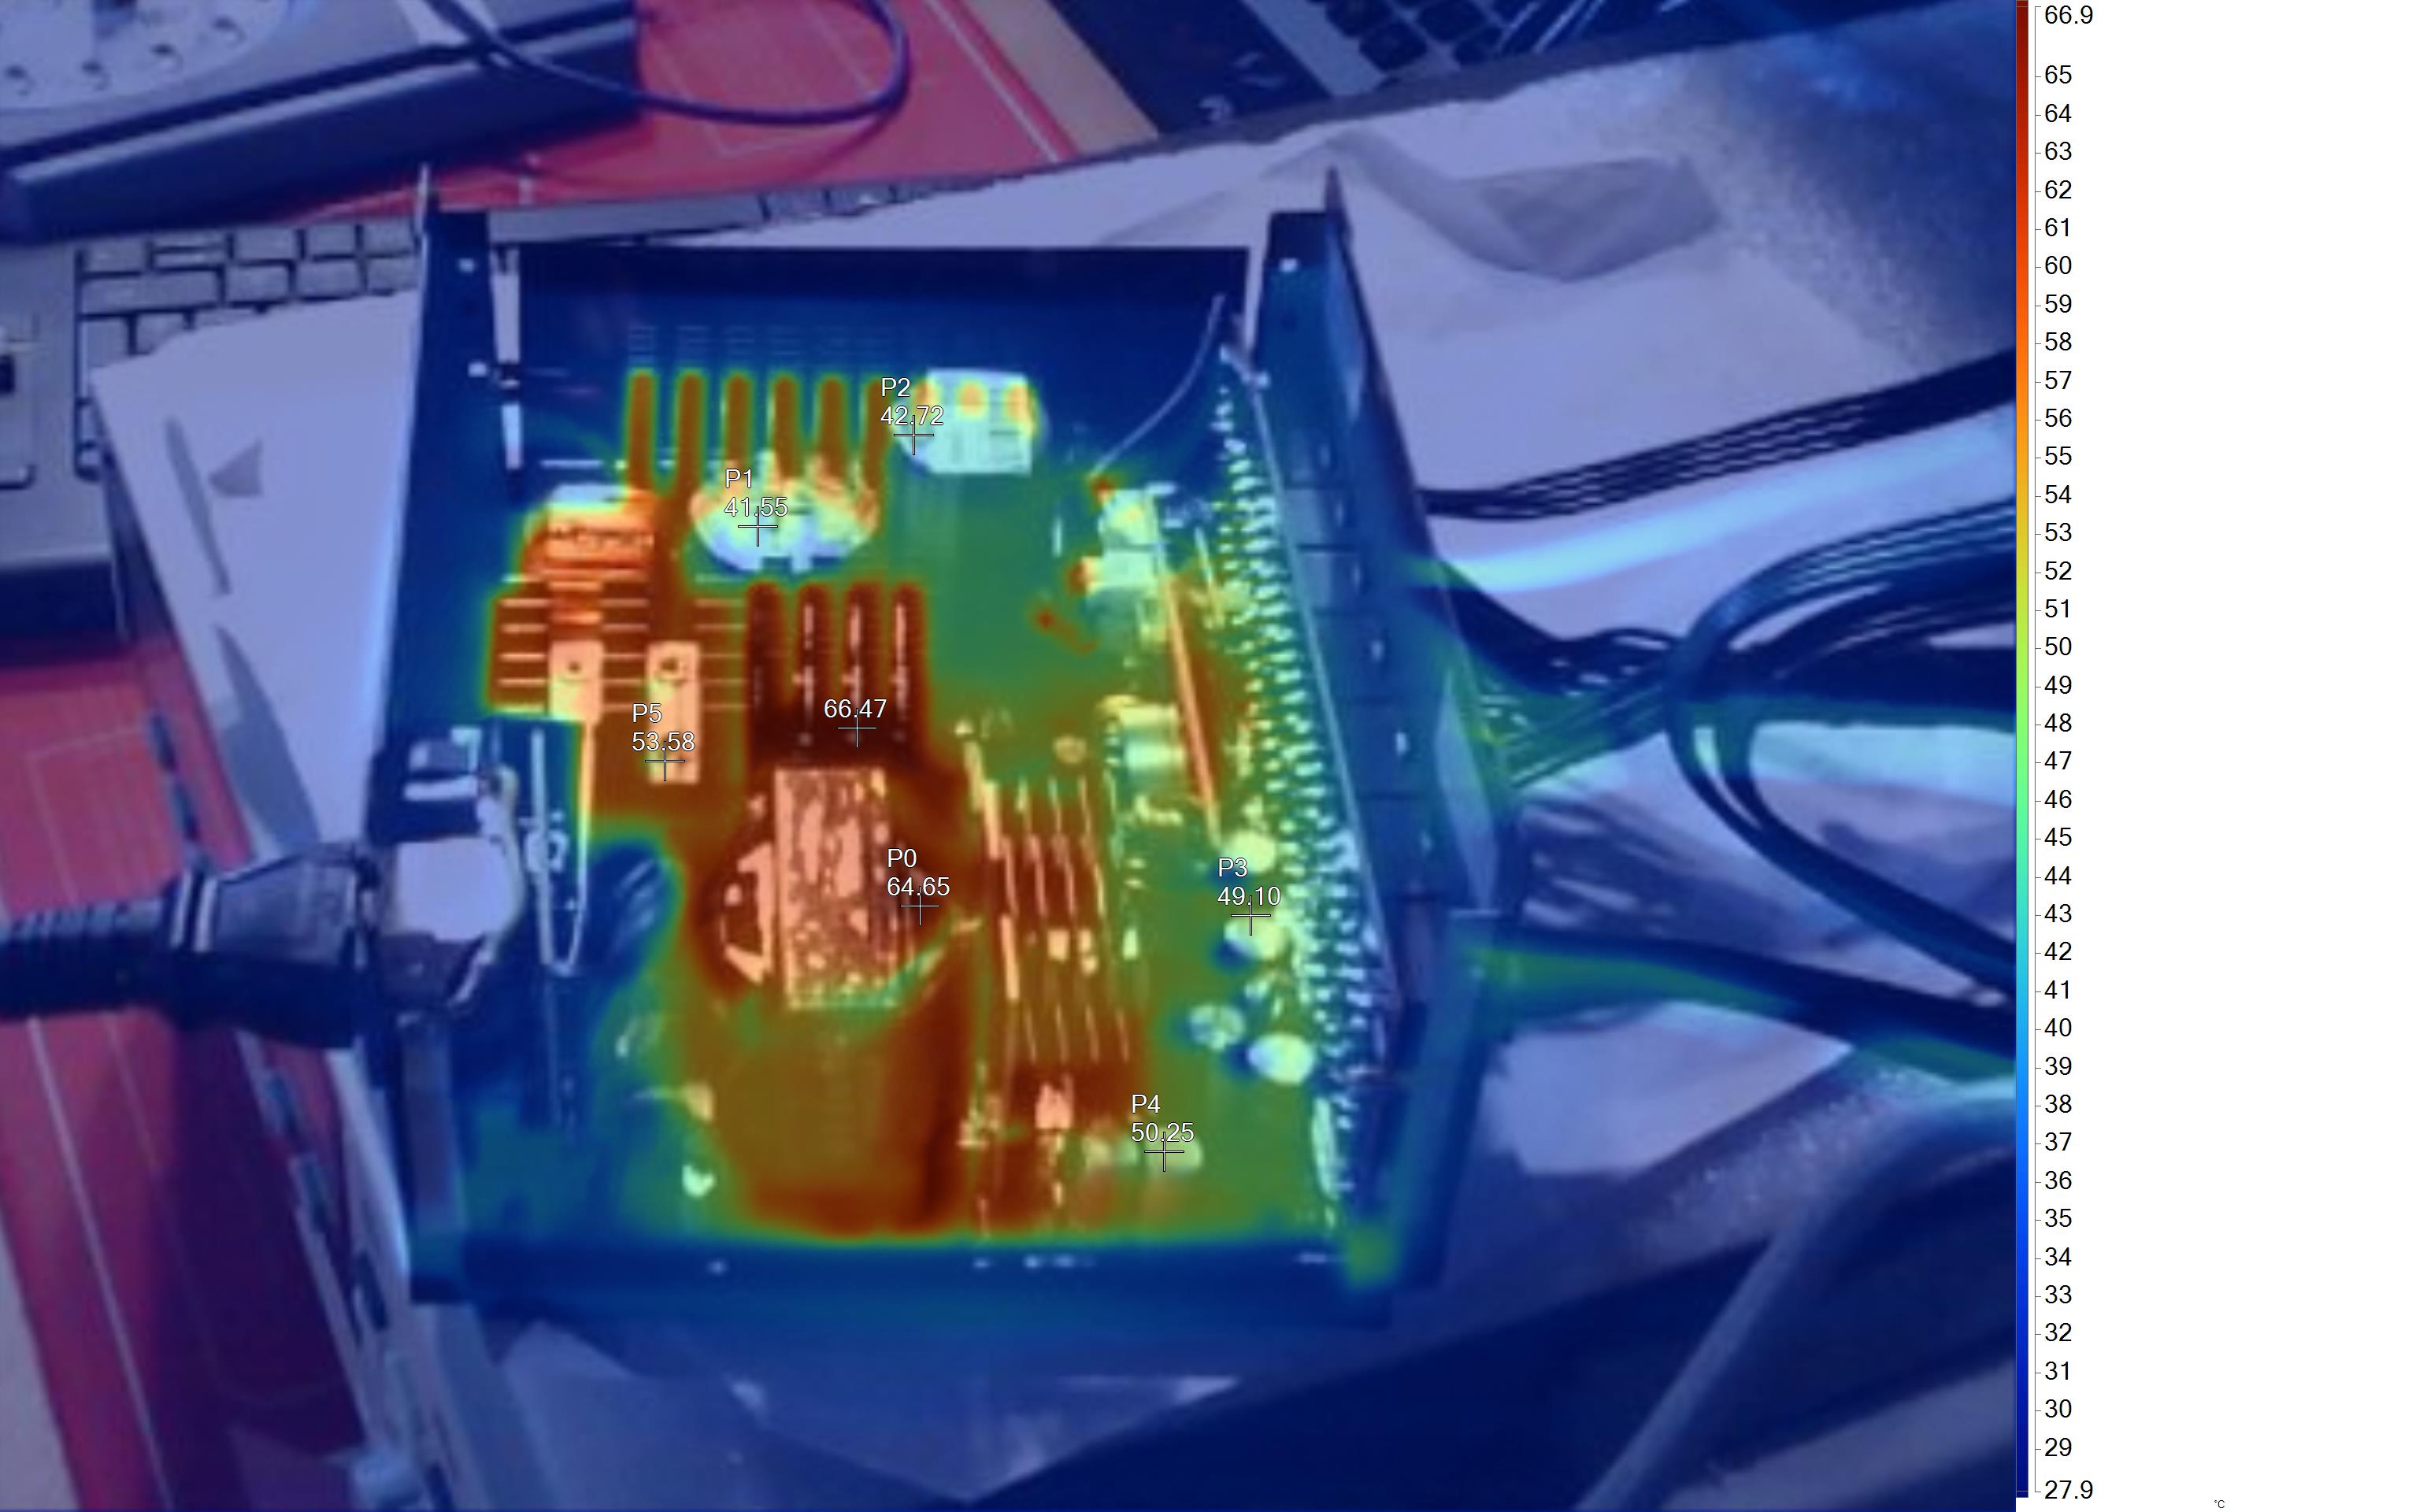
The hottest parts are the main transformer and the resonant tank, close to the main switching FETs. The 12V heat sinks also get quite hot.
MORE: Best Power Supplies
MORE: How We Test Power Supplies
MORE: All Power Supply Content
Current page: Protection Features, DC Power Sequencing, Cross-Load Tests and Infrared Images
Prev Page Load Regulation, Hold-Up Time, Inrush & Leakage Current, Efficiency and Noise Next Page Transient Response Tests, Timing Tests, Ripple Measurements and EMC Pre-Compliance Testing
Aris Mpitziopoulos is a contributing editor at Tom's Hardware, covering PSUs.
-
Roland Of Gilead Hey there,Reply
Shouldn't the '1000w' in the Power specification chart be underneath the 12v rail? Also, are the amps correct? Specs from EVGA state 83.3a on the 12v rail, as opposed to 62.5? -
jsz031 Why is EVGA so scared to send you a GT or GA?Reply
I know they're worse, but I would like to see how they relatively perform according to your specific linear testing. -
werther595 Is the Super Flower models in the comparison charts the Leadex V Pro 1000W? I think that is their only current 1000W Gold unit. It was specifically named in the review of the Corsair 2021 PSU. Will you be reviewing the Super flower Leadex V Pro?Reply -
Lemkes Compared with the 1000 G3, the G6 model with a similar capacity has a depth of 140mm and a smaller size. A 135mm fan can hardly fit its chassis. As we said before, EVGA's G6 model uses an upgraded version of the Seasonic Focus platform.Reply
targetpayandbenefits.com -
LordTimothyDexter There's no way this review looked at the fan curve for this and must have taken the average dB data from somewhere else. The low average dB is EXTREMELY misleading for this PSU. It stay quiet up to a certain power draw and then the noise SKYROCKETS from it jumping to extremely high fan speeds, but if you were to take the mean dB across its load % it would show a low average dB. Very misleading, this thing gets louder than all the fans in my case combined -- 13 Arctic fans going at 1300-1500rpm are drowned out by the volume from this PSUReply
