GeForce GTX 750 Ti Review: Maxwell Adds Performance Using Less Power
Power Consumption: Gaming
Benchmark System And Procedure
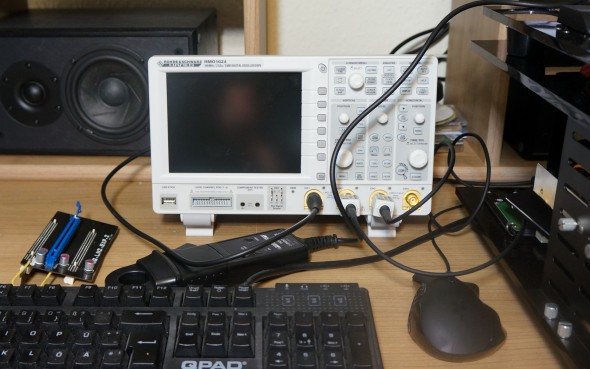
We collaborated with HAMEG (Rohde & Schwarz) to upgrade our power consumption measurement system. It’s now one step away from being complete and will be continuously refined.
We record all channels and the corresponding oscilloscope value/curves for our measurements. The very precise and (more important) fast current clamps yield 100 mV/A, making it easy to calculate power based on the voltage. We also record the supply voltage to multiply its value with the recorded amperage. Depending on the resolution we choose, this procedure yields a very detailed power consumption history. We generally set this to 1 ms, allowing us to capture all fluctuations attributable to AMD’s PowerTune or Nvidia’s GPU Boost technology.
| Measurement Procedure: | Non-Contact Direct Current Measurement at the PCIe Slot Non-Contact Direct Current Measurement at the External PCIe Power Supply Direct Voltage Measurement 3.3 V / 12 V |
|---|---|
| Measurement Apparatus: | Oscilloscope: HAMEG HMO1024 Four-Channel Digital Oscilloscope with Memory and Ethernet Remote ControlPower Clamp: HAMEG HZO50 (1 mA-30 A, 100 kHz DC, Resolution 1 mA)Voltage Divider Probe: HAMEG HZ154 (1:1, 1:10), Assorted AdaptersDigital Multimeter: HAMEG HMC8012 |
| Bench Table: | Microcool Banchetto 101 |
| Test Hardware: | Intel Core i7-3770K (Ivy Bridge), Overclocked to 4.5 GHzCorsair H100i Compact Water Cooling Solution16 GB (2 x 8 GB) Corsair Vengeance DDR3-1866Gigabyte G1 Sniper 3 + Modified PCIe Adapter with Current Loops |
| Power Supply: | Corsair AX860i with Modified Plugs (Pickups) |
Power Consumption: Gaming
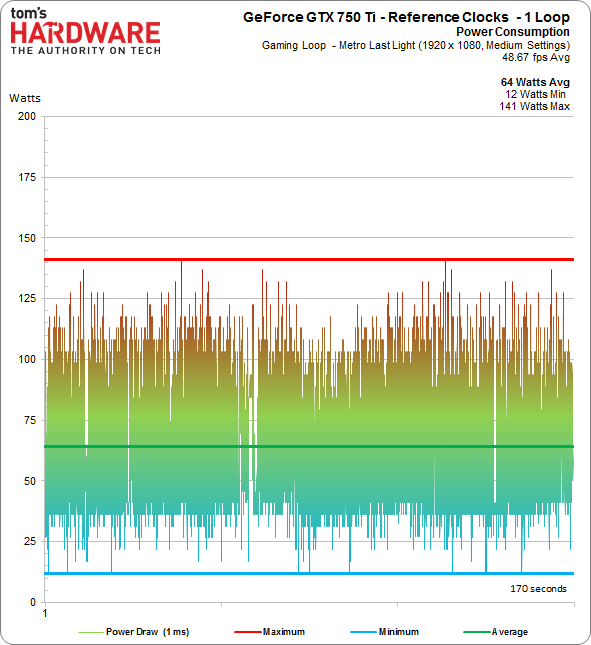
We're particularly interested to learn how Nvidia improved the efficiency of its architecture. In terms of total power consumption, the card averages (in a warmed-up condition, after applying full load) just a little bit over the GPU's TDP. This measures the whole card though, including memory. Thus, Nvidia keeps its word and clearly sets a new standard for performance per watt.
For the first time ever, the average power figure isn't centered between minimum and maximum values, but rather closer to the bottom of the chart. Peaks are clearly rarer, but they're also more extreme. This is important because the card is driven by the motherboard's PCI Express slot, making the platform's quality more important than it might otherwise be.
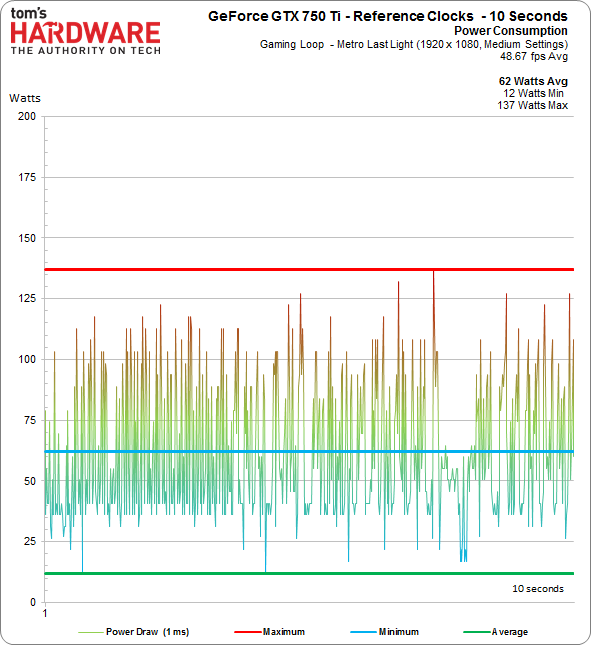
Because the 170-second run is hard to display at the resolution we used, here's a 10-second break-out for additional detail:
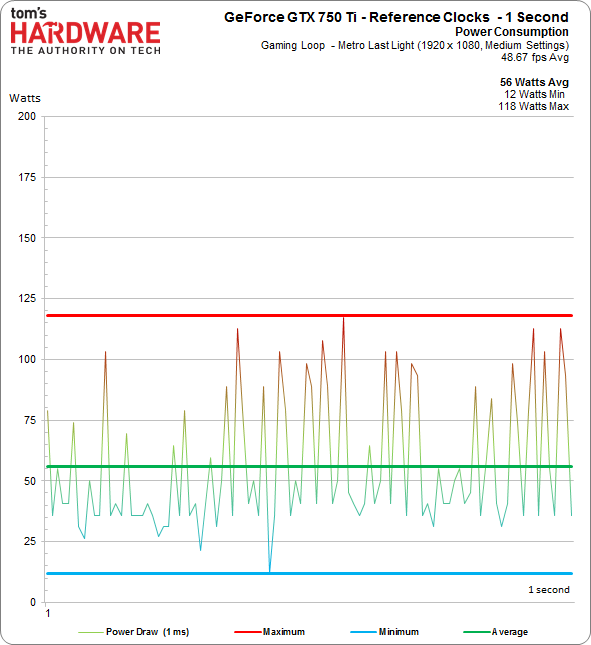
The snippet illustrates how important fast measurements are to the average power consumption value. Of course, we can get even more precise, so this next graph represents just one second. Fluctuations in draw effectively demonstrate what your power supply has to be capable of handling.
But how does consumption change when you take into account more use cases?
Get Tom's Hardware's best news and in-depth reviews, straight to your inbox.
Current page: Power Consumption: Gaming
Prev Page Temperatures And Acoustics Next Page Power Consumption: Idle, Compute, And More-
meluvcookies on performance, I'll take the extra frames of the 265, but damn, for 60w, I'm totally impressed by this card. both the 750Ti and the R7 265 would be decent upgrades from my aging GTX460.Reply -
s3anister ReplyBut without the big cooler, GTX 750 Ti is daintier than a lot of sound cards we've tested.
I'm pretty sure you meant to type "video cards" on page one there. Cheers. -
Bloob AlsoReplyIt’s difficult to make this story all about frame rates when we’re comparing a 60 W GPU to a 150 W processor
Is a bit confusing. -
cangelini Reply
Actually meant sound card :) It's definitely smaller than a small video card, but I even have sound cards here that are larger.But without the big cooler, GTX 750 Ti is daintier than a lot of sound cards we've tested.
I'm pretty sure you meant to type "video cards" on page one there. Cheers. -
Sangeet Khatri Well.. there is not a lot of performance in it, but I love it for a reason that it is a 60W card. I mean for 60W Nvidia has seriously nailed it. The only competition is way behind, the 7750 performs a lot less for similar wattage.Let's see how AMD replies to this because after the launch of 750Ti, the 7750 is no longer the best card for upgrading for people who have a 350W PSU.I don't generally say this, but Nvidia well done! Take a bow.Reply -
houldendub Nice little card, awesome! I feel like this would be an absolutely awesome test bed for a dual chip version, great performance with minimal power usage.Reply -
thdarkshadow The whole time I was reading the review I was like it isn't beating the 650ti boost... :( but then I remembered it uses less than half the power lol. I am impressed nvidia. While I make purchases more on performance than power consumption I can still appreciate what nvidia is doingReply -
houldendub Reply12707408 said:Anybody else notice the lesser shaders and TMUs on the Zotac card in GPU-Z?
Don't take this as fact, but the drivers look newer for the Zotac card than the others, possibly just a bug with the older drivers? The cards are advertised as having 640 shaders anyway.
Also weird, the GPU-Z screenshot is taken with Windows 8, whereas the Gigabyte and MSI cards are on Windows 7. The mystery continues...


