Legacy Storage Benchmarking Methodology
Advanced Workloads
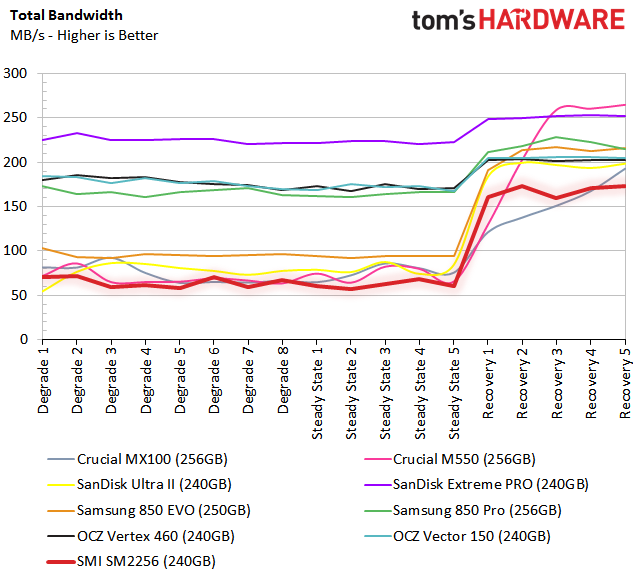
It wasn't enough for Futuremark to release the best traces we've benchmarked. The company went on to produce the best client storage metric ever created. The Storage Consistency Test works a drive though several stages of performance. For years, we knew that SSDs should be evaluated in three dimensions. The 2D look yields a basic picture of performance, but lacks the depth of steady state and performance recovery.
Precondition
- Write to the drive sequentially up to its reported capacity with random data, write size of 256*512=131072 bytes.
- Write through a second time (to take care of over-provisioning).
Degradation
- Run writes of random size between 8*512 and 2048*512 bytes on random offsets for 10 minutes.
- Run performance test (one pass only). The result is stored in secondary results with name prefix degrade_result_X where X is a counter.
- Repeat steps one and two eight times, and on each pass increase the duration of random writes by five minutes.
Steady State
- Run writes of random size between 8*512 and 2048*512 bytes on random offsets for final duration achieved in degradation phase.
- Run performance test (one pass only). The result is stored in secondary results with name prefix steady_result_X where X is a counter.
- Repeat steps one and two five times.
Recovery
- Idle for five minutes.
- Run performance test (one pass only). The result is stored in secondary result with name recovery_result_X where X is a counter.
- Repeat steps one and two five times.
Clean Up
- Write to the drive sequentially up to its reported capacity with zero data, write size of 256*512=131072 bytes.
The performance consistency test involves 18 individual runs using the same workloads as the standard test. The result is one long text file with several useful bits of data. We use the overall throughput from each combined test run and the overall latency.
Get Tom's Hardware's best news and in-depth reviews, straight to your inbox.

Chris Ramseyer was a senior contributing editor for Tom's Hardware. He tested and reviewed consumer storage.
-
damric How I test an SSD. HARD RESET my computer 20 times. If the SSD is still recognized by the motherboard, then the SSD controller is worth a flip.Reply
SSDs will never wear out due to IOPs. Only the controllers break. Quit kidding yourselves. -
schizz69 Great article. Always good to get a glimpse inside the process, which Tom's is always so willing to do.Reply
Thanks Chris. -
ssdpro You'll notice all these review sites keep their tests nice and short. That way Samsung stays happy and keeps buying ad space. If they tested a drive months apart Samsung would be exposed with those floppy disk slow reads.Reply -
Gurg None of these tests give the consumer any indication of the degredation of the performance of the SSD over time. While my systems have been become more powerful and the software has been updated, the performance of my main SSD used mostly for for W7 and hardware drivers and as measured by Passmark runs has declined by 38% in about three years.Reply -
unityole @Gurg, as SSD over time, either via temperature or usage or amount of data filled performance declines. if you secure erase and install new window and it'll back to brand new performance again, tbh i think this article cover most of it, maybe you're just confused between a good ssd or uncleaned window files slowing down your system.Reply -
ykki ReplyHow I test an SSD. HARD RESET my computer 20 times. If the SSD is still recognized by the motherboard, then the SSD controller is worth a flip.
And that will be all on your first day of "How to test hardware the MacGyver way"
Tomorrow we will learn to test psu's by putting them in microwave at 50 degree C for 60 minutes while it itself is powering the microwave.
Thank you. :lol:
-
damric Reply15491425 said:How I test an SSD. HARD RESET my computer 20 times. If the SSD is still recognized by the motherboard, then the SSD controller is worth a flip.
And that will be all on your first day of "How to test hardware the MacGyver way"
Tomorrow we will learn to test psu's by putting them in microwave at 50 degree C for 60 minutes while it is powering the microwave.
Thank you. :lol:
I choked on my drink you had me LOLing so hard :) -
unityole Reply15491425 said:How I test an SSD. HARD RESET my computer 20 times. If the SSD is still recognized by the motherboard, then the SSD controller is worth a flip.
And that will be all on your first day of "How to test hardware the MacGyver way"
Tomorrow we will learn to test psu's by putting them in microwave at 50 degree C for 60 minutes while it itself is powering the microwave.
Thank you. :lol:
calm down!!
