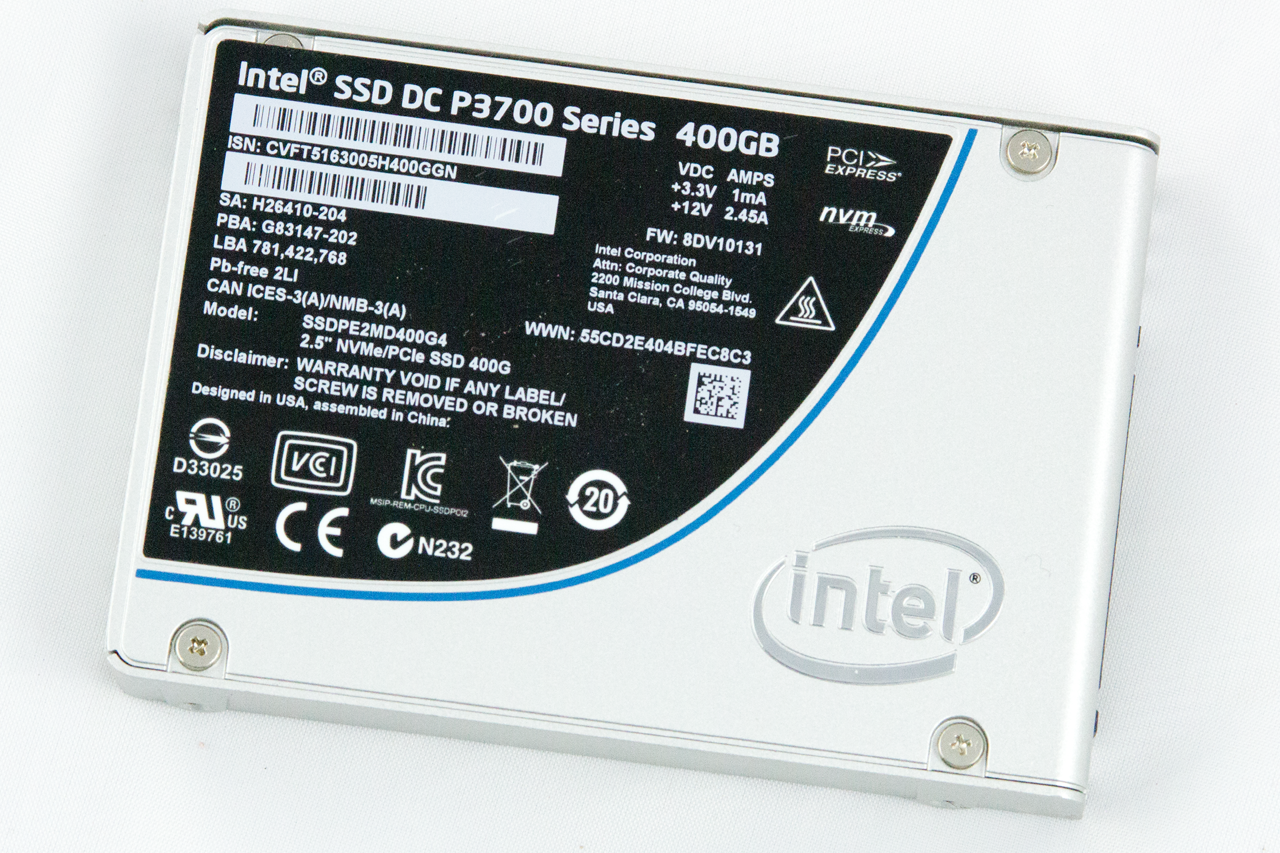
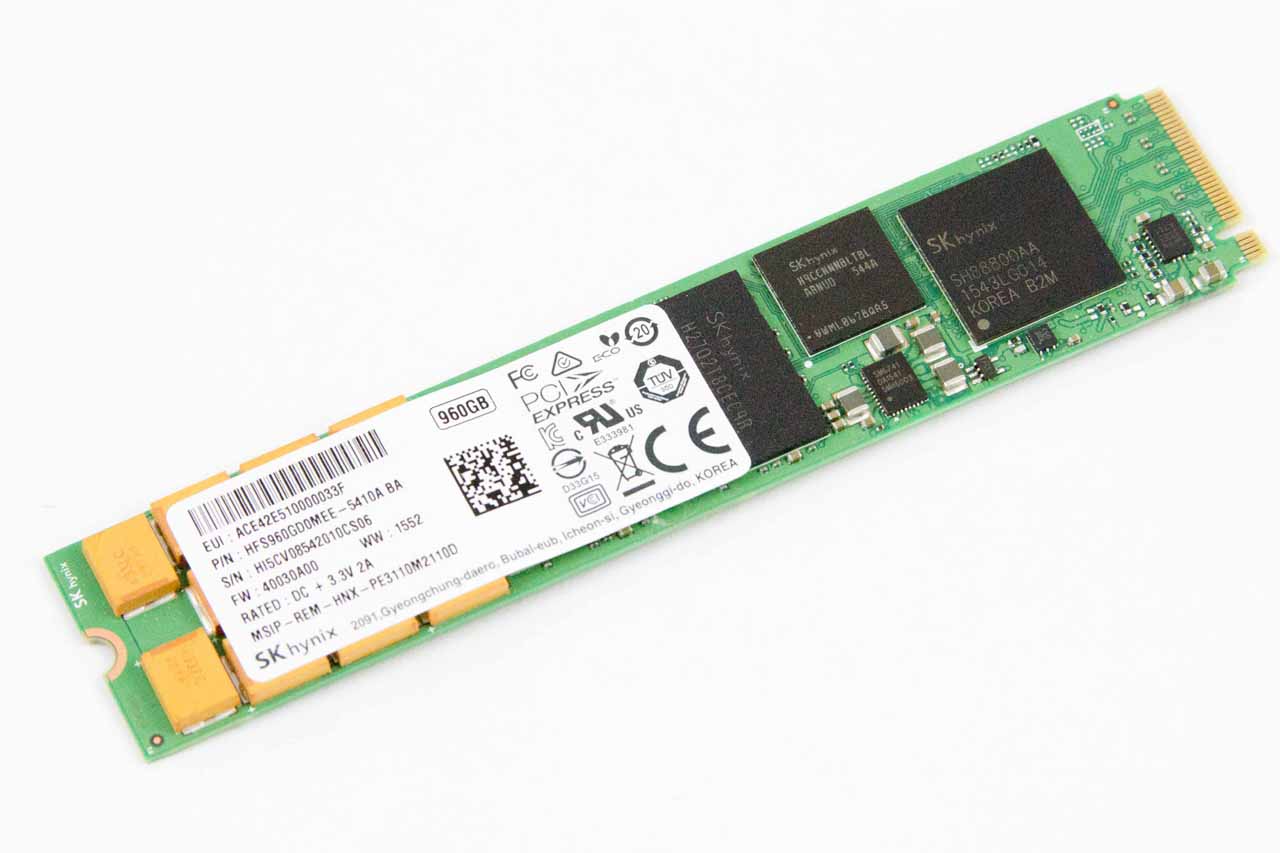
Intel DC P3520 Enterprise SSD Review
Why you can trust Tom's Hardware
4KB Random Read And Write
To read more on our test methodology visit How We Test Enterprise SSDs, which explains how to interpret our charts. The most crucial step to assuring accurate and repeatable tests starts with a solid preconditioning methodology, which is covered on page three. We cover 4KB random performance measurements on page four, explain latency metrics on page seven, and cover QoS testing and the QoS domino effect on page nine.
Our test pool consists of SSDs with varying capacity points and over-provisioning levels. This is an important consideration during the procurement process, and we urge readers to reference the specifications for each capacity point. Our test pool includes the 1.6TB Intel DC P3700, 3.2TB Memblaze PBlaze4, 3.2TB HGST Ultrastar SN150, and the 960GB SK hynix PE3110 M.2 SSD.
We have two different tiers of SSDs in the test pool, but we will focus on comparing the value-centric Intel and SK hynix models. The DC P3520 and the SK Hynix PE3110 endurance ratings are worlds apart from the other competing models. Performance tends to come hand-in-hand with the endurance rating due to the inner workings of SSDs. Simply stated, SSDs with more endurance are usually faster. We include the more expensive high-endurance models in the test pool to illustrate the different levels of performance with popular enterprise SSDs.
The SK hynix comes in the M.2 form factor, which is becoming more prevalent in the data center (it seems to be everywhere as of late), and the DC P3520’s low-cost structure will put it in direct competition with many SATA and M.2 competitors.
SSD manufacturers always want to put their best foot forward, so vendors tend to send only high performance and endurance models for testing. We expect this to change as value optimized models become the big volume movers. The Micron 9100 is the one notable non-entry that will likely compete directly with the DC P3520 in the value segment. We have several of the high-performance 9100 MAX models in the lab for RAID testing, but the over-provisioning setting is not a user-configurable parameter. We will have to send one of the units back to Micron for reassignment into the more general-purpose configuration, but that is not possible at this time because we are in the midst of extended testing. The “vanilla” Micron 9100 will join our value comparison pool in the future.
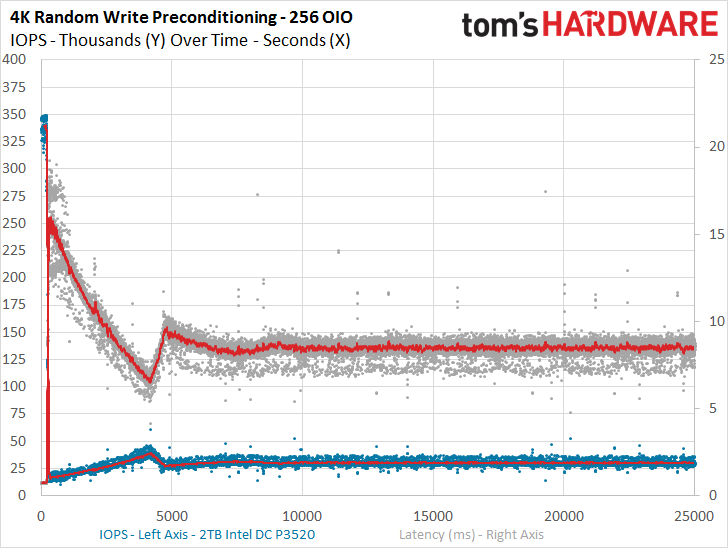
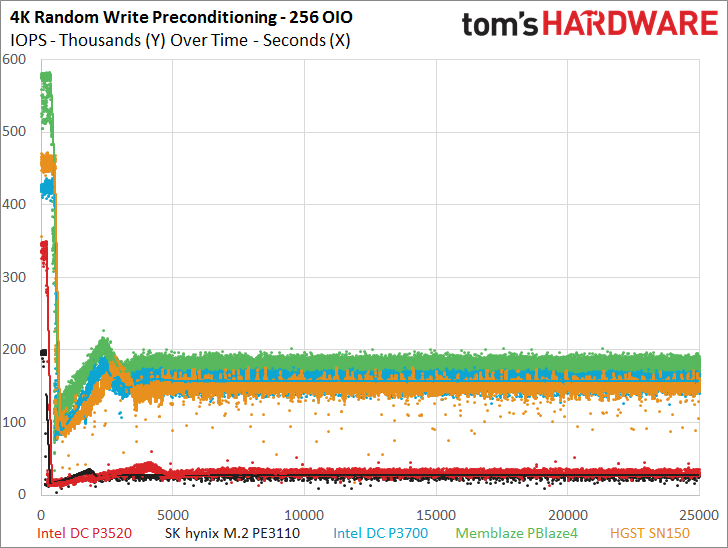
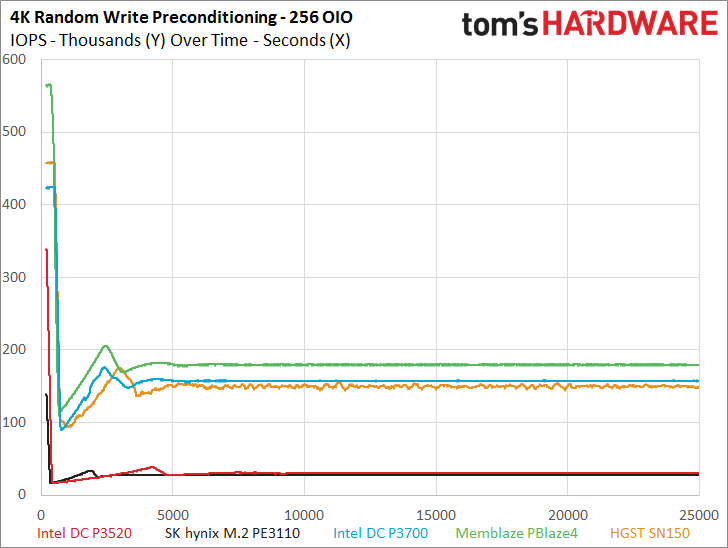
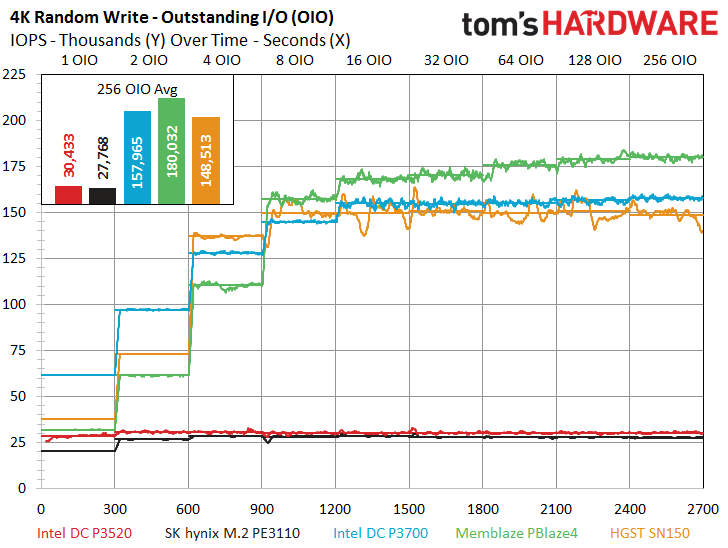
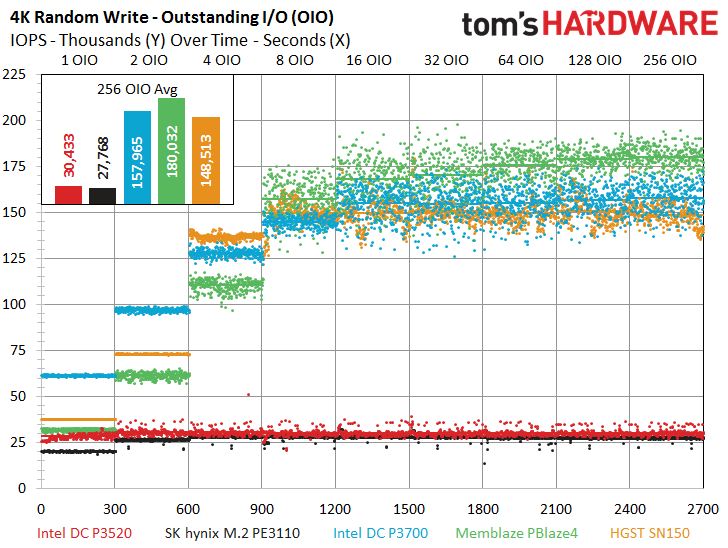
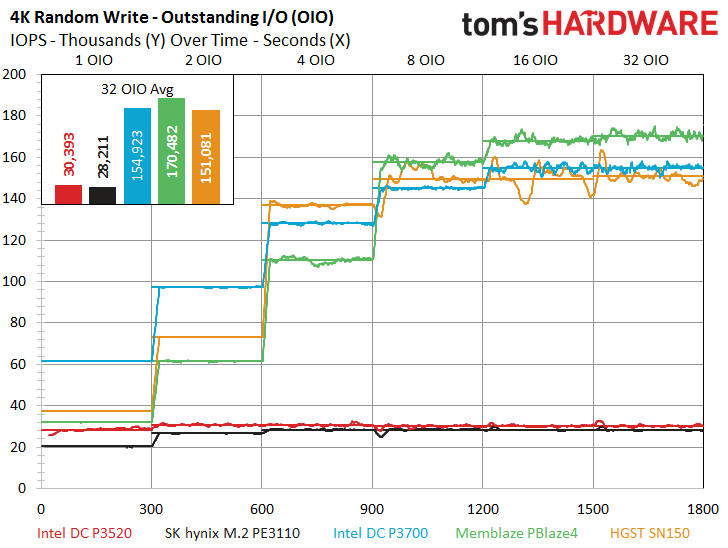
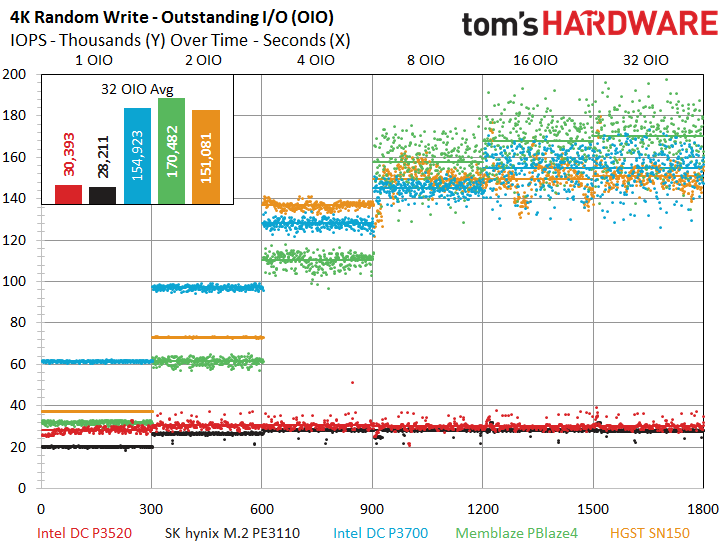
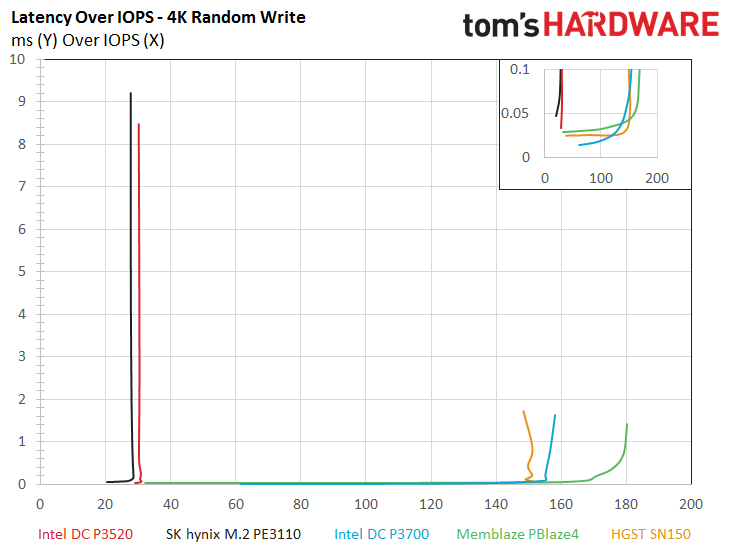
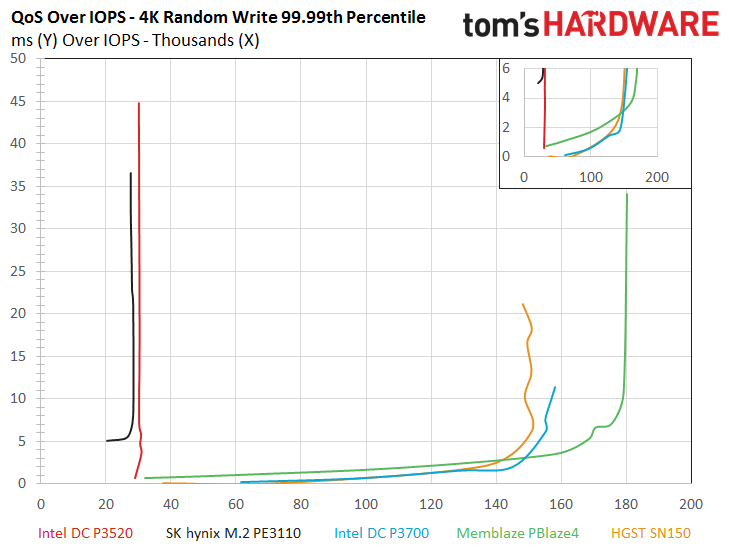
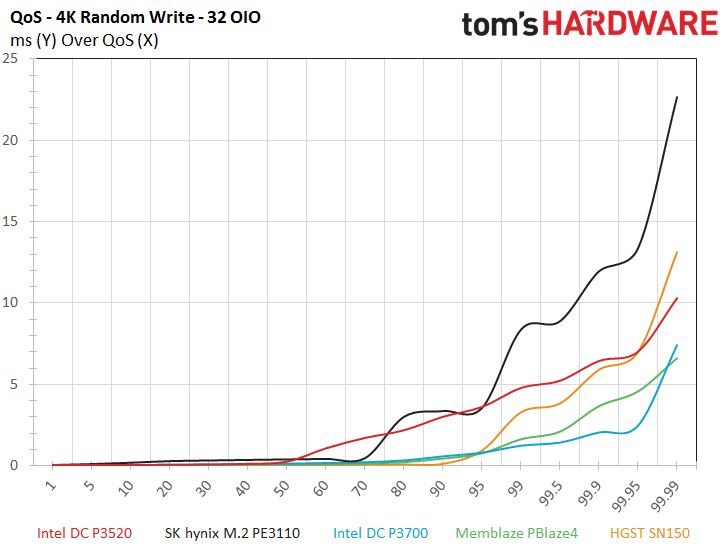
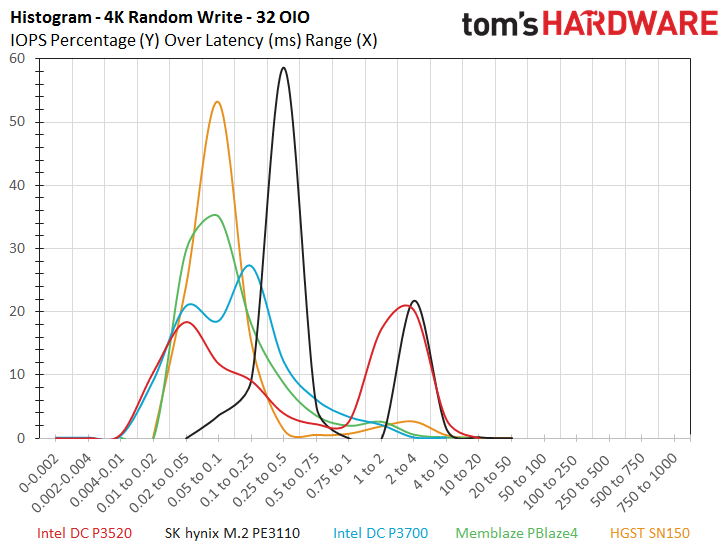
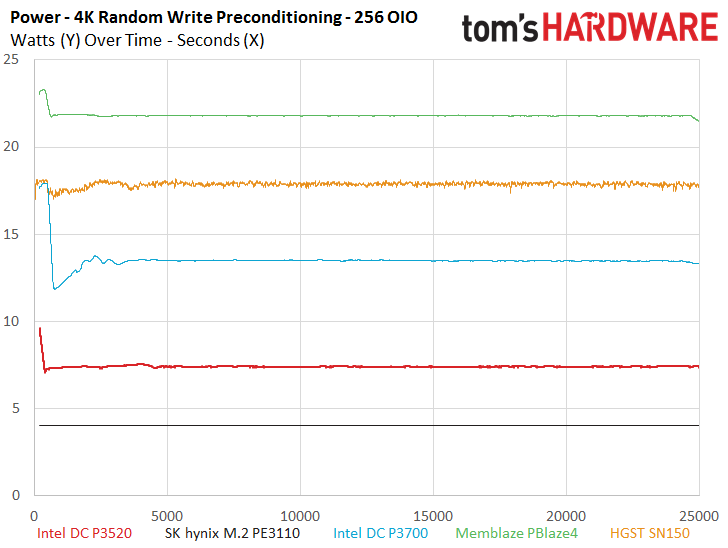
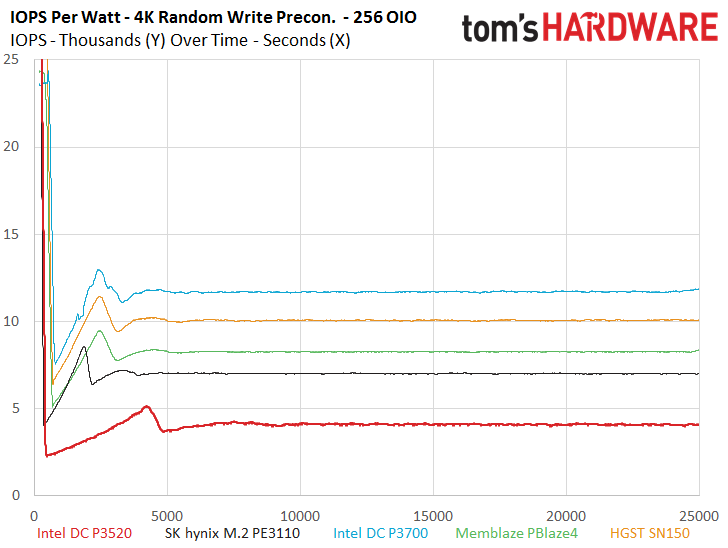
The DC P3520 and the SK hynix PE3110 confirmed our expectations with the lowest performance during the 4k random write preconditioning window. The two 3D NAND powered SSDs are surprisingly well matched, which speaks a lot to the power of the small SK hynix 8-channel controller, which manages to hold its own even though it is outweighed by the 18-channel Intel SSD controller. Of course, the real test will come with mixed workloads. A sustained pure random write workload is rare (if not unseen) in most environments, but it serves to illustrate how nimble the drive is with the most pressing workloads.
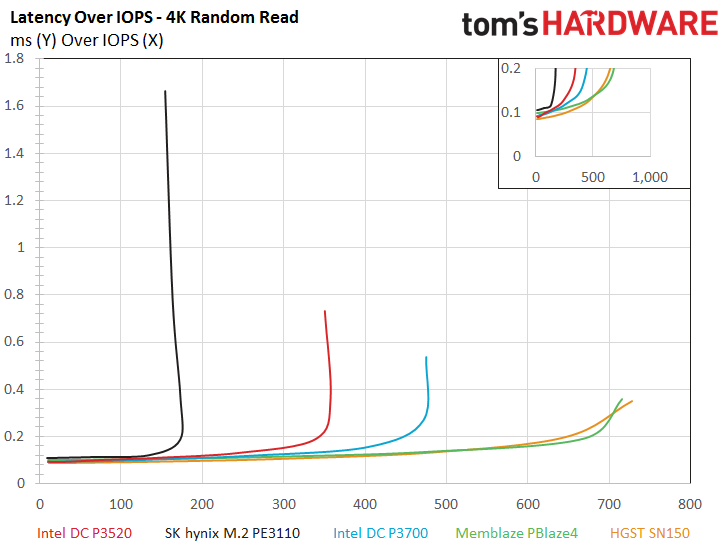
As with all value parts, we experience less scaling as the workload intensifies, but we do note that the DC P3520 offers impressive QD1 performance. The two value entrants also experience less performance variation than the more endurant models. The latency and QoS charts reveal that the value parts offer great performance at low queue depths, but the latency and QoS tend to increase rapidly as workload intensity increases. The performance trend is evidenced by the line that moves straight up, as opposed to the other models, which swoop over to the right as they deliver more performance within the same latency/QoS envelope.
Get Tom's Hardware's best news and in-depth reviews, straight to your inbox.
Even the heaviest of workloads rarely surpasses QD4, so the extra performance (the swoop to the right) really isn’t needed in most write-centric workloads, let alone in the more pedestrian read-centric market. We also note that under the lightest load, which we plot in the latency/QoS sub-charts, the DC P3520 comes close to matching the performance of the other models.
The Intel model holds a significant advantage over SK hynix in the QoS 32 OIO write breakout.
The M.2 SK hynix entrant easily sips the least power with less than 4W during the measurement window, but the DC P3520 comes impressively close with only 7W of sustained power draw. Both of the value SSDs draw significantly less power than the expensive high-endurance models, but also provide less performance-per-Watt.
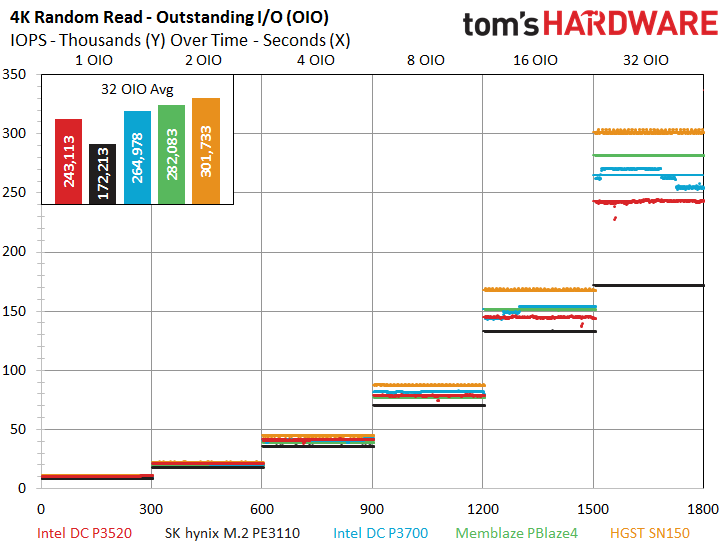
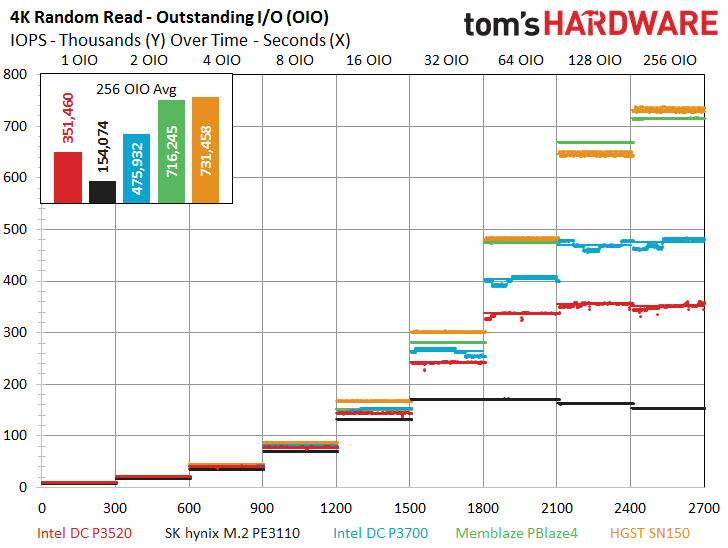
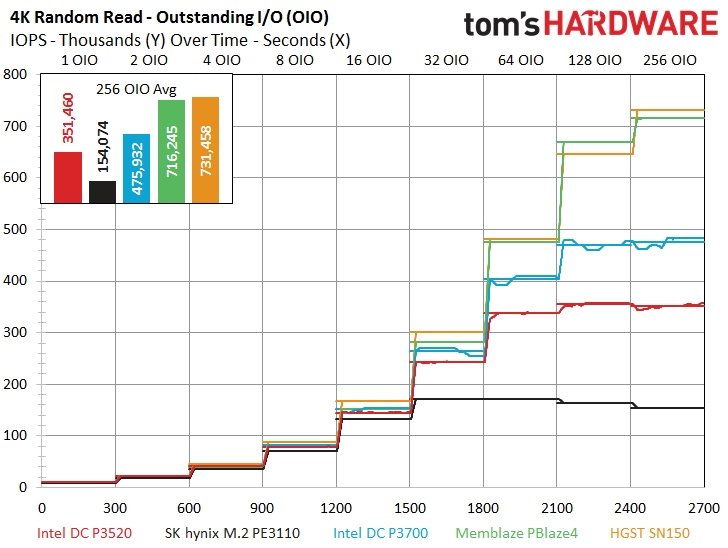
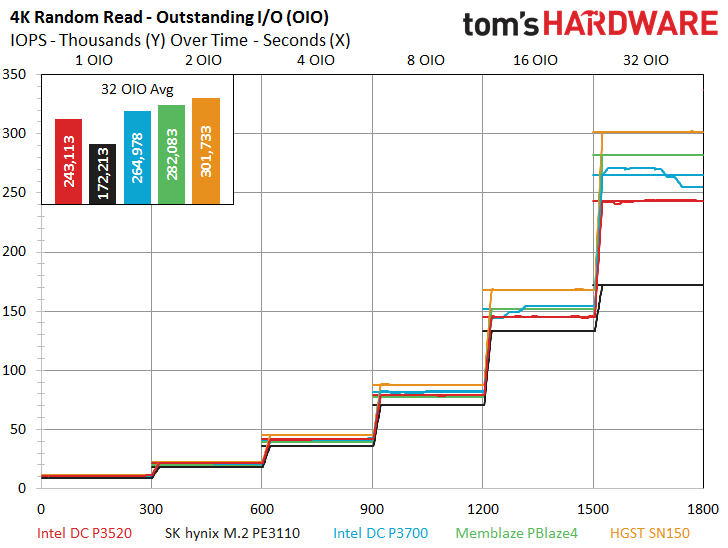
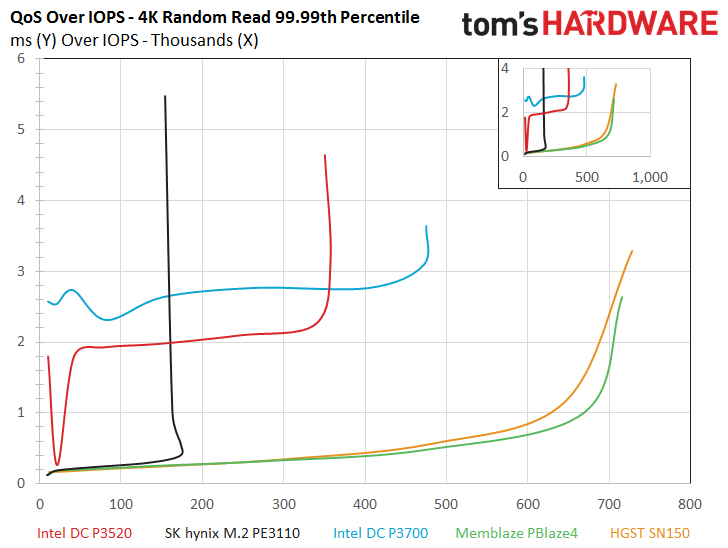
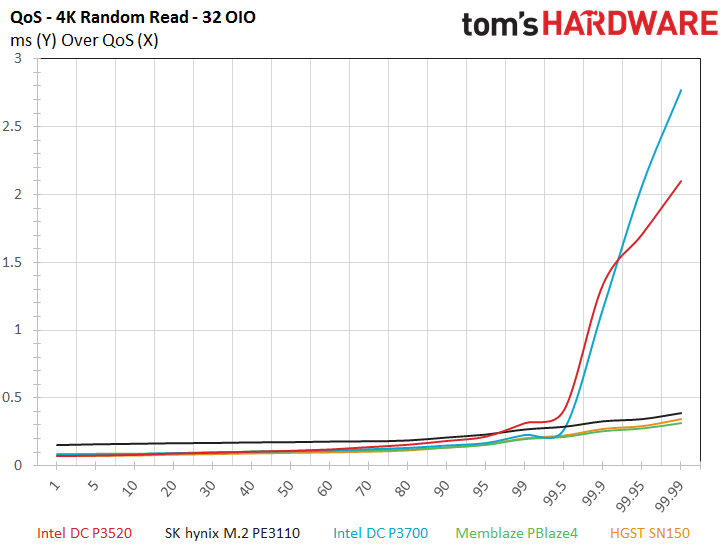
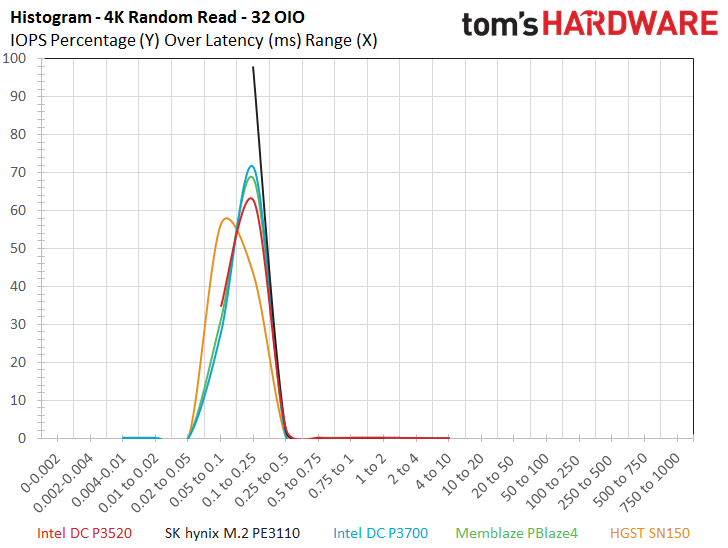
The DC P3520 lagged behind its own specifications during the random read workloads with 351,460 IOPS at 256 OIO. The spec calls for 375,000 IOPS, which we missed by a small margin. Intel has a reputation for very accurate specifications. In fact, the company often understates performance specifications. We retested significantly with the 4.7 and earlier kernels but were unable to bring performance up to the rated spec. As a final effort, we connected the drive to a Windows test mule and were able to hit 379,000 random read IOPS (over spec) with ease, which indicates there might be some fine-tuning left for the latest Linux NVMe driver. The scale of the shortfall in Linux is rather small and falls within the SNIA-defined +/- 10% variation in steady state. We were able to surpass all other Intel specifications.
The random read performance on the lower end of the spectrum is the most impressive. The DC P3520 comes within striking distance of the heavy duty SSDs at 32 OIO, and it leads the test pool at 1 and 2 OIO. The DC P3520 also scaled well as the intensity increased and outperformed the SK hynix (largely by virtue of its higher number of channels and NAND packages). The DC P3520 has 36 packages compared to the PE3110’s five packages, so SK hynix did a wonderful job with the limited amount of PCB real estate on the M.2 form factor. However, the increased package count for AIC models will continue to offer higher performance than M.2 models for quite some time.
The DC P3520 also offers great scaling as it comes to the middle of the pack in the latency and QoS charts, and surprisingly it provides better performance than the P3700 in the 99.99th percentile chart. The Microsemi/PMC-Sierra powered PBlaze4 and SN150 dominate the QoS-over-IOPS chart, but the DC P3520 puts up a good show. Both the DC P3520 and the P3700 lag behind the pool with 32 OIO QoS measurements.
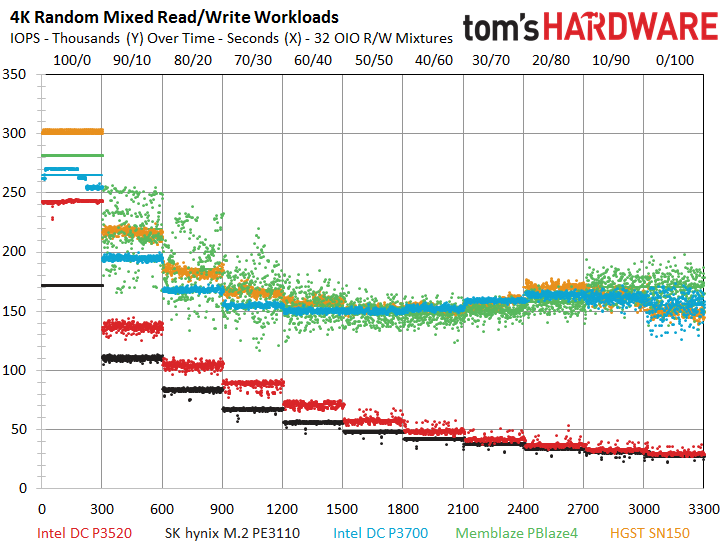
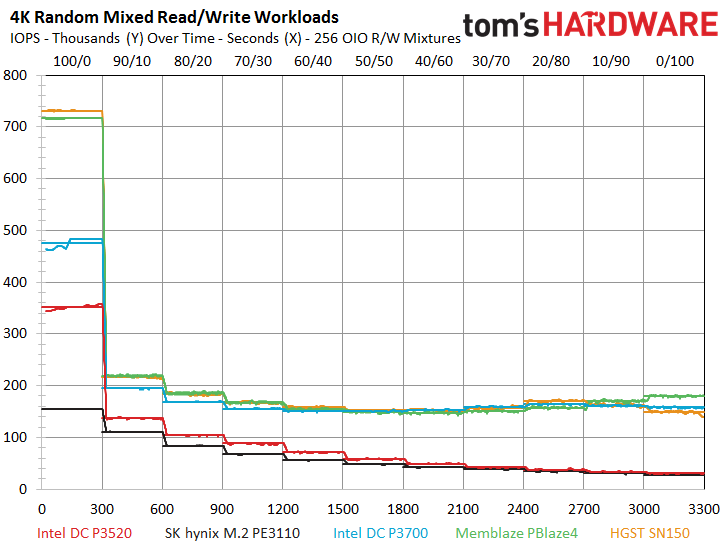
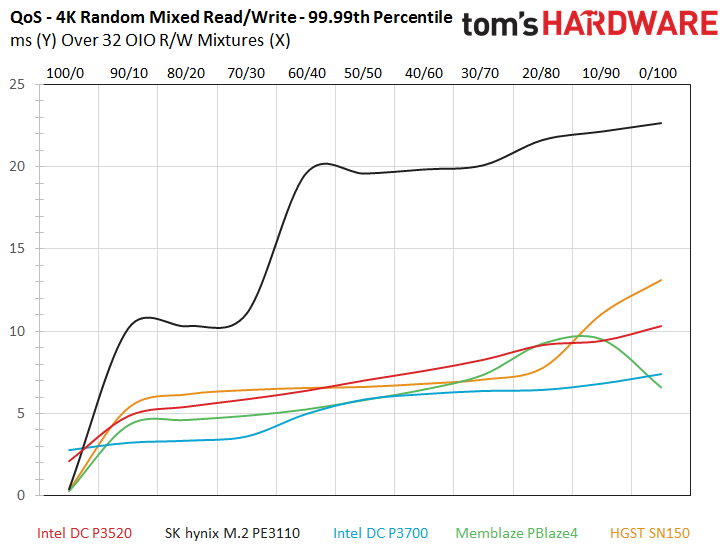
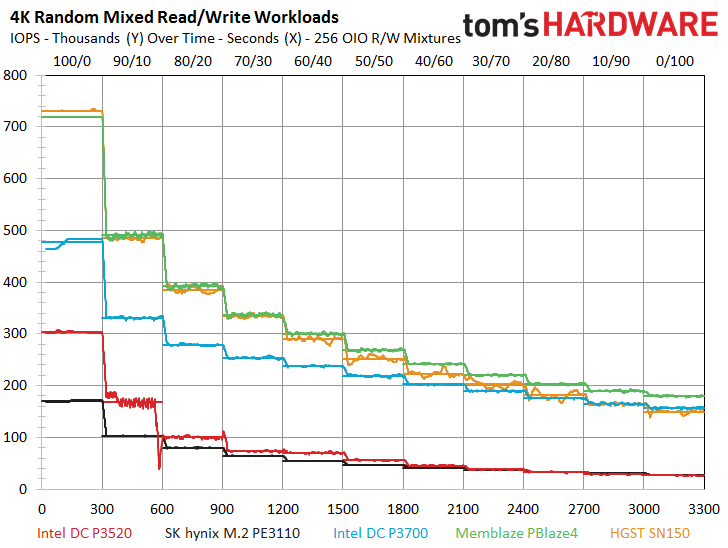
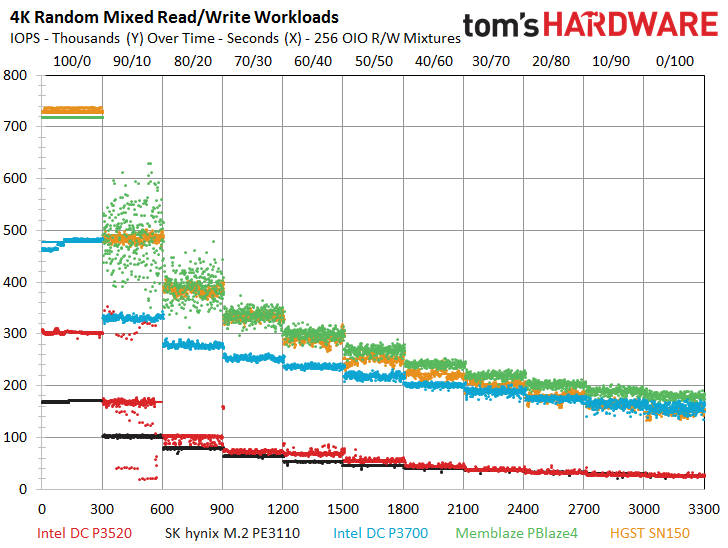
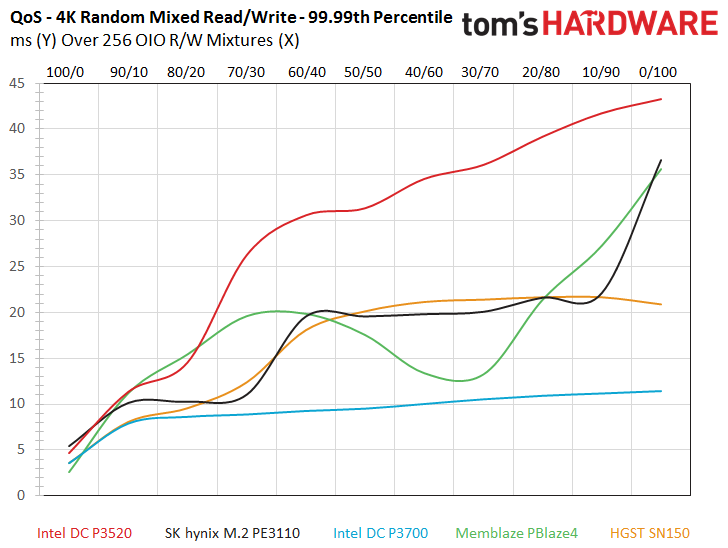
The DC P3520 leverages its faster read performance to surpass the PE3110 through most of the common mixed random workloads (above 50/50 read/write) at both 256 and 32 OIO, though we do note some turbulence with the 90/10 workload at 256 OIO. The value entrants lag behind the full-featured stalwarts, but also provide better consistency than the PBlaze4, which is somewhat surprising. The PE3110 and the DC P3520 jockey for the least-desirable mixed-workload QoS measurements at 32 and 256 OIO, respectively, but it is an acceptable trade-off for the lower price point.
MORE: How We Test Enterprise SSDs
MORE: How We Test Enterprise HDDs
Current page: 4KB Random Read And Write
Prev Page Endurance Matters And Management Next Page 8KB Random Read And Write
Paul Alcorn is the Editor-in-Chief for Tom's Hardware US. He also writes news and reviews on CPUs, storage, and enterprise hardware.
-
Game256 Paul, Chris, any updates regarding possible release dates of Samsung 960 EVO/PRO? Have you received the samples already?Reply -
DocBones Glad to see more u.2 formats, really dont like m.2 for desktops. That 2mm screw is a pain.Reply -
Tom Griffin Am I am idiot but should this be on Tom's IT Pro? Aside from that the M.2 for an enterprise drive simply does not jive on current motherboards look at PCIe lane allocation. 4x lanes one drive even the high end CPUs with 40 lanes will choke with more than 4.Reply -
bit_user Reply
You might be right, but I'm glad it's not. It represents superb read-oriented SSD performance. Especially for the price.18682745 said:this be on Tom's IT Pro?
It's not M.2. They have PCIe add-in cards and U.2 form factors. M.2 wouldn't fly, due to the power dissipation, if not also the board area needed.18682745 said:Aside from that the M.2 for an enterprise drive
How many of these are you planning to use? This is for read-intensive workloads, so you'd hopefully just need one, which could be paired with cheaper storage for everything else. I guess at the high end, you might pack a machine full of them, but then you might have more than one CPU (which adds yet more PCIe lanes).18682745 said:simply does not jive on current motherboards look at PCIe lane allocation. 4x lanes one drive even the high end CPUs with 40 lanes will choke with more than 4.
BTW, did you know that M.2 is a popular form factor for high-end desktop SSDs? It supports up to 4-lanes. So, it would seem that some people think such performance is worth the resource footprint. -
bit_user ReplyThe P3520 actually takes a step back on the performance front in comparison to the previous-generation DC P3500, which featured up to 430,000/28,000 read/write IOPS.
Given the deals out there to be had, the real star of the show is the DC P3500. If you can live with the lower endurance than the P3520, it offers a compelling alternative to the 750-series. Here's how they compare:
http://ark.intel.com/compare/86740,82846
Update: snagged a 400 GB DC S3500 at $225. Price is now back up to $275. Worth keeping an eye on, if you're interested. Supposedly, a full-height bracket is included in the box. I'll update again, to confirm. -
bit_user I'm just interested in the read performance, but I noticed two pairs of images that are nearly identical. I loaded them in different tabs and flipped back and forth. The only difference seems to be whether the lines from different queue depths are connected.Reply
http://media.bestofmicro.com/ext/aHR0cDovL21lZGlhLmJlc3RvZm1pY3JvLmNvbS9leHQvYUhSMGNEb3ZMMjFsWkdsaExtSmxjM1J2Wm0xcFkzSnZMbU52YlM5R0x6WXZOakV3T1RZeUwyOXlhV2RwYm1Gc0x6QXpMbkJ1Wnc9PS9yXzYwMHg0NTAucG5n/rc_400x300.png
http://media.bestofmicro.com/ext/aHR0cDovL21lZGlhLmJlc3RvZm1pY3JvLmNvbS9leHQvYUhSMGNEb3ZMMjFsWkdsaExtSmxjM1J2Wm0xcFkzSnZMbU52YlM5R0x6a3ZOakV3T1RZMUwyOXlhV2RwYm1Gc0x6QTBMbkJ1Wnc9PS9yXzYwMHg0NTAucG5n/rc_400x300.png
And:
http://media.bestofmicro.com/ext/aHR0cDovL21lZGlhLmJlc3RvZm1pY3JvLmNvbS9leHQvYUhSMGNEb3ZMMjFsWkdsaExtSmxjM1J2Wm0xcFkzSnZMbU52YlM5R0x6Y3ZOakV3T1RZekwyOXlhV2RwYm1Gc0x6QXhMbkJ1Wnc9PS9yXzYwMHg0NTAucG5n/rc_400x300.png
http://media.bestofmicro.com/ext/aHR0cDovL21lZGlhLmJlc3RvZm1pY3JvLmNvbS9leHQvYUhSMGNEb3ZMMjFsWkdsaExtSmxjM1J2Wm0xcFkzSnZMbU52YlM5R0x6Z3ZOakV3T1RZMEwyOXlhV2RwYm1Gc0x6QXlMbkJ1Wnc9PS9yXzYwMHg0NTAucG5n/rc_400x300.png
Not really a complaint - just an observation. As long as the data is accurate, no harm done.
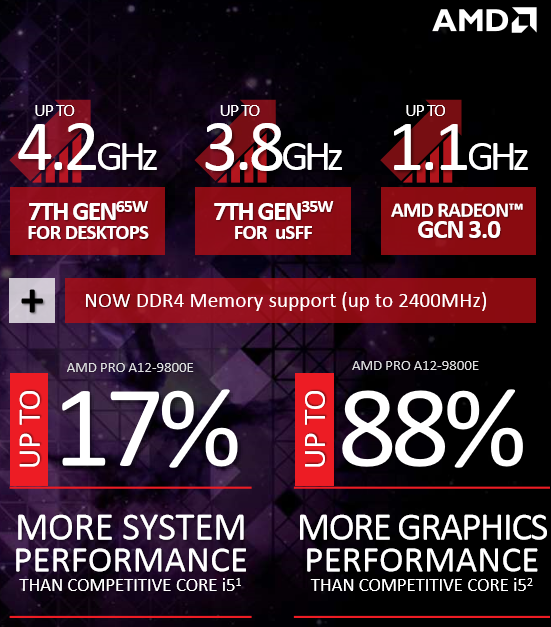
Then, at the end of the read graphs, it seems like some AMD slides crept in? Oops?
BTW, the Latency vs. IOPS is now officially my second favorite SSD performance graph (after IOPS vs. queue depth, of course).

